Close
0%
0%

Mycodo - Environmental Regulation System

Bringing industrial automation and regulation to everyone.

Similar projects worth following
Since the dawn of humankind, we've battled against nature. It was only when we realized nature could be our ally that we learned from it what we needed to thrive. This understanding led to increased productivity in all aspects of life. In addition to giving us back time, automation and regulation enabled us to control the exact variables to produce the most exquisite fruits, mushrooms, meats, cheeses, beers, wines, tobaccos, and other products. It also enabled such things as in vitro DNA replication (thermal cycler for PCR), reflow soldering, and more. This is what I want to make accessible to everyone.

Mycodo is currently being used by people around the world to automate in ways that were once only possible with industrial control systems. I'm constantly surprised and delighted by the ways people use Mycodo.

Background

Mycodo was originally developed for cultivating gourmet mushrooms. Although variations exist between species, mushrooms share the commonality that they all require specific environmental conditions to produce quality yields. Temperature, humidity, and carbon dioxide concentration have been identified as the most crucial factors for promoting mycelial colonization, primordia formation, and fruiting body (mushroom) growth. Additionally, each stage of development requires specific conditions for optimal development. The more precise these conditions can be controlled, the greater the potential quality and quantity.

The same principles can be applied to other areas of production. To this end, Mycodo has assisted in plant and mushroom cultivation, cheese aging, tobacco leaf fermentation/curing, food fermentation (beer, wine, tempeh, sauerkraut, kombucha, kimchi), sous-vide cooking, monitoring weather conditions, incubating snake eggs and mice, maintaining aquaculture farms, regulating temperature and humidity in a laboratory honey bee apiary for scientific research, regulating humidity in an artificial bat cave used for scientific research, and more.

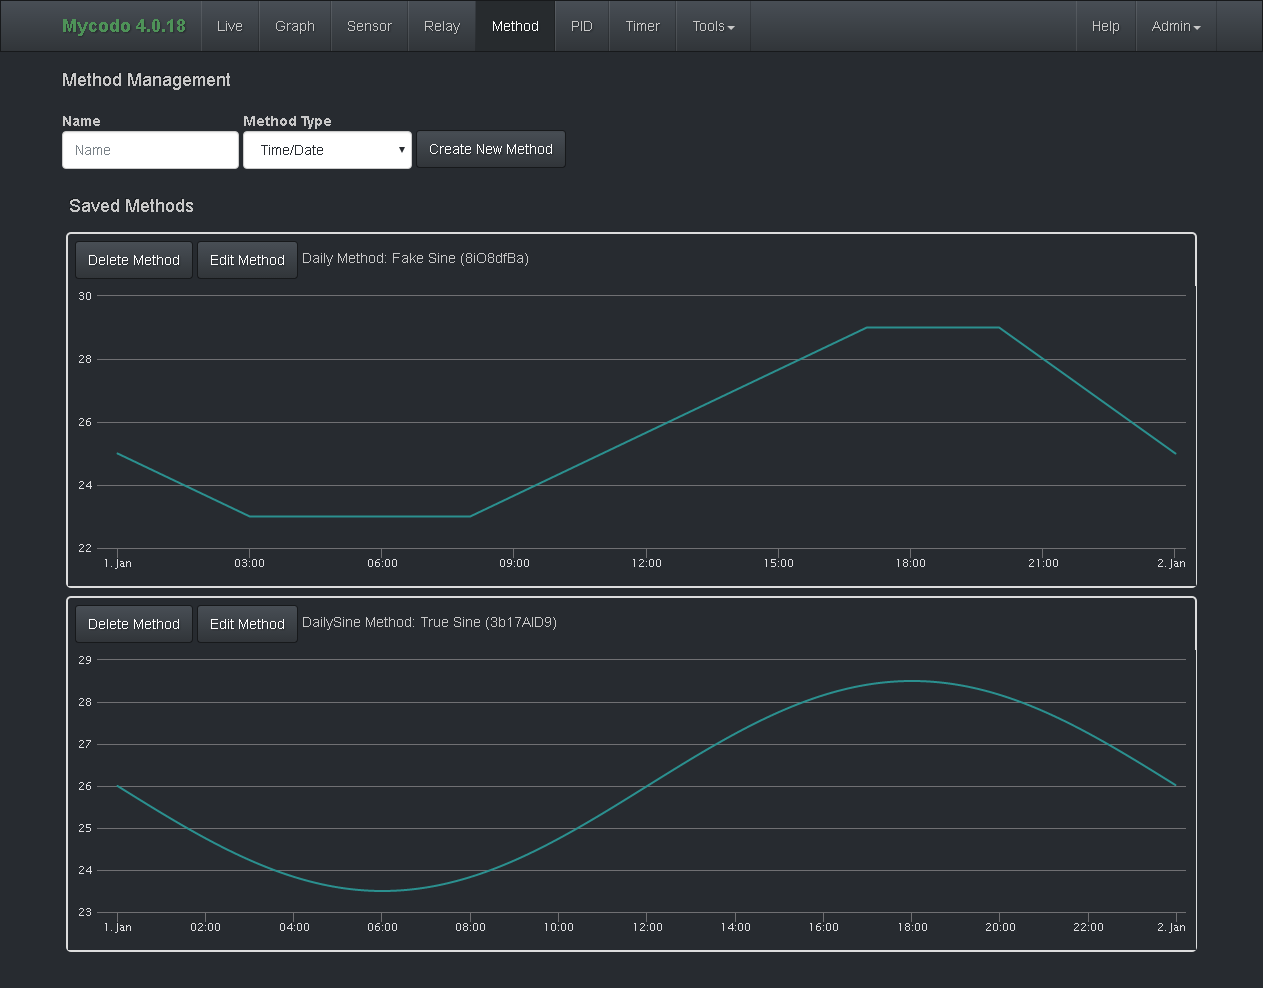
Mycodo is free to use and modify (GPLv3), runs on the inexpensive Raspberry Pi, is easy to set up, and can be used with a wide variety of inexpensive sensors and hardware. Several popular digital sensors are supported, as well as analog sensors (with the use of an analog-to-digital converter). Sensors may also be used with an I2C multiplexer to enable the use of multiple sensors that share the same I2C address.


My Recent Projects Using Mycodo
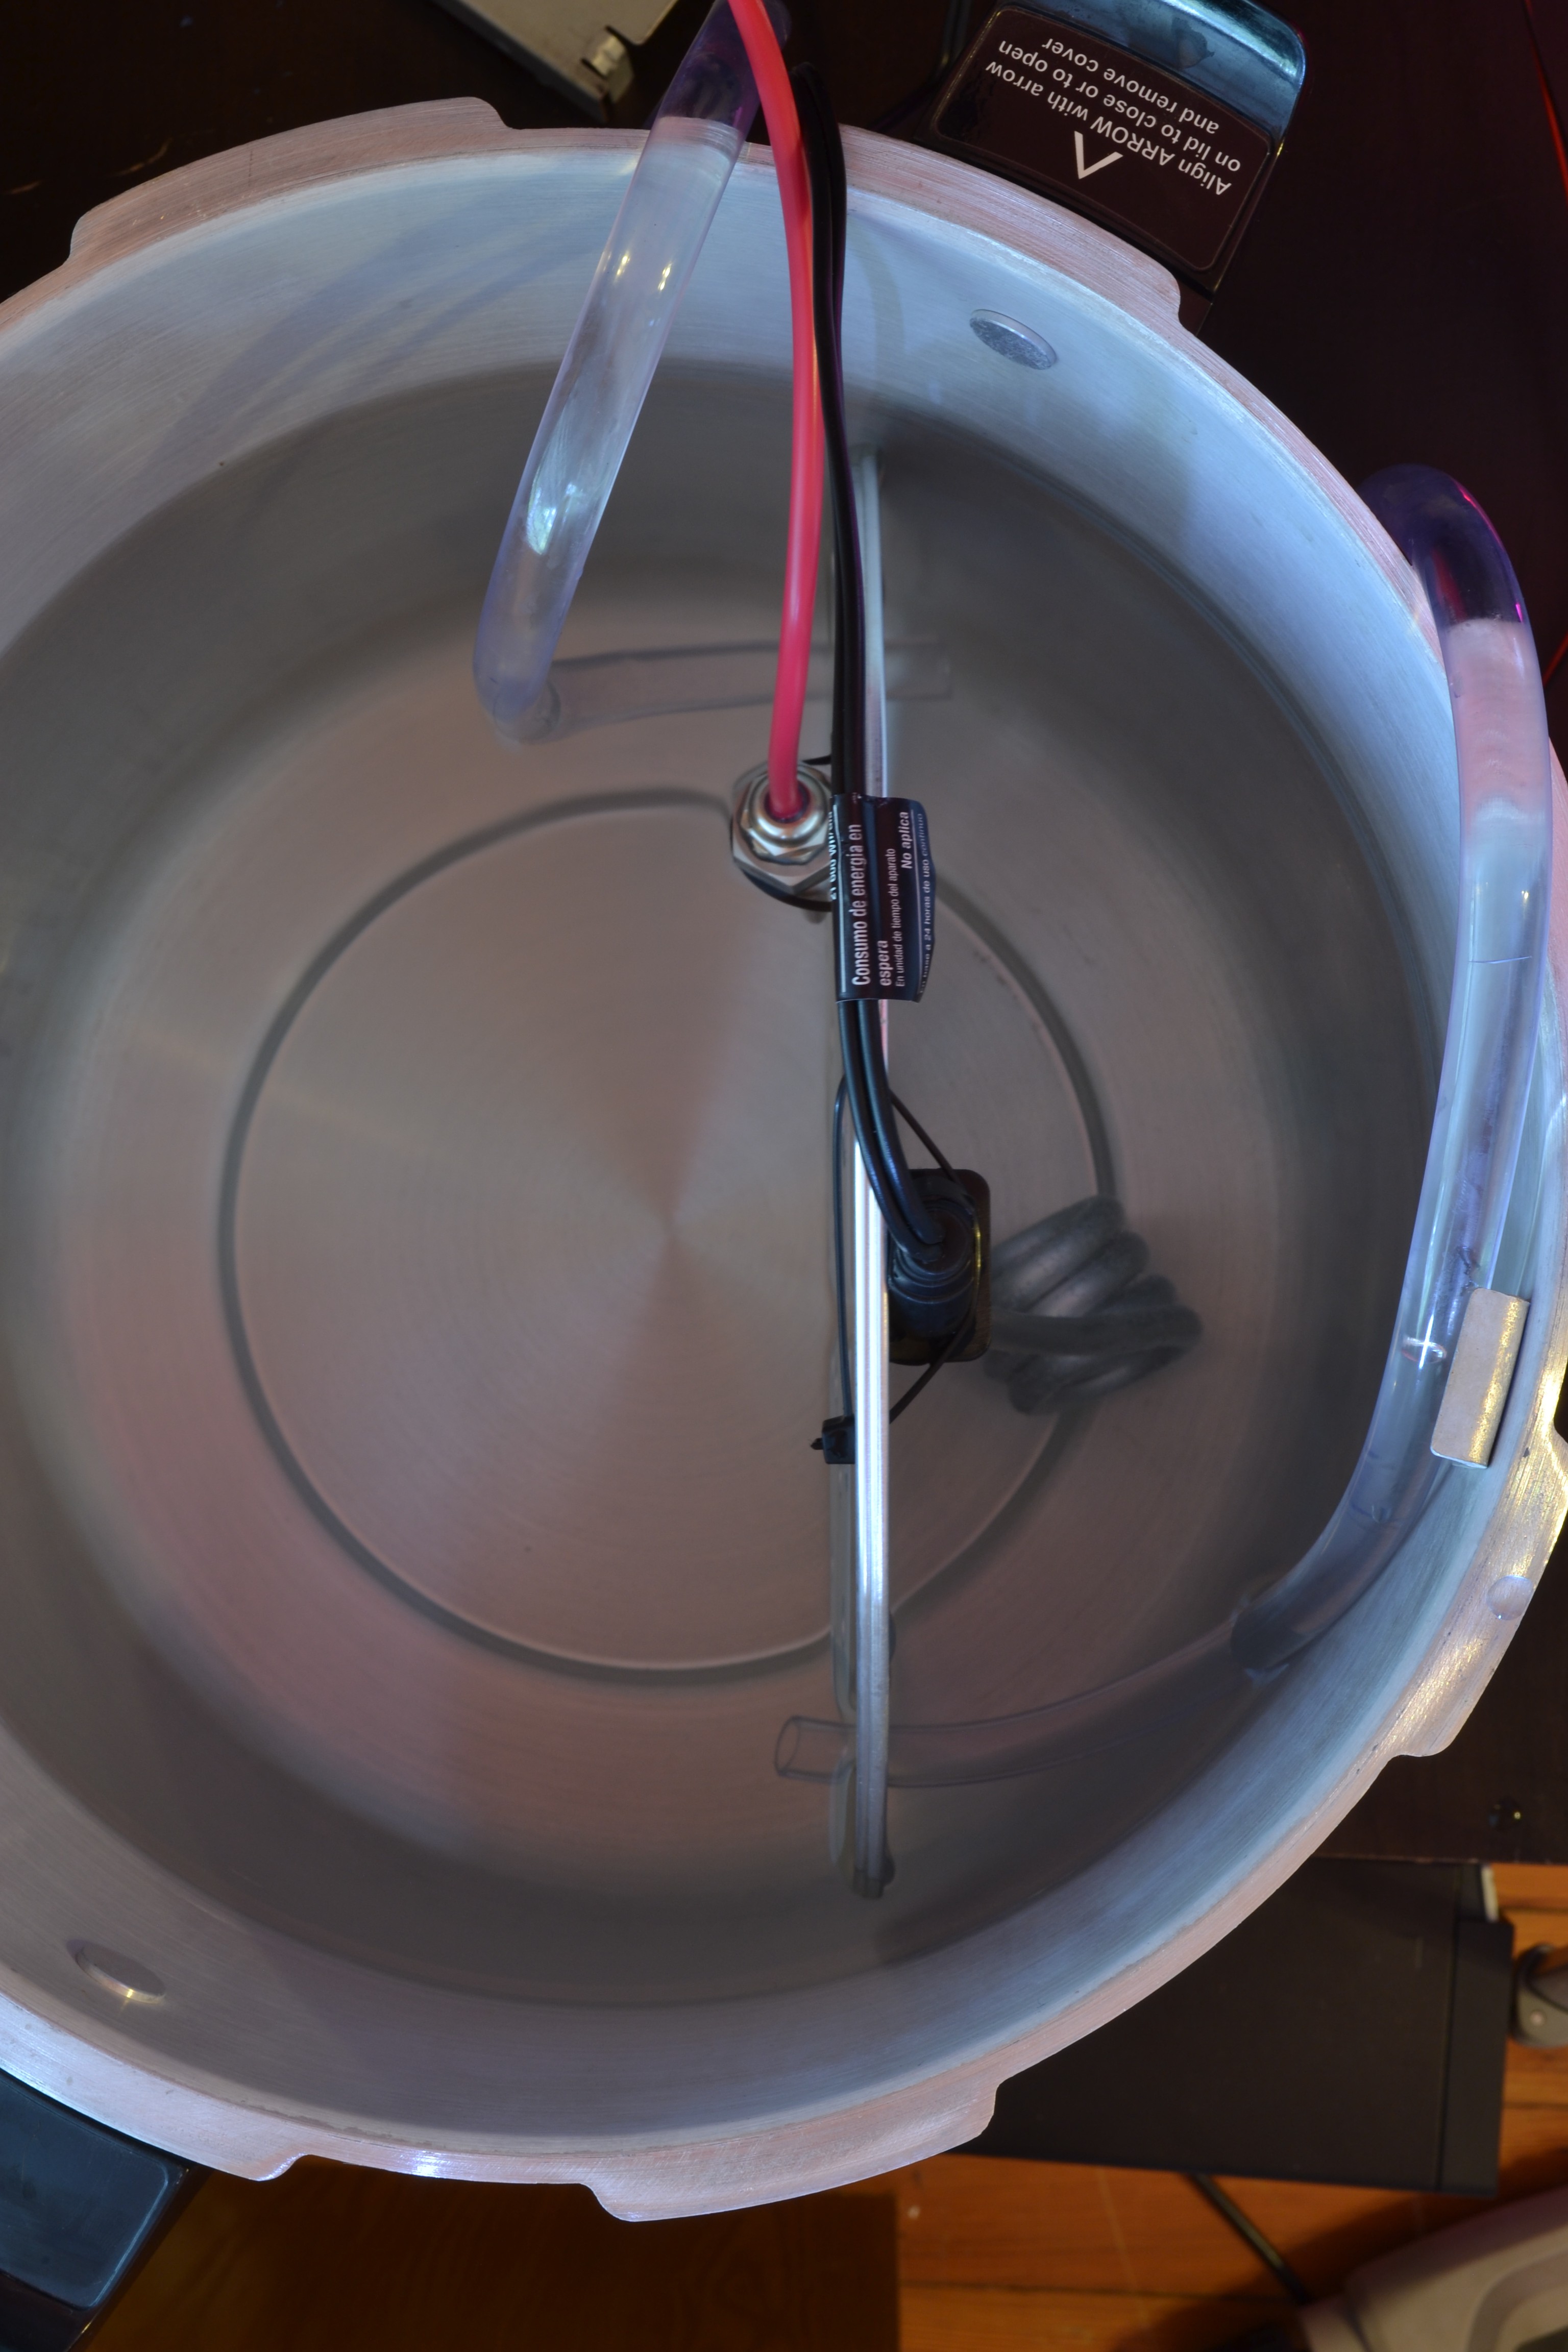
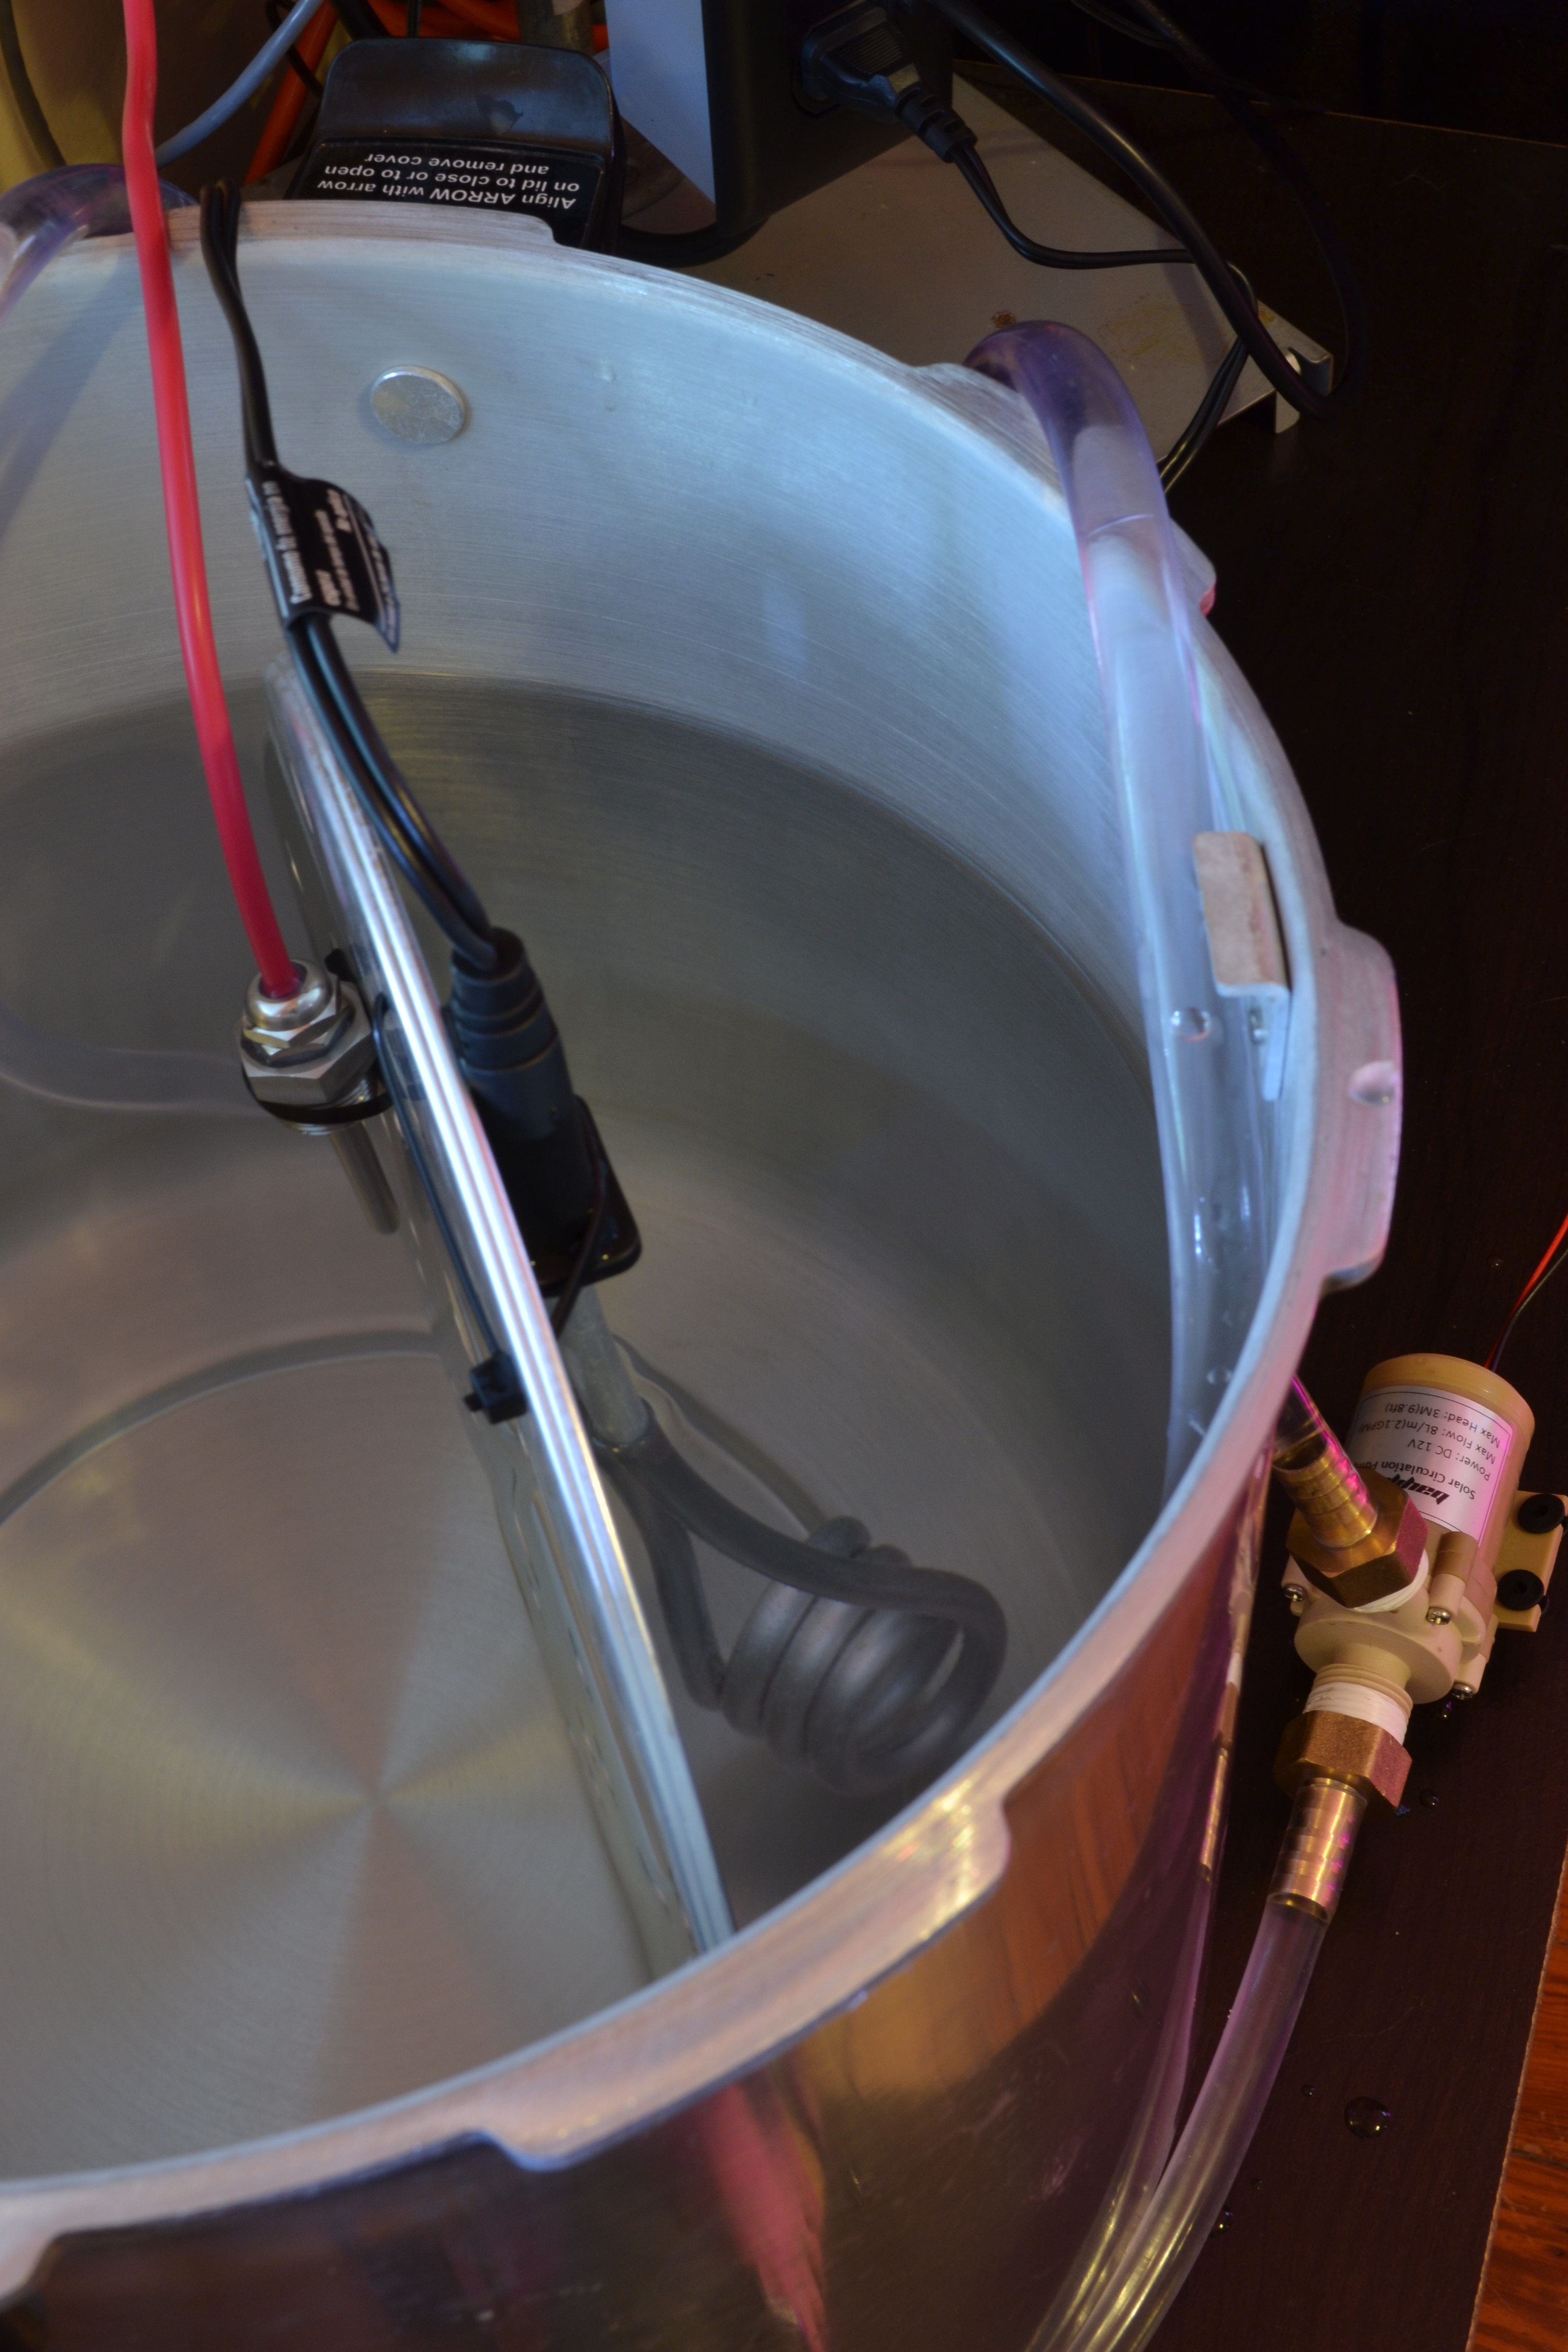
Sous Vide Cooking

The name of this cooking style translates from French to "under vacuum," and relies on the thermal regulation of a water bath to slowly cook food (commonly meats). The name comes from the preparation of vacuum-sealing the food in a bag to increase thermal transfer from the water, reduce oxidation, reduce evaporative loss of flavor volatiles and moisture, and reduce aerobic microorganism growth. This method enables precise cooking and reproducibility to attain the perfect doneness and texture, with next to a 0% chance of overcooking, resulting in exquisitely-flavorful and nutritious foods. A write-up and video of my sous vide culinary journey is expected to replace this summary very soon. Read more about the science of sous vide in Sous vide cooking: A review (2012).


Plant Cultivation

With my $1000 startup funds from advancing to the finals of the Hackaday Prize, I invested in a plant grow tent, light system, and high-pressure water pump, to experiment with growing plants indoors and advance the Mycodo software and hardware to better support plant cultivation. With energy, water, and food crops being some of out most precious resources, the ability to efficiently grow and experiment with crop growth is becoming ever-more important. A write-up and video of automated plant cultivation is also expected to replace this summary very soon.


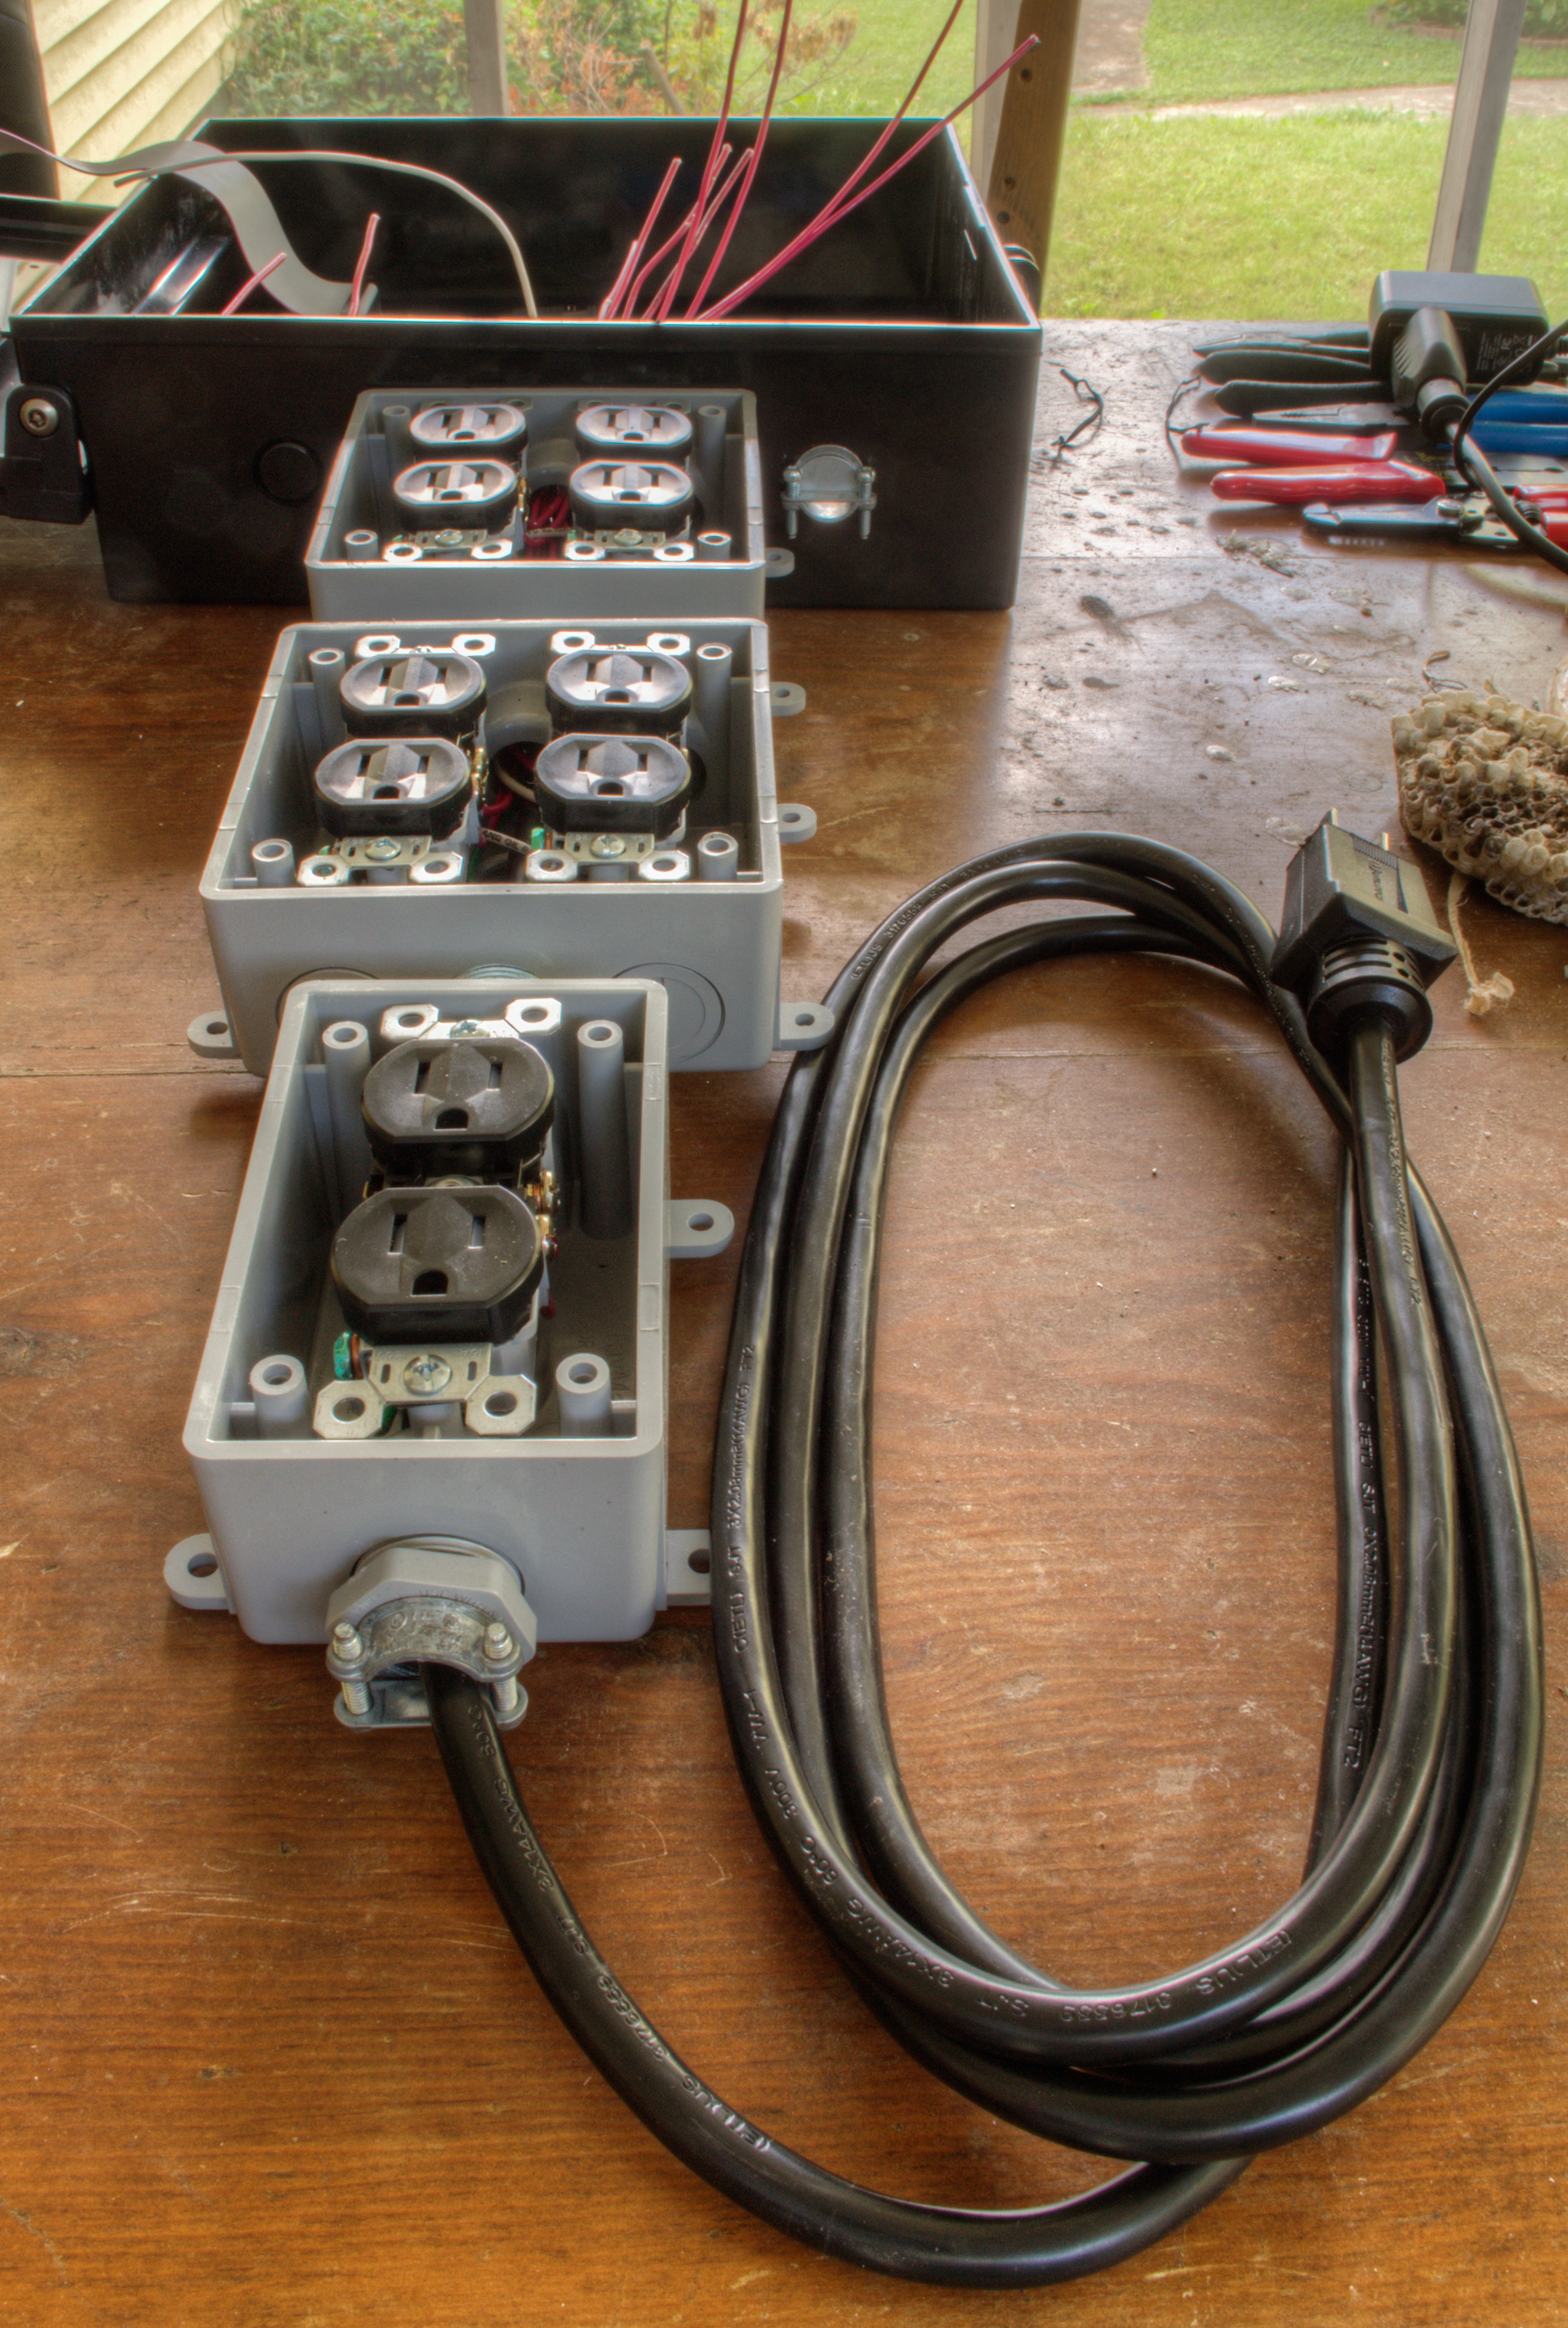
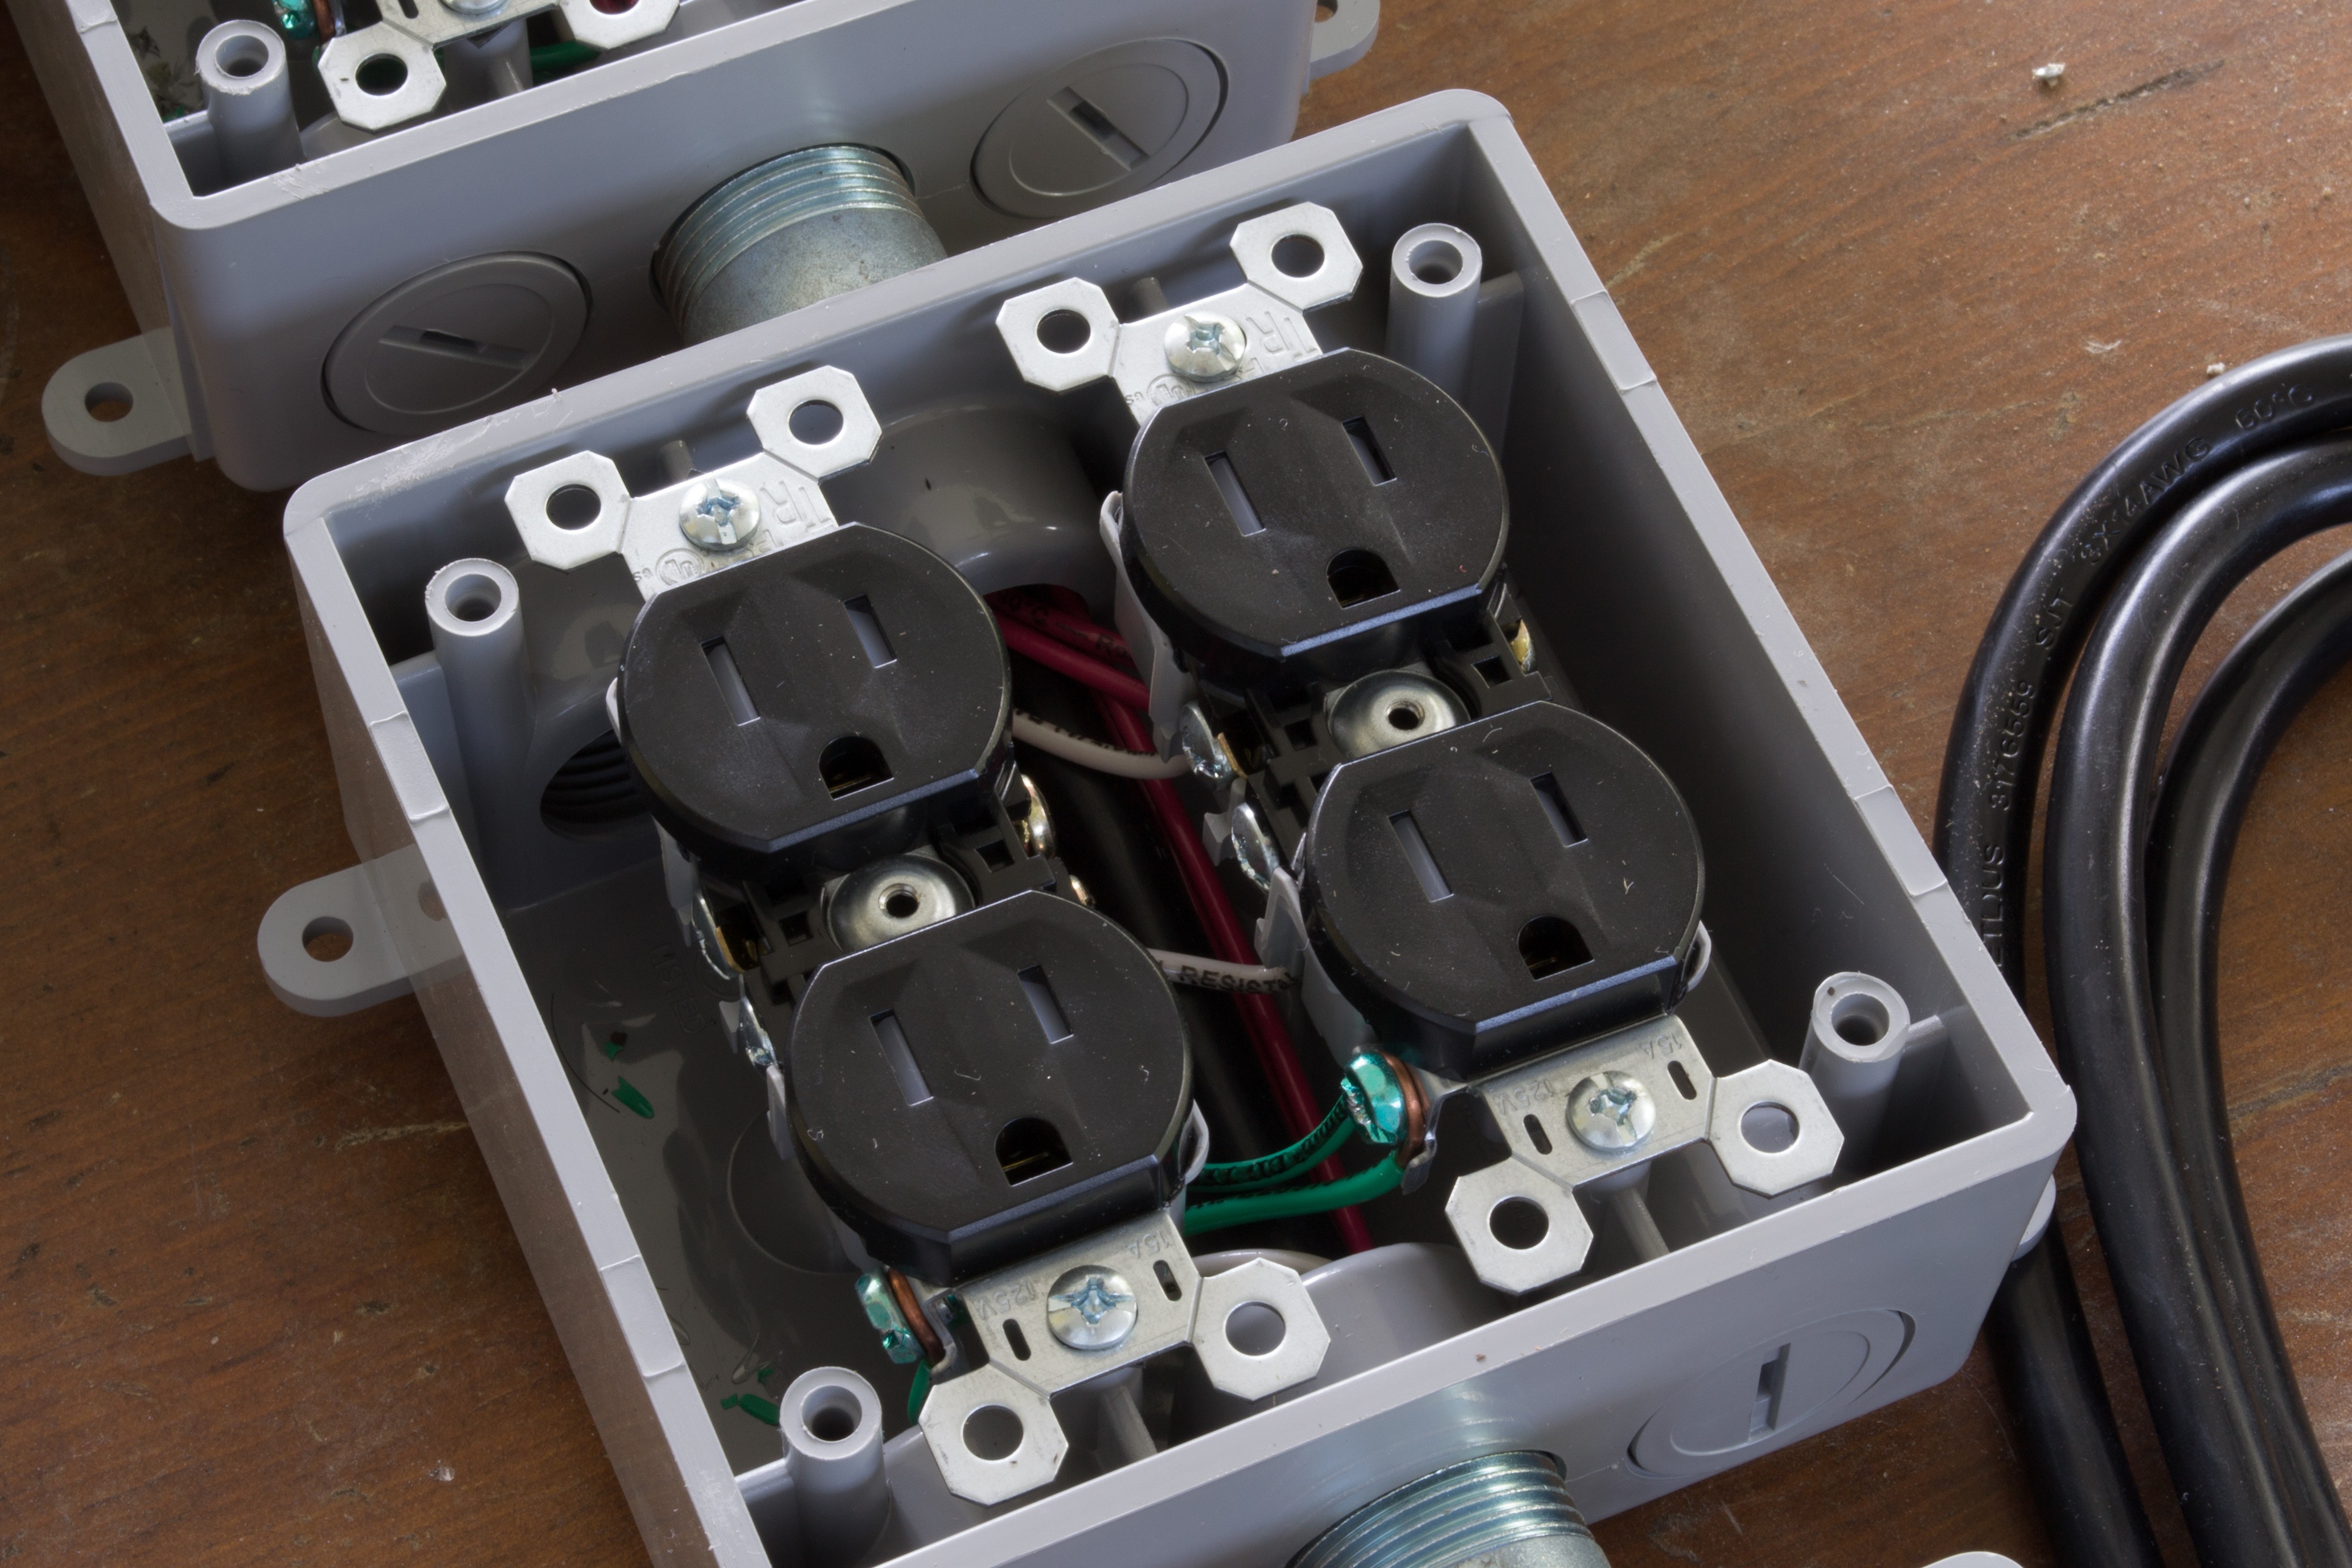
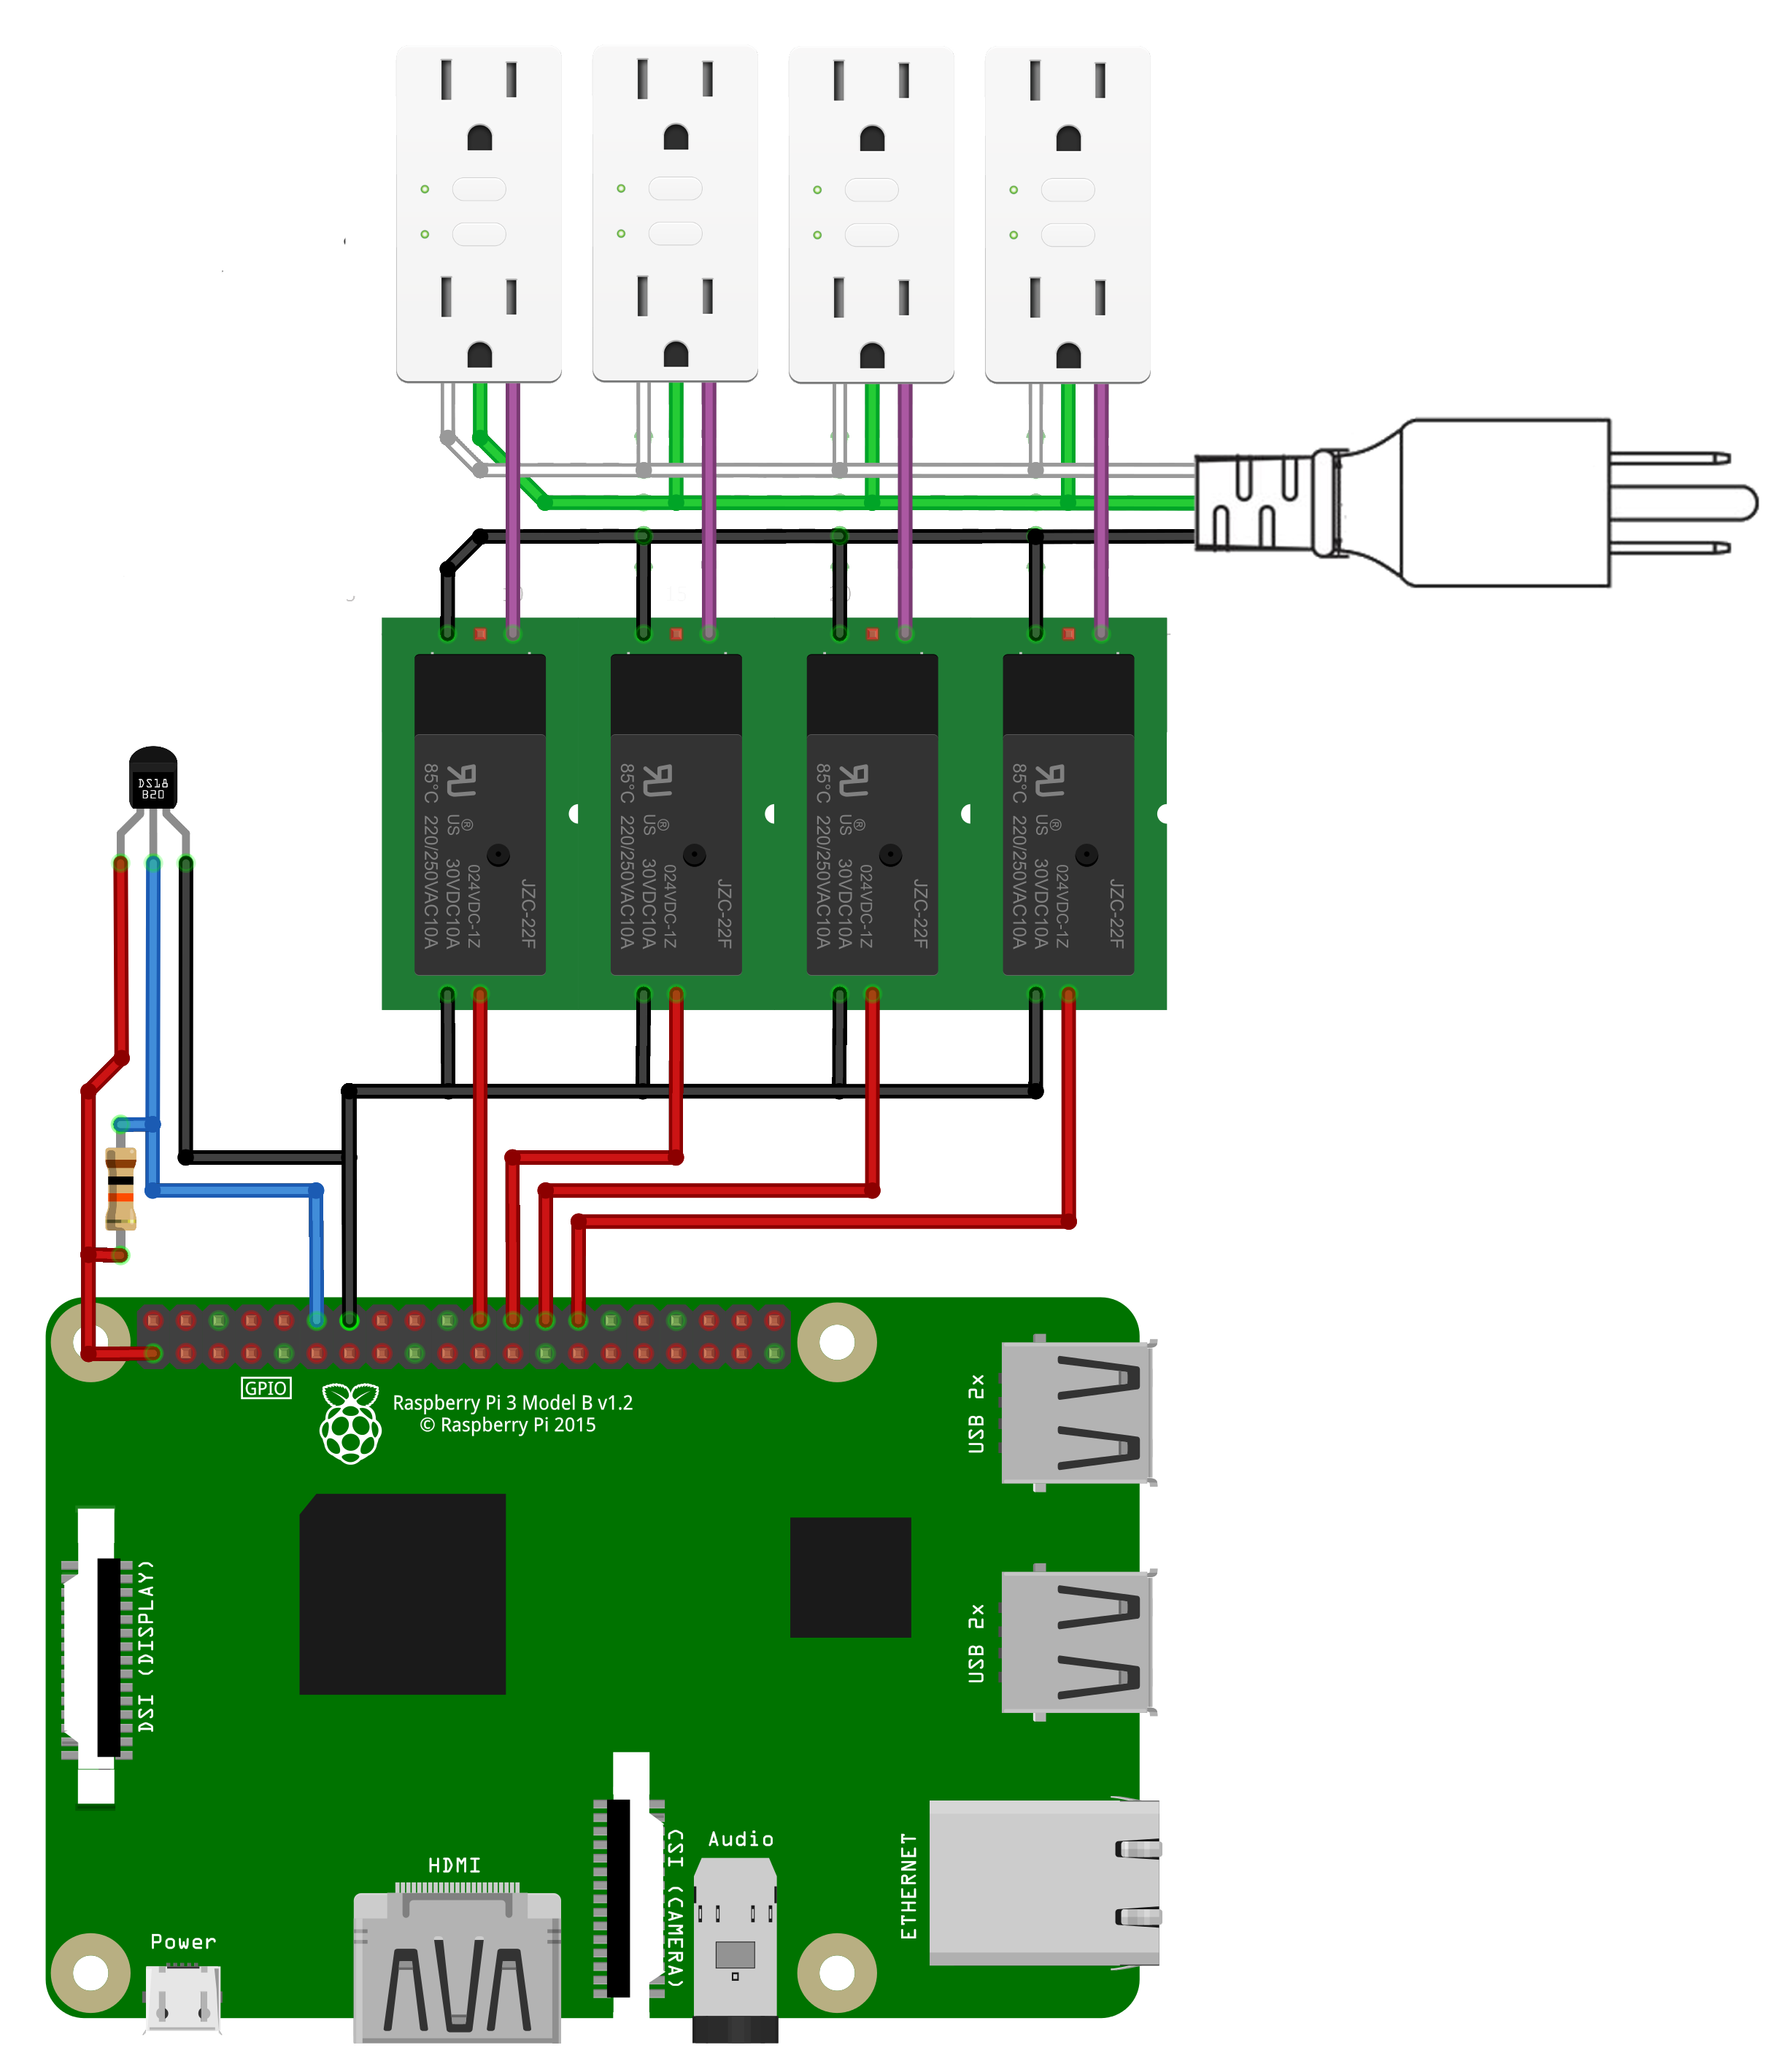
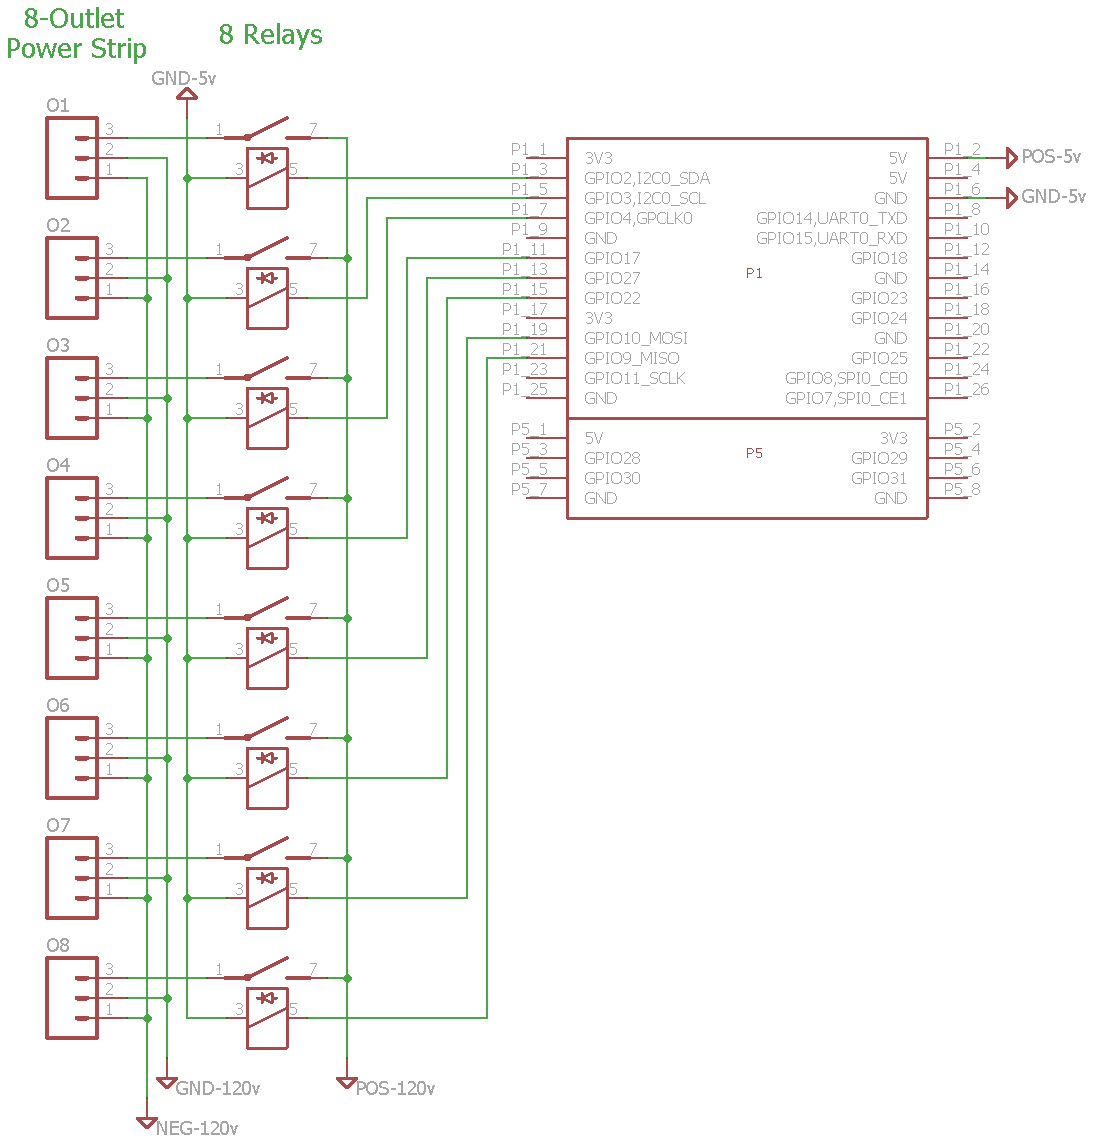
Mushroom Cultivation

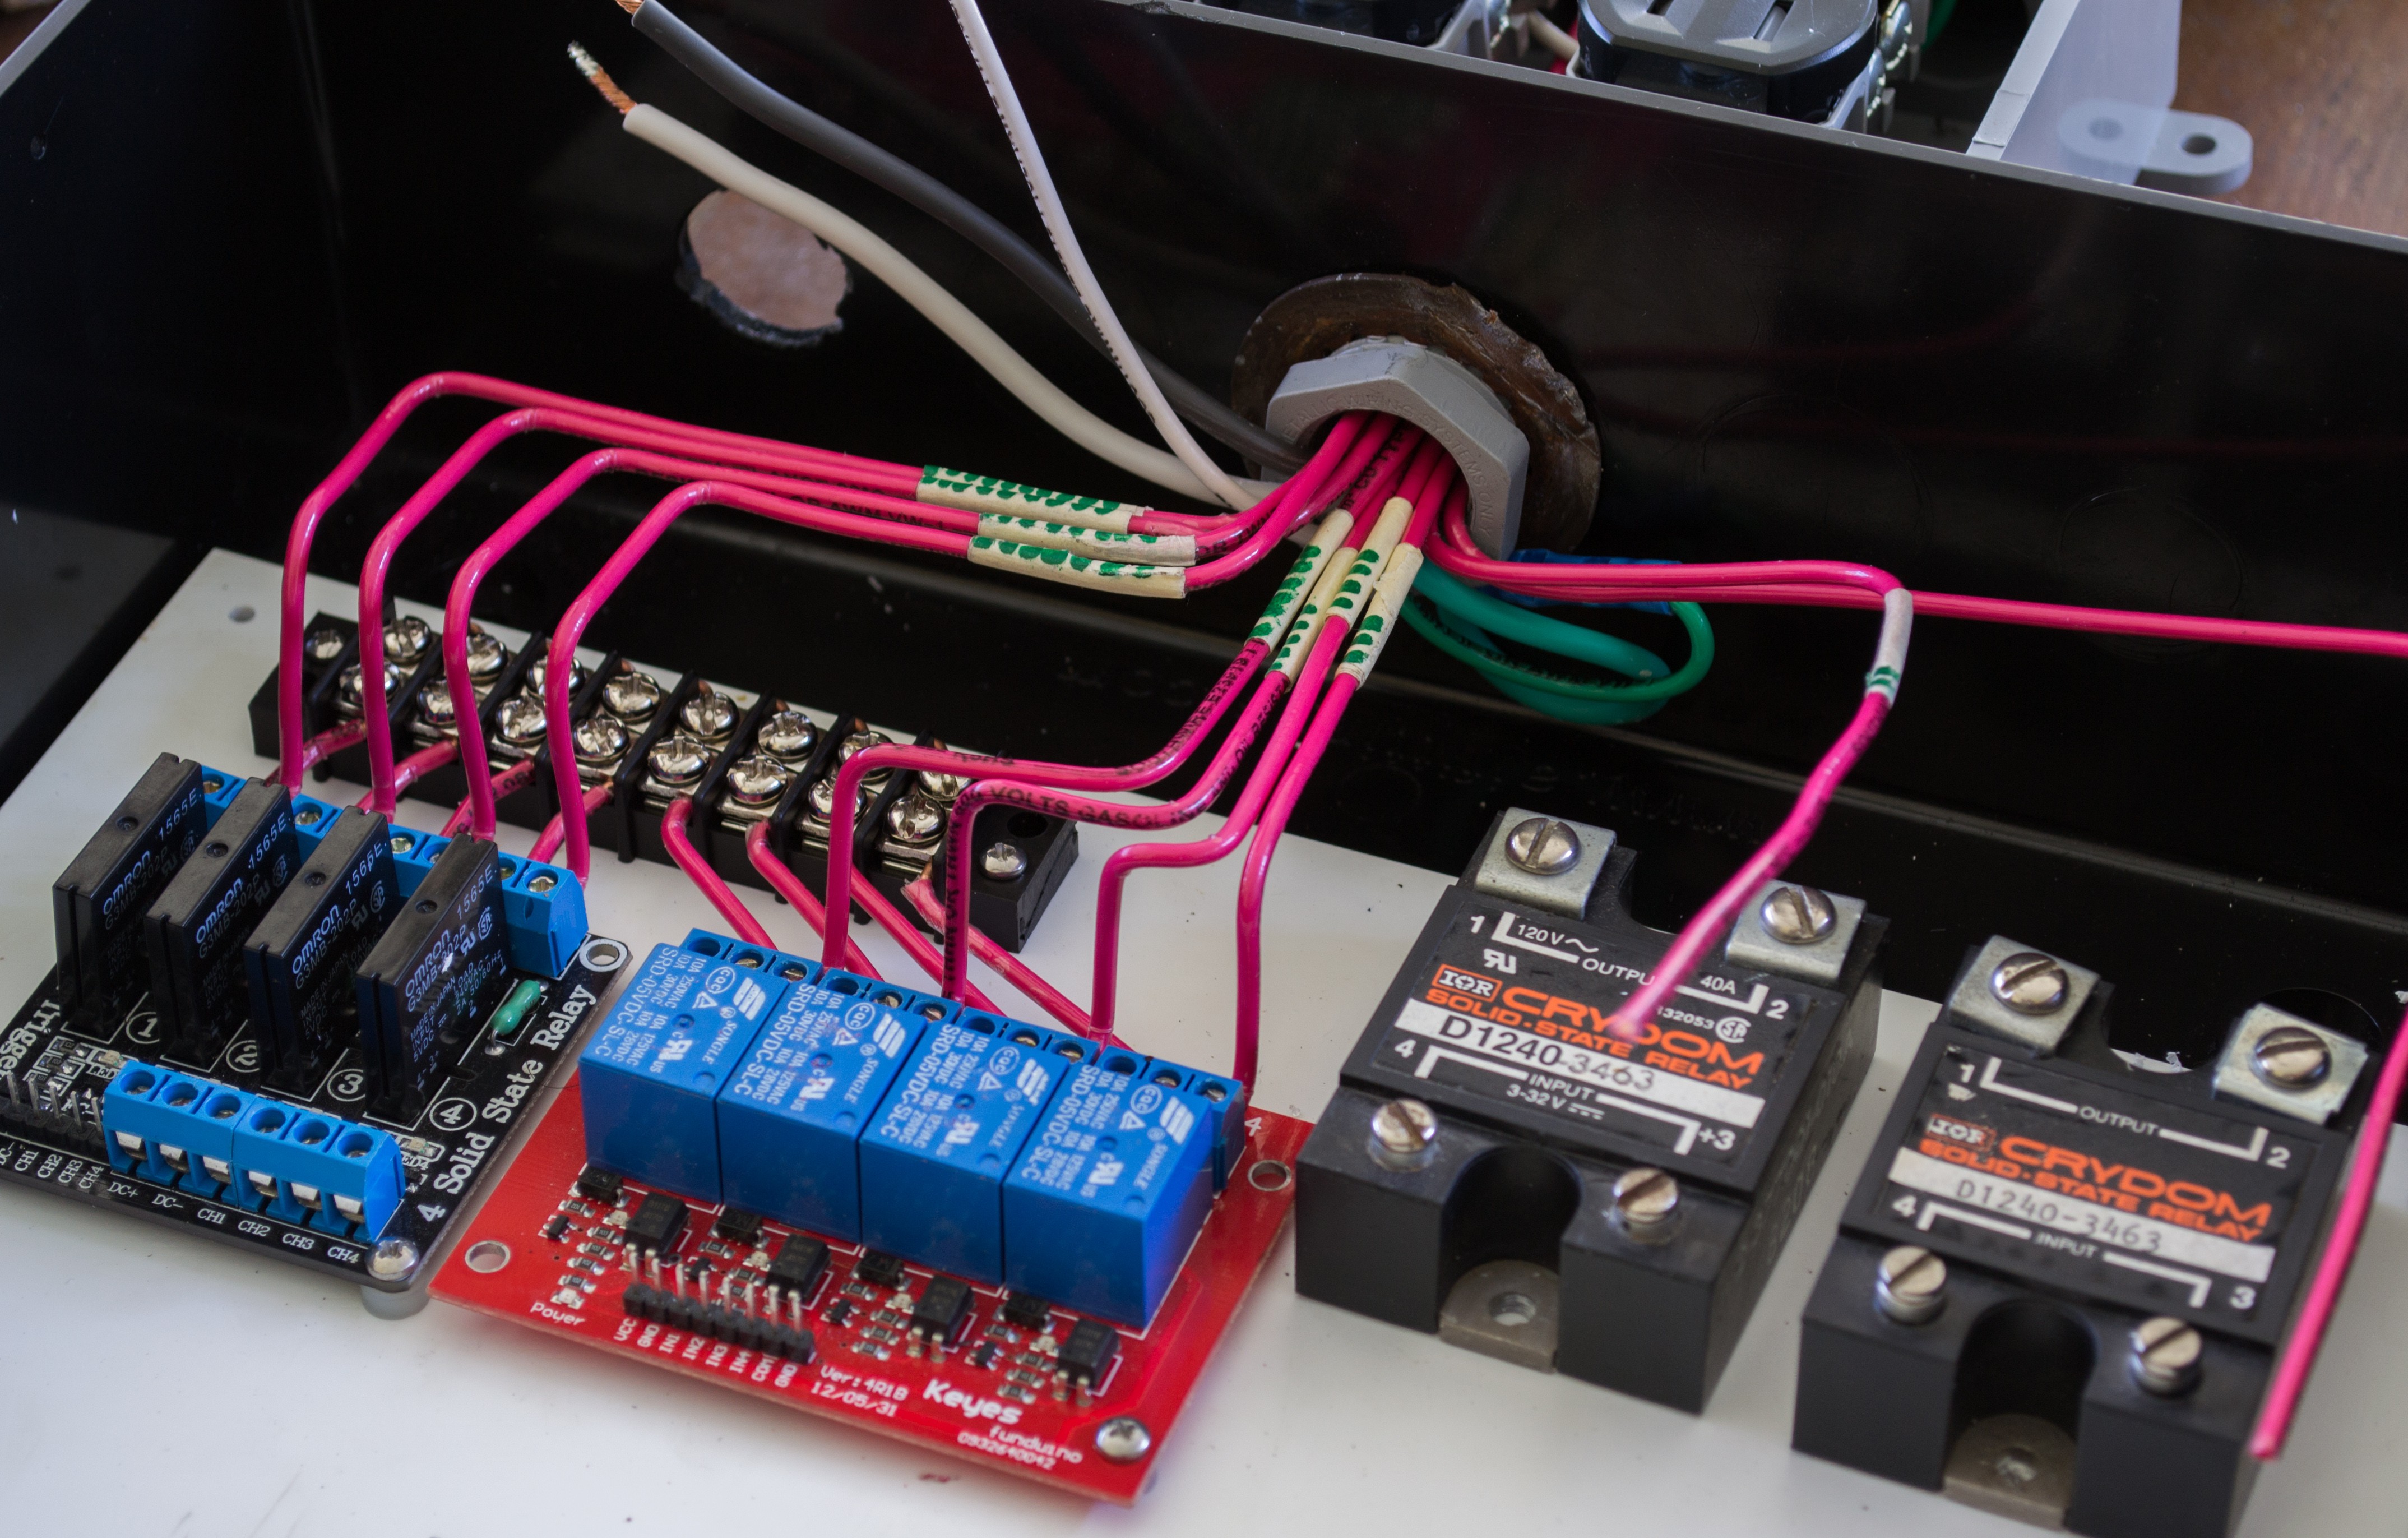
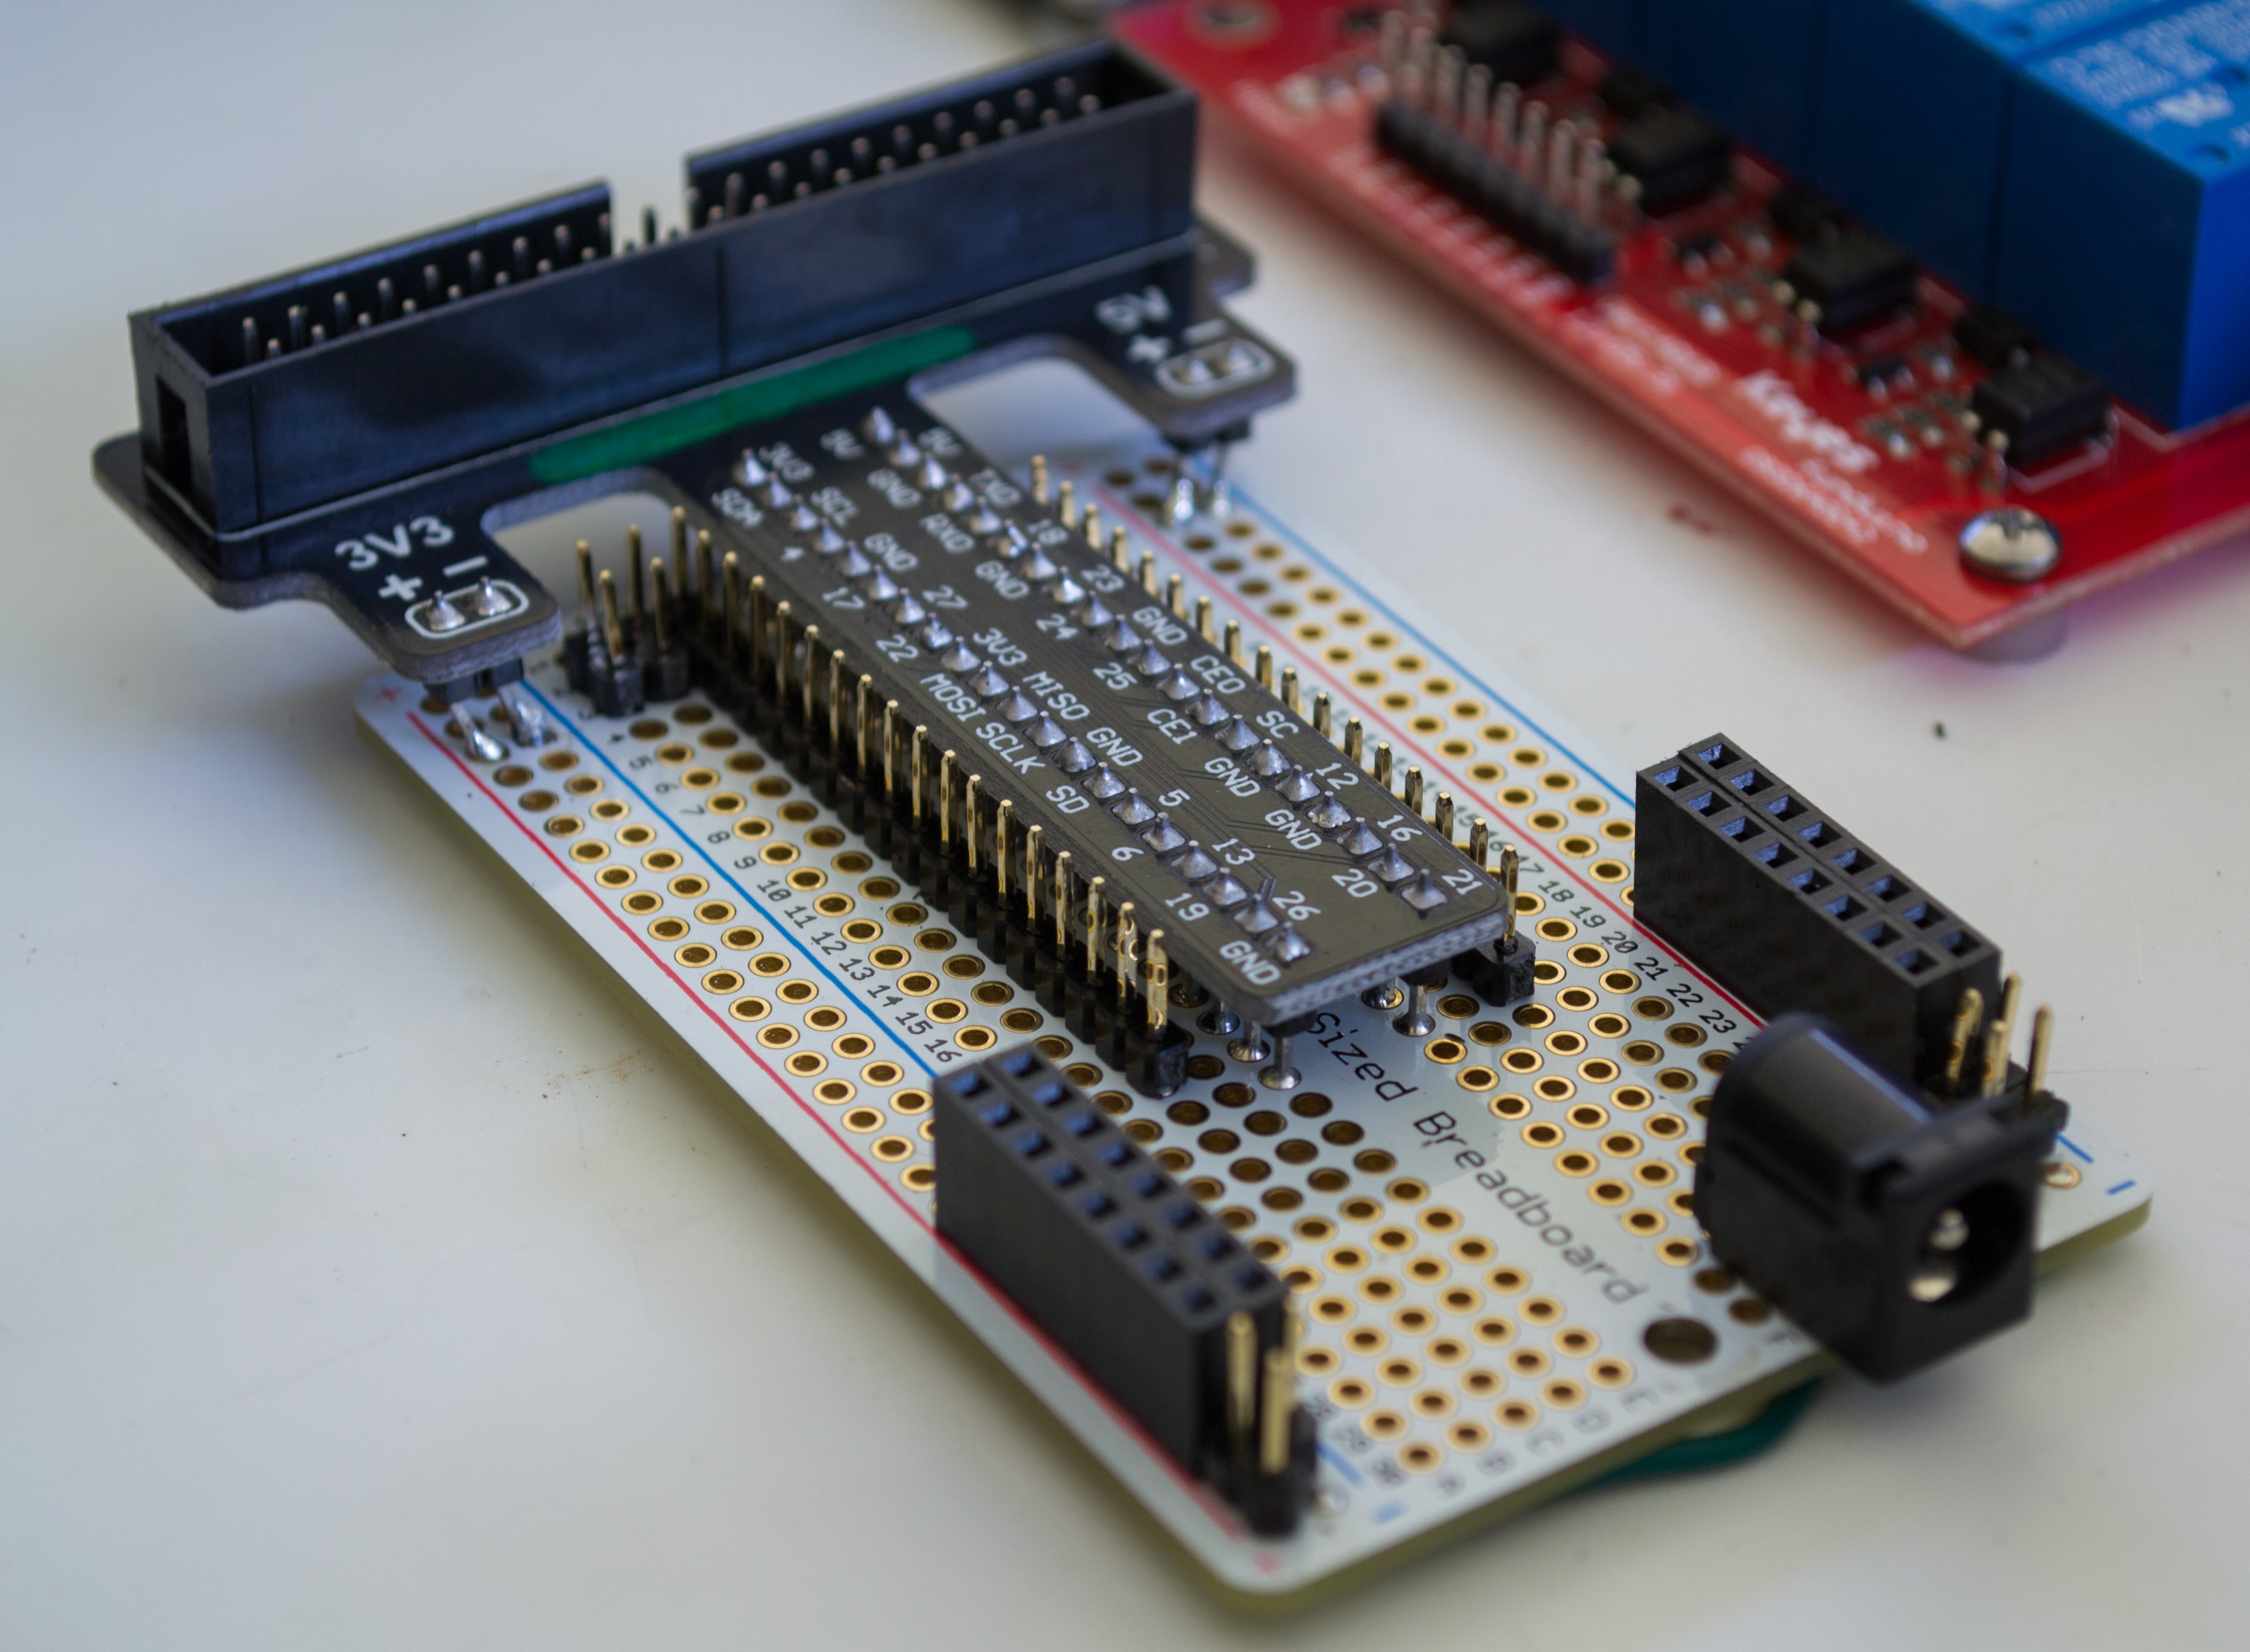
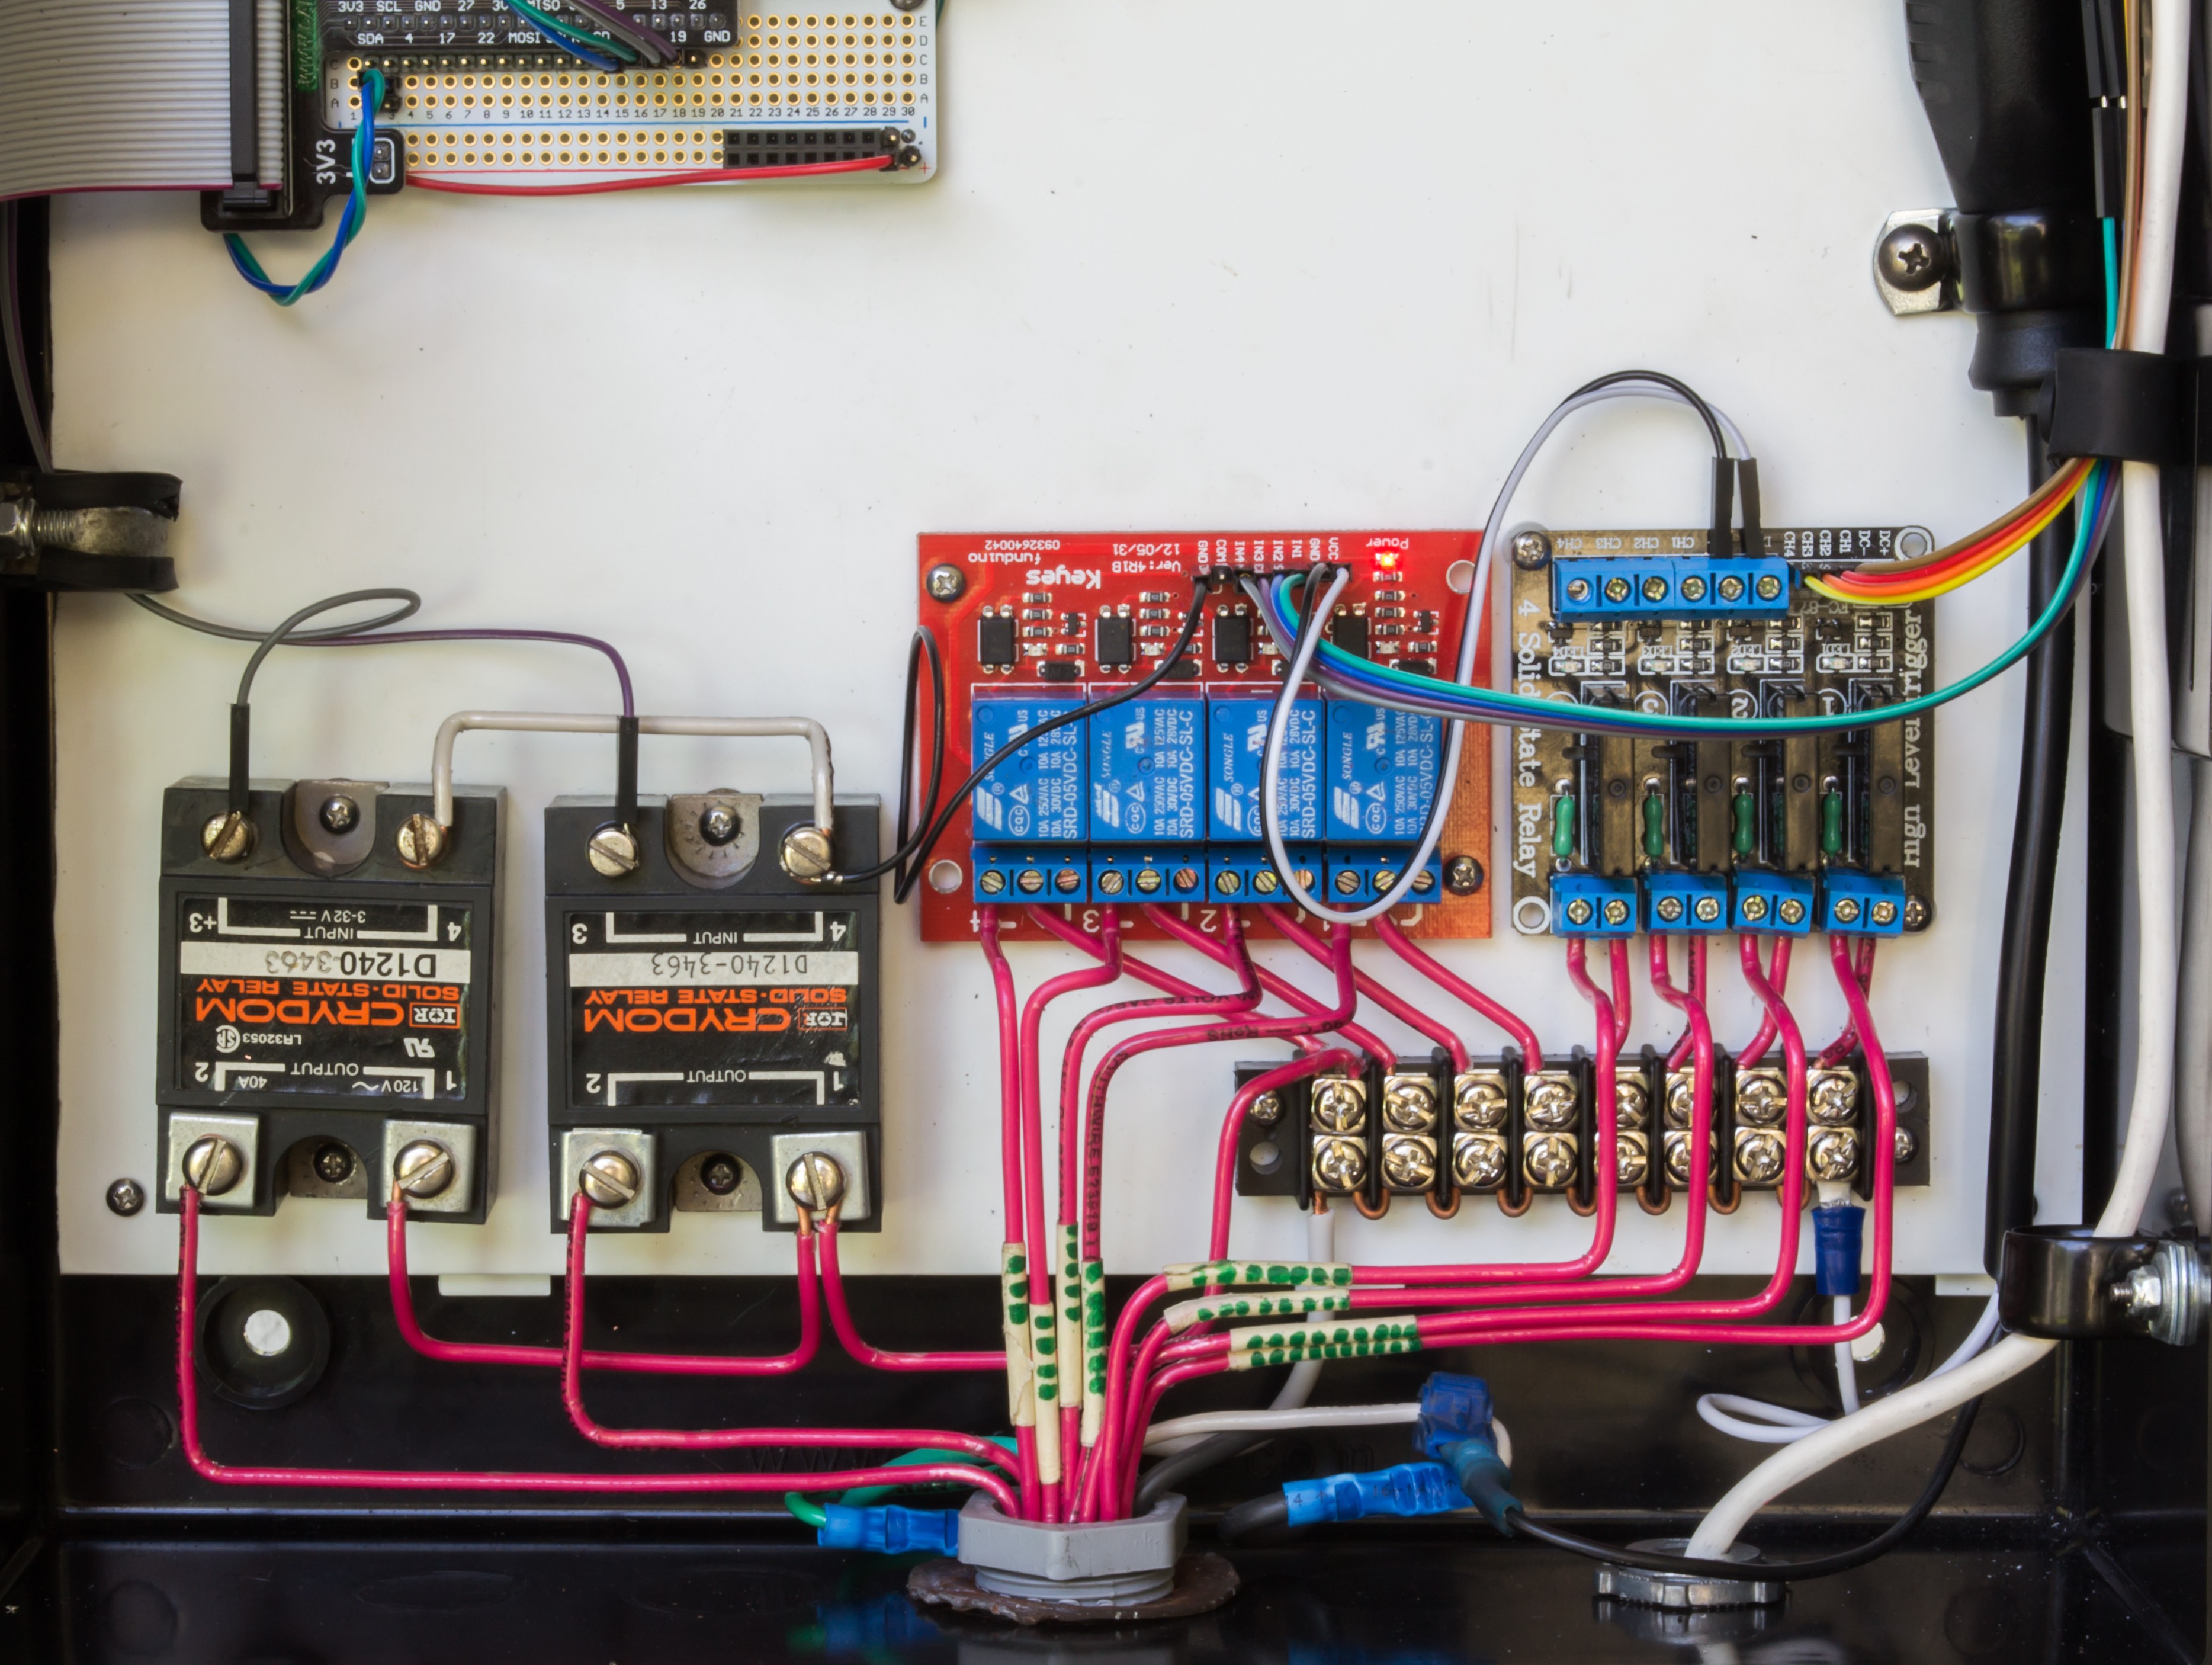
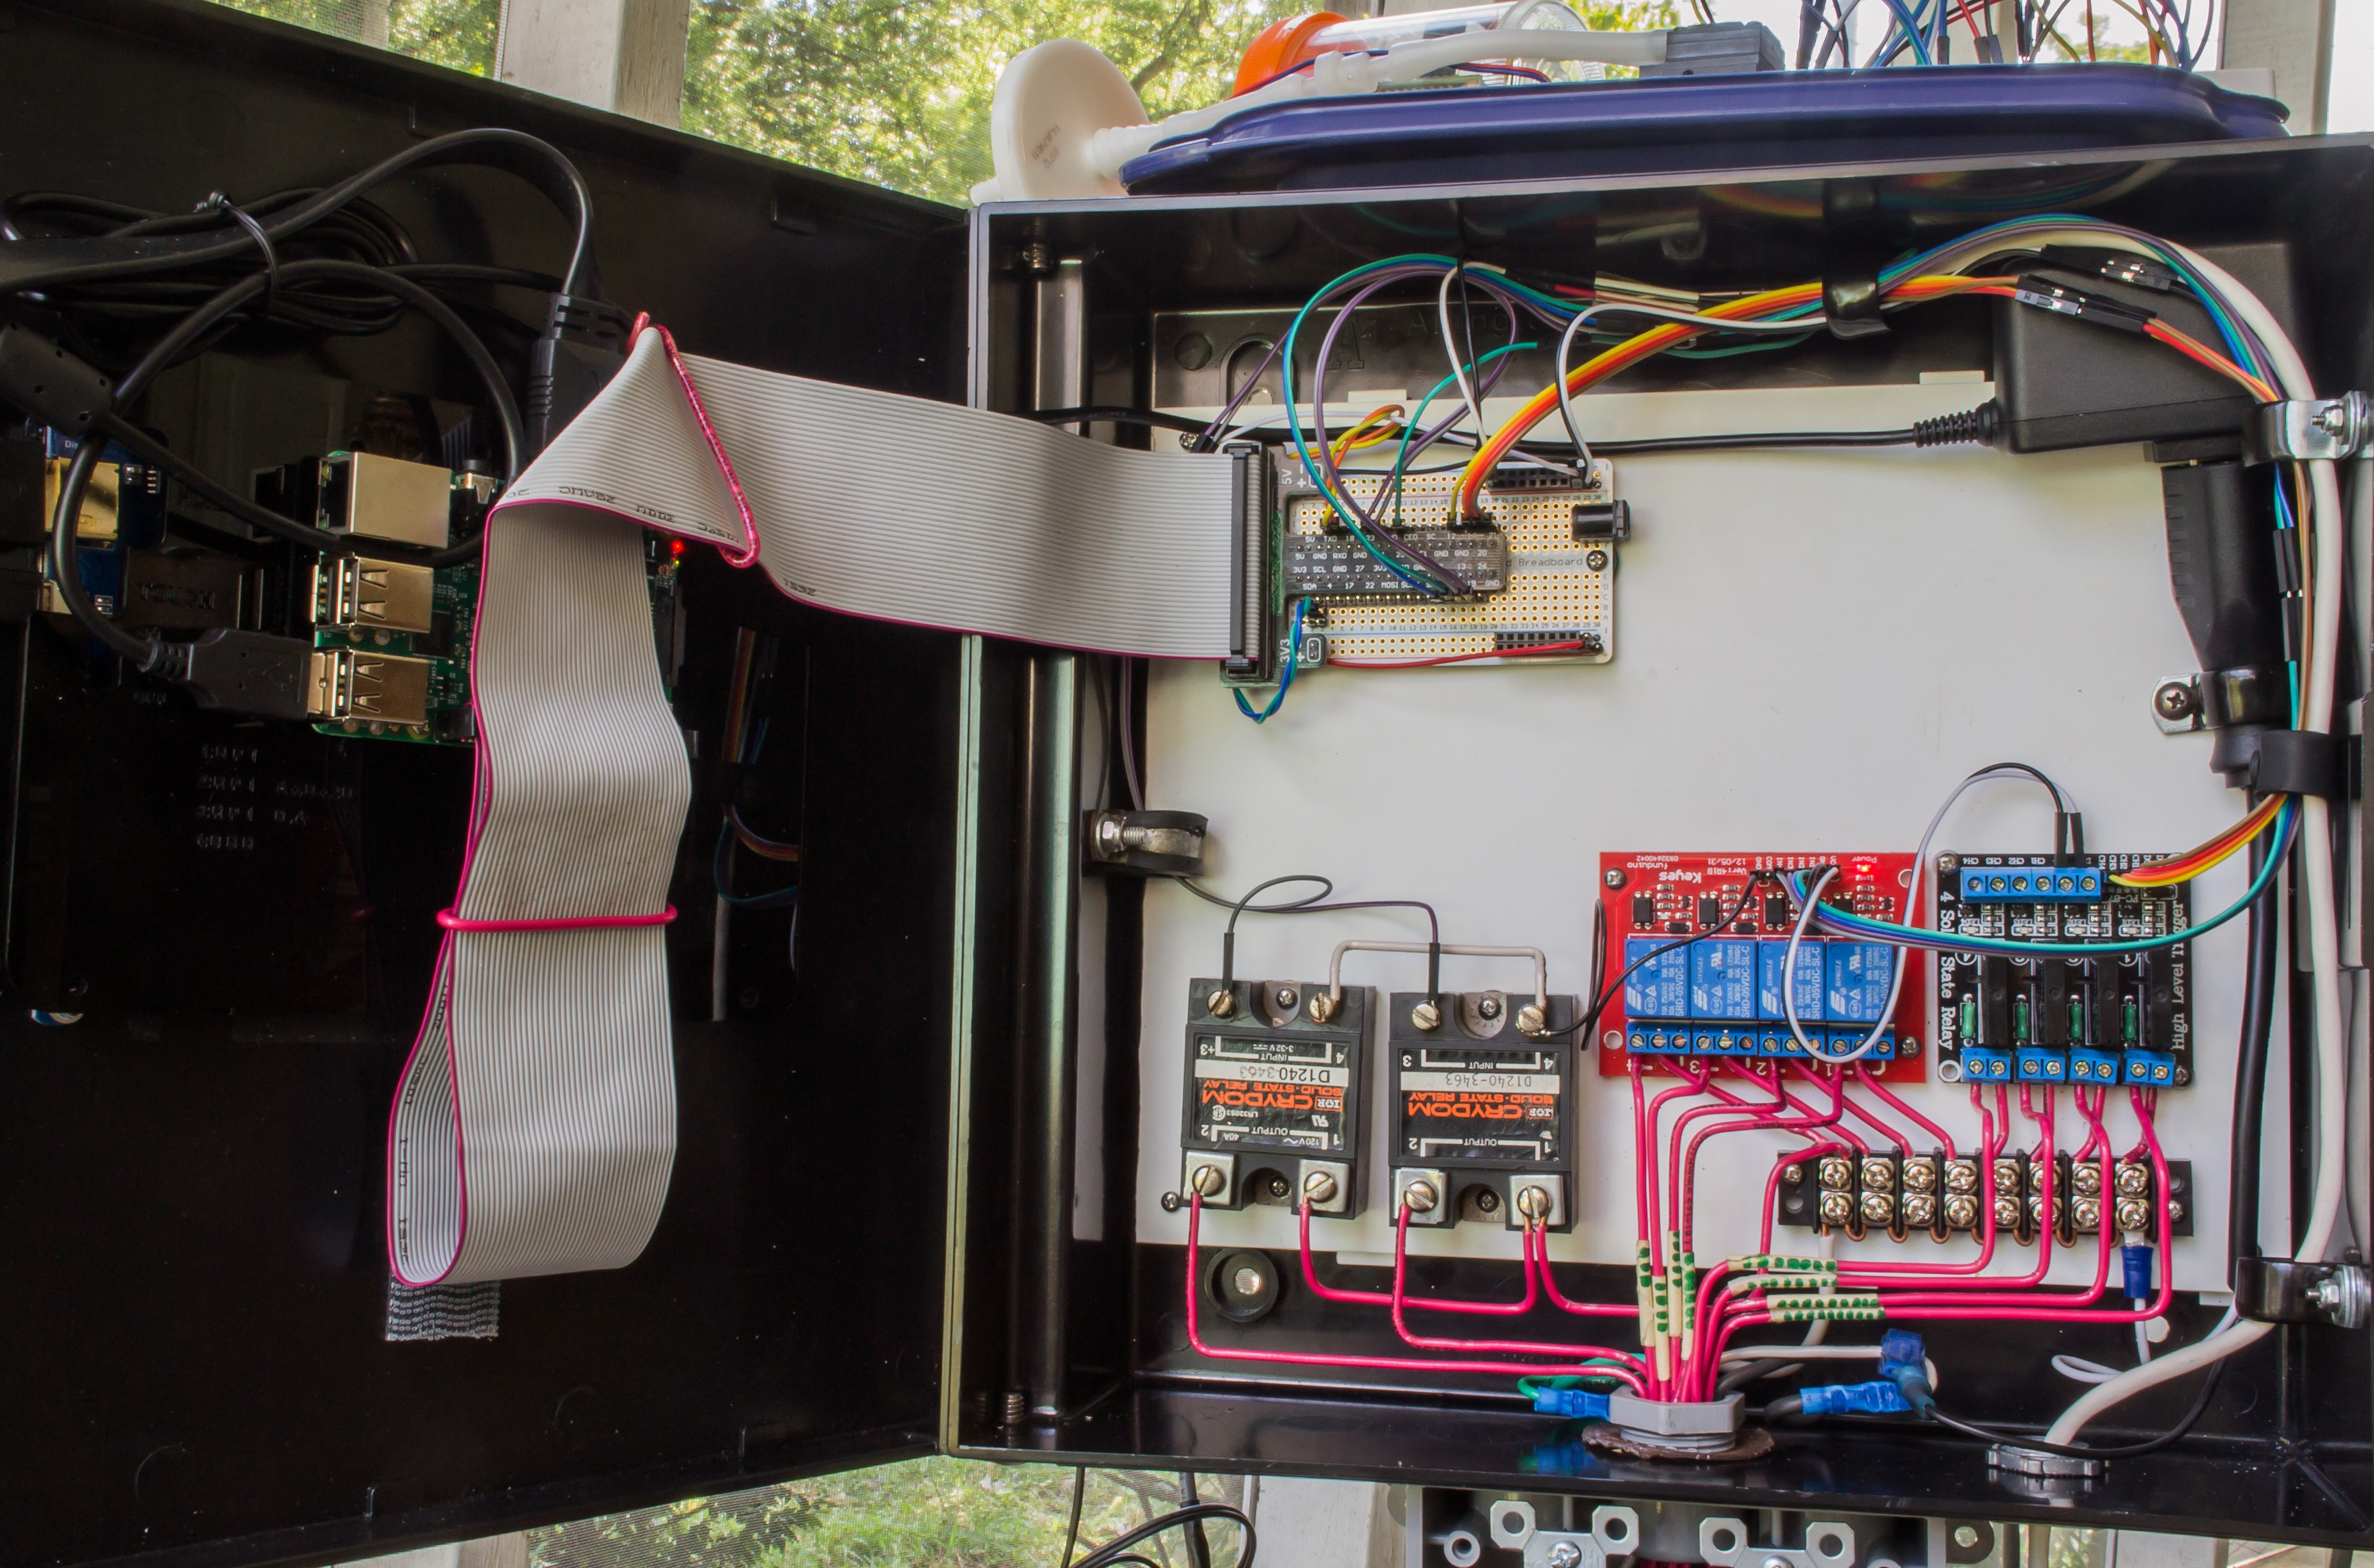
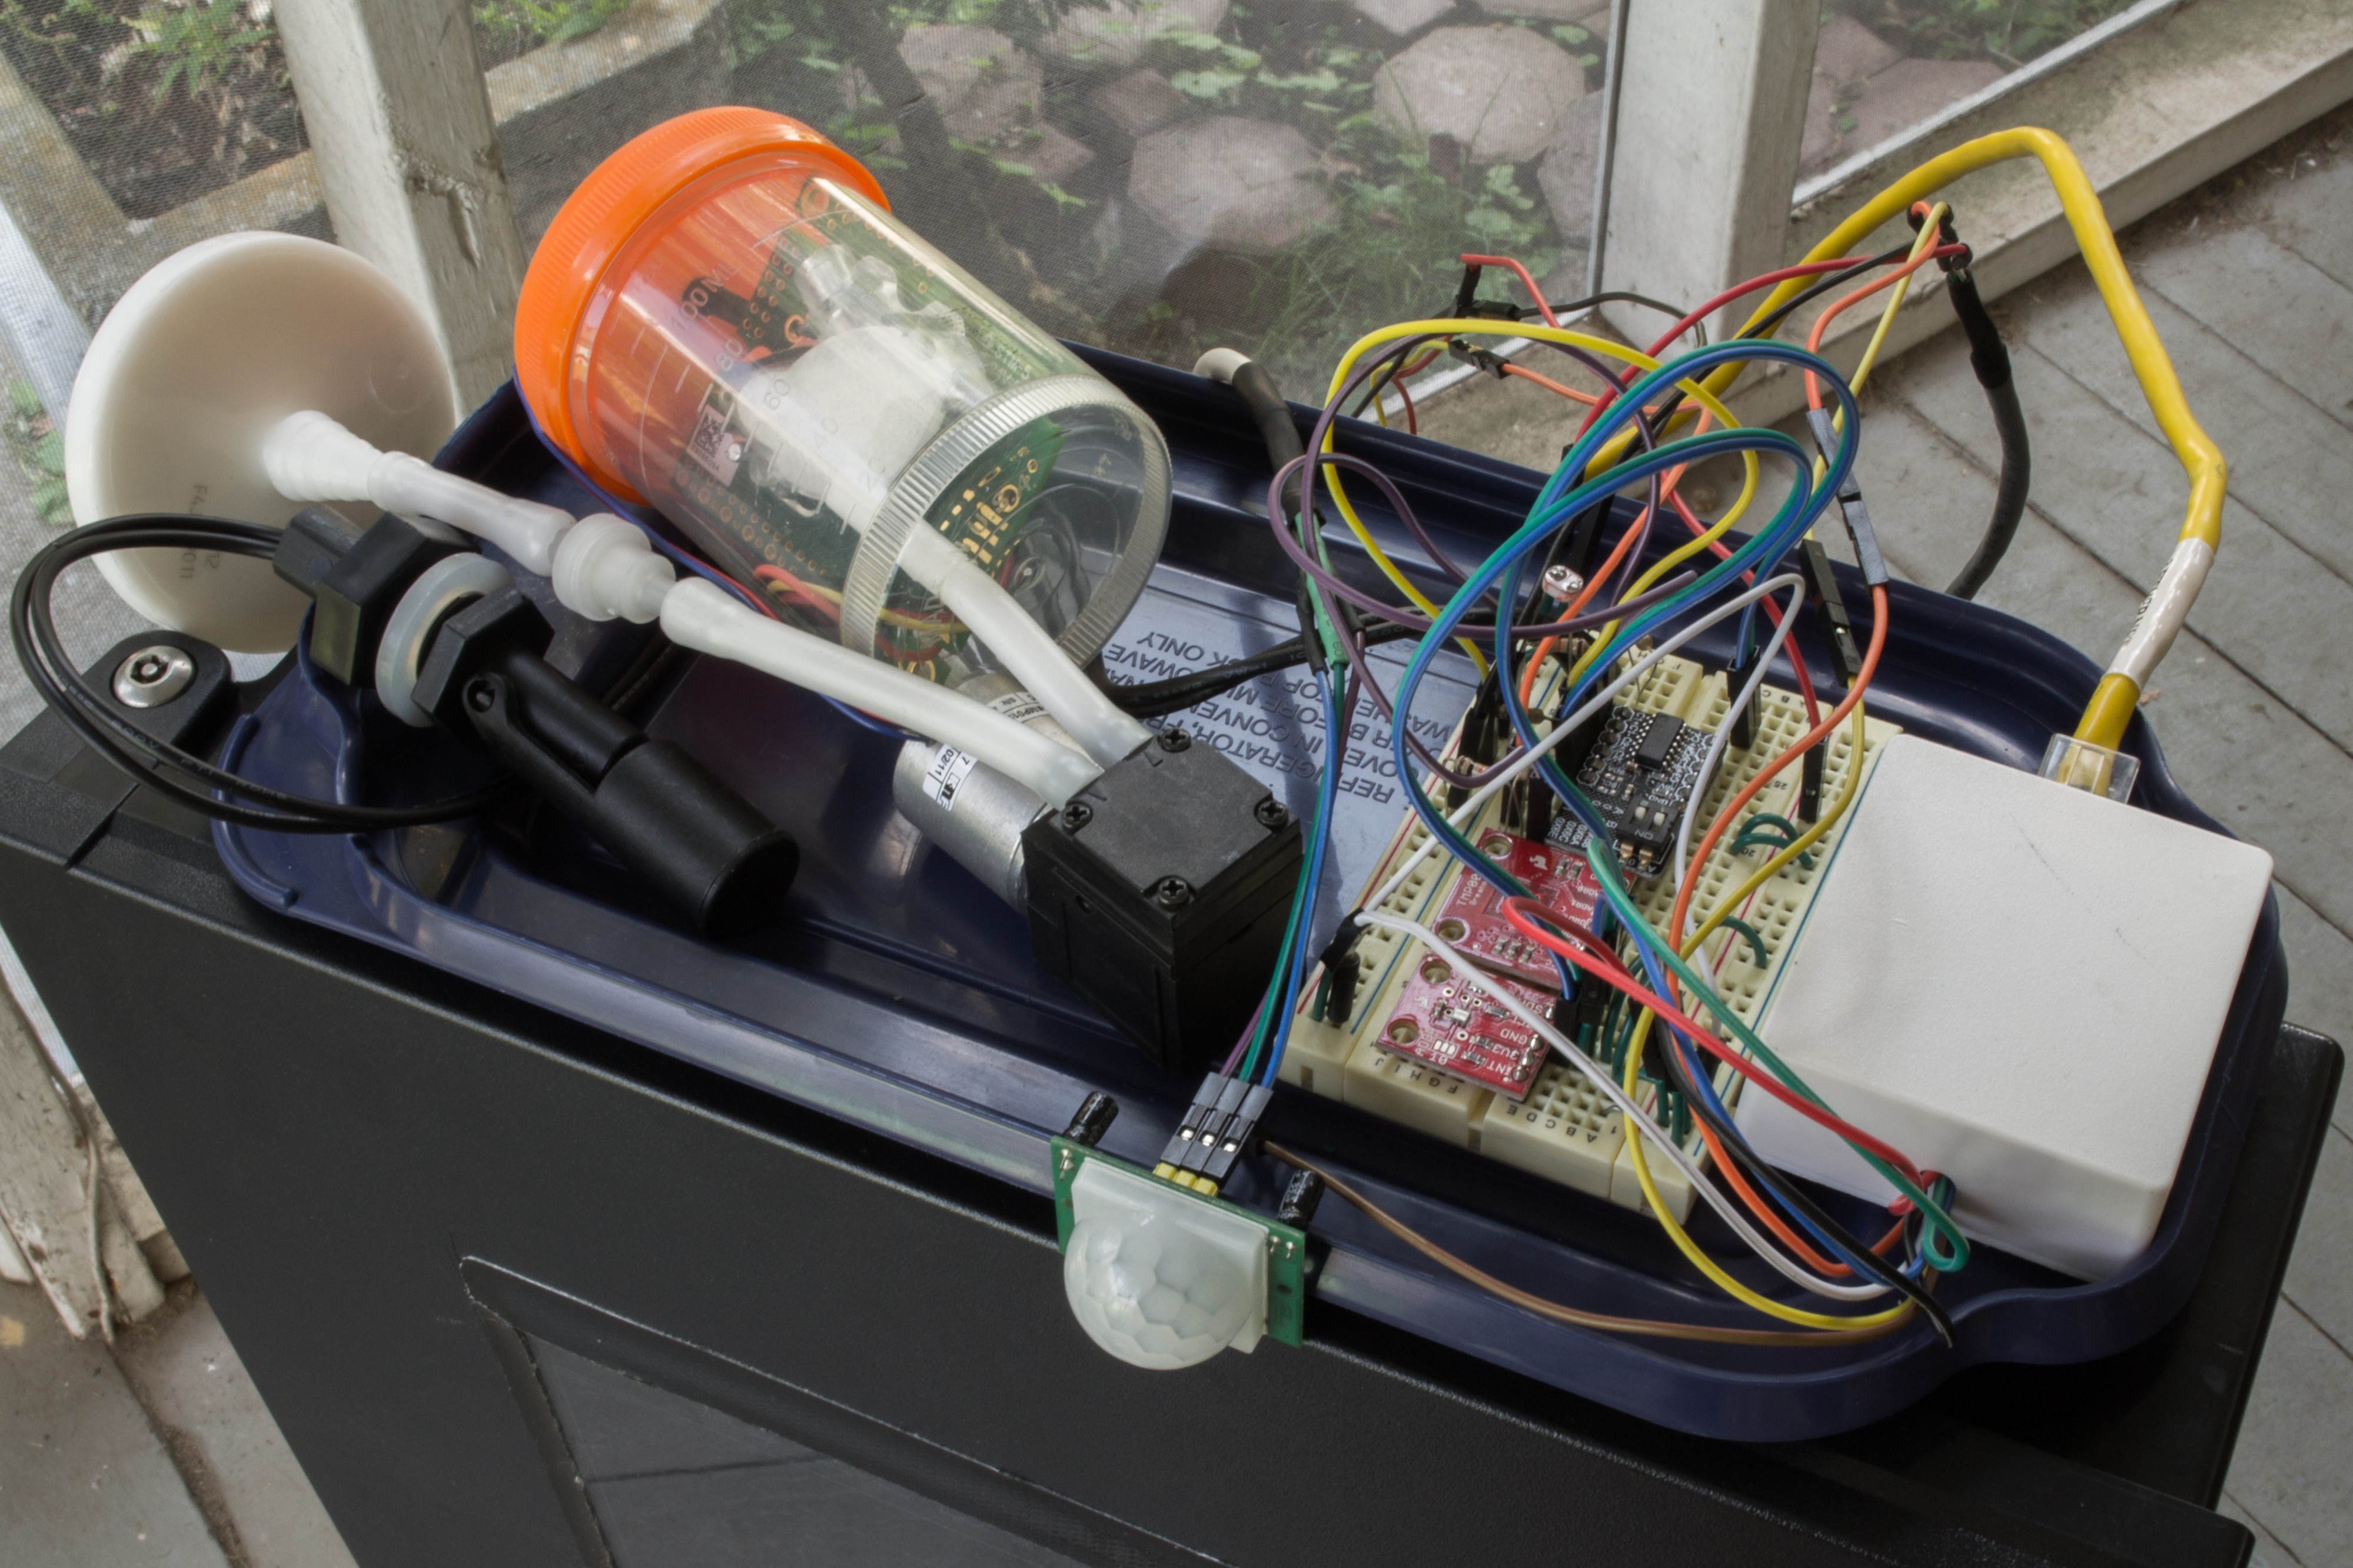
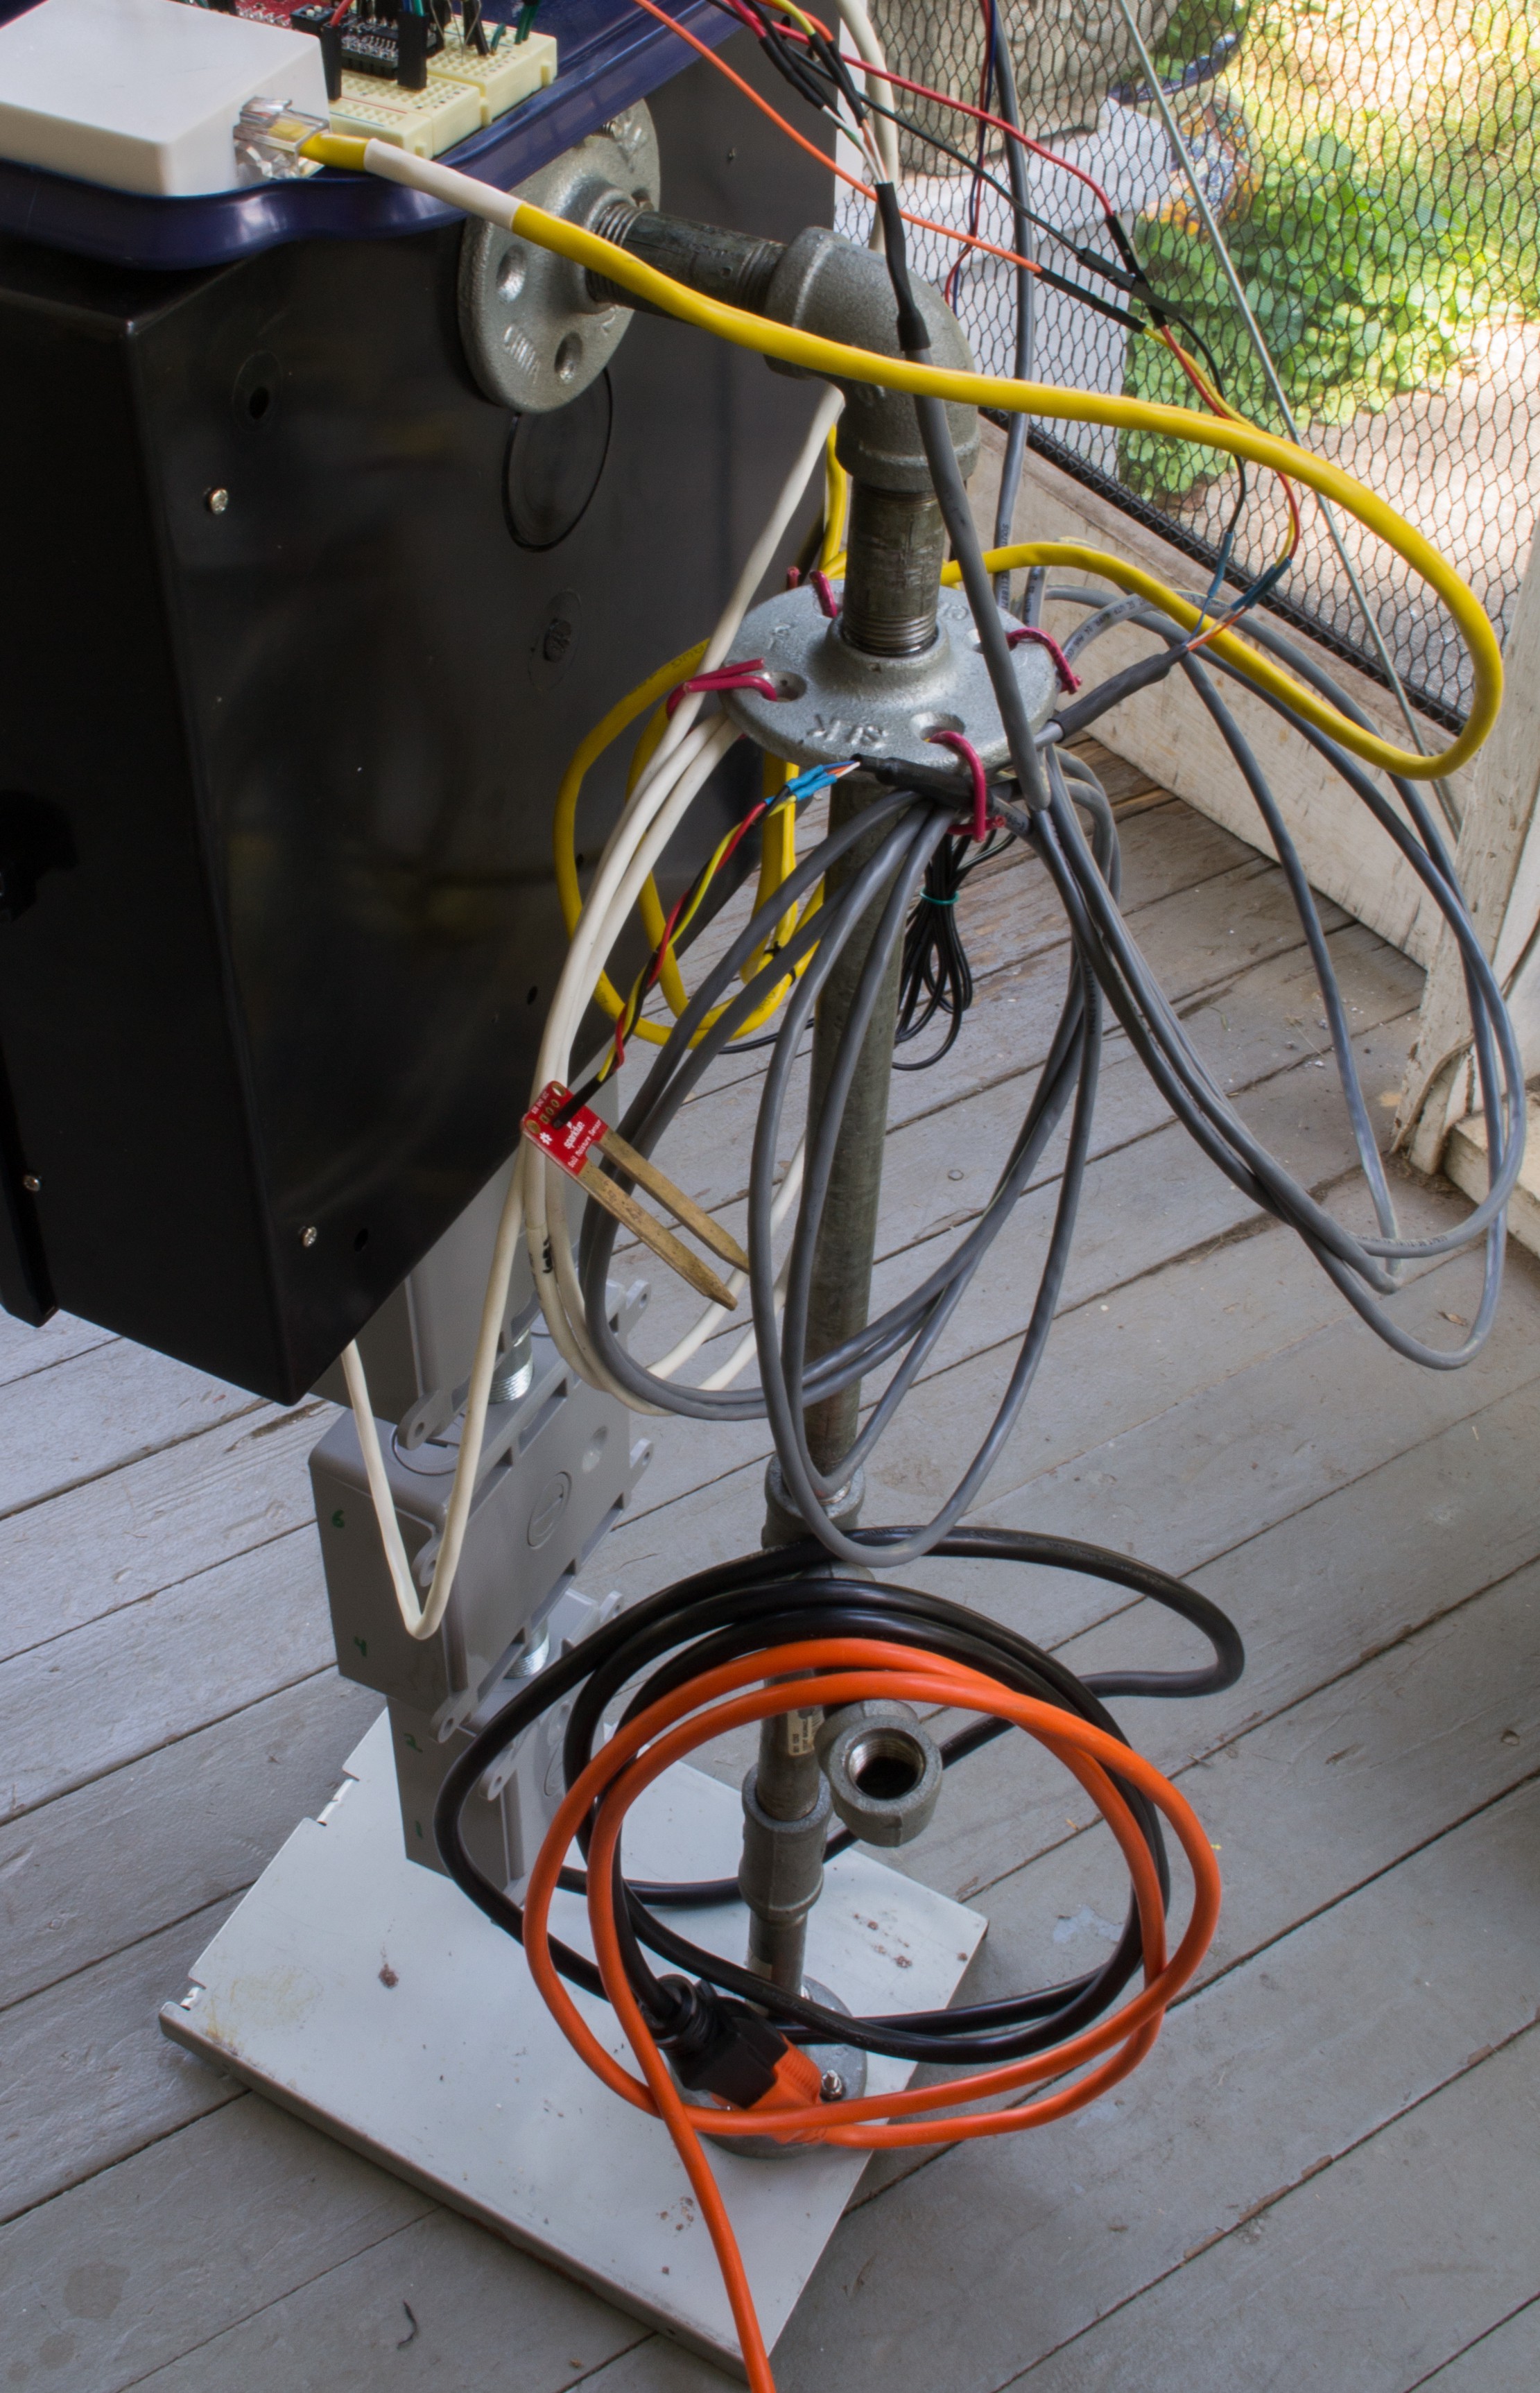
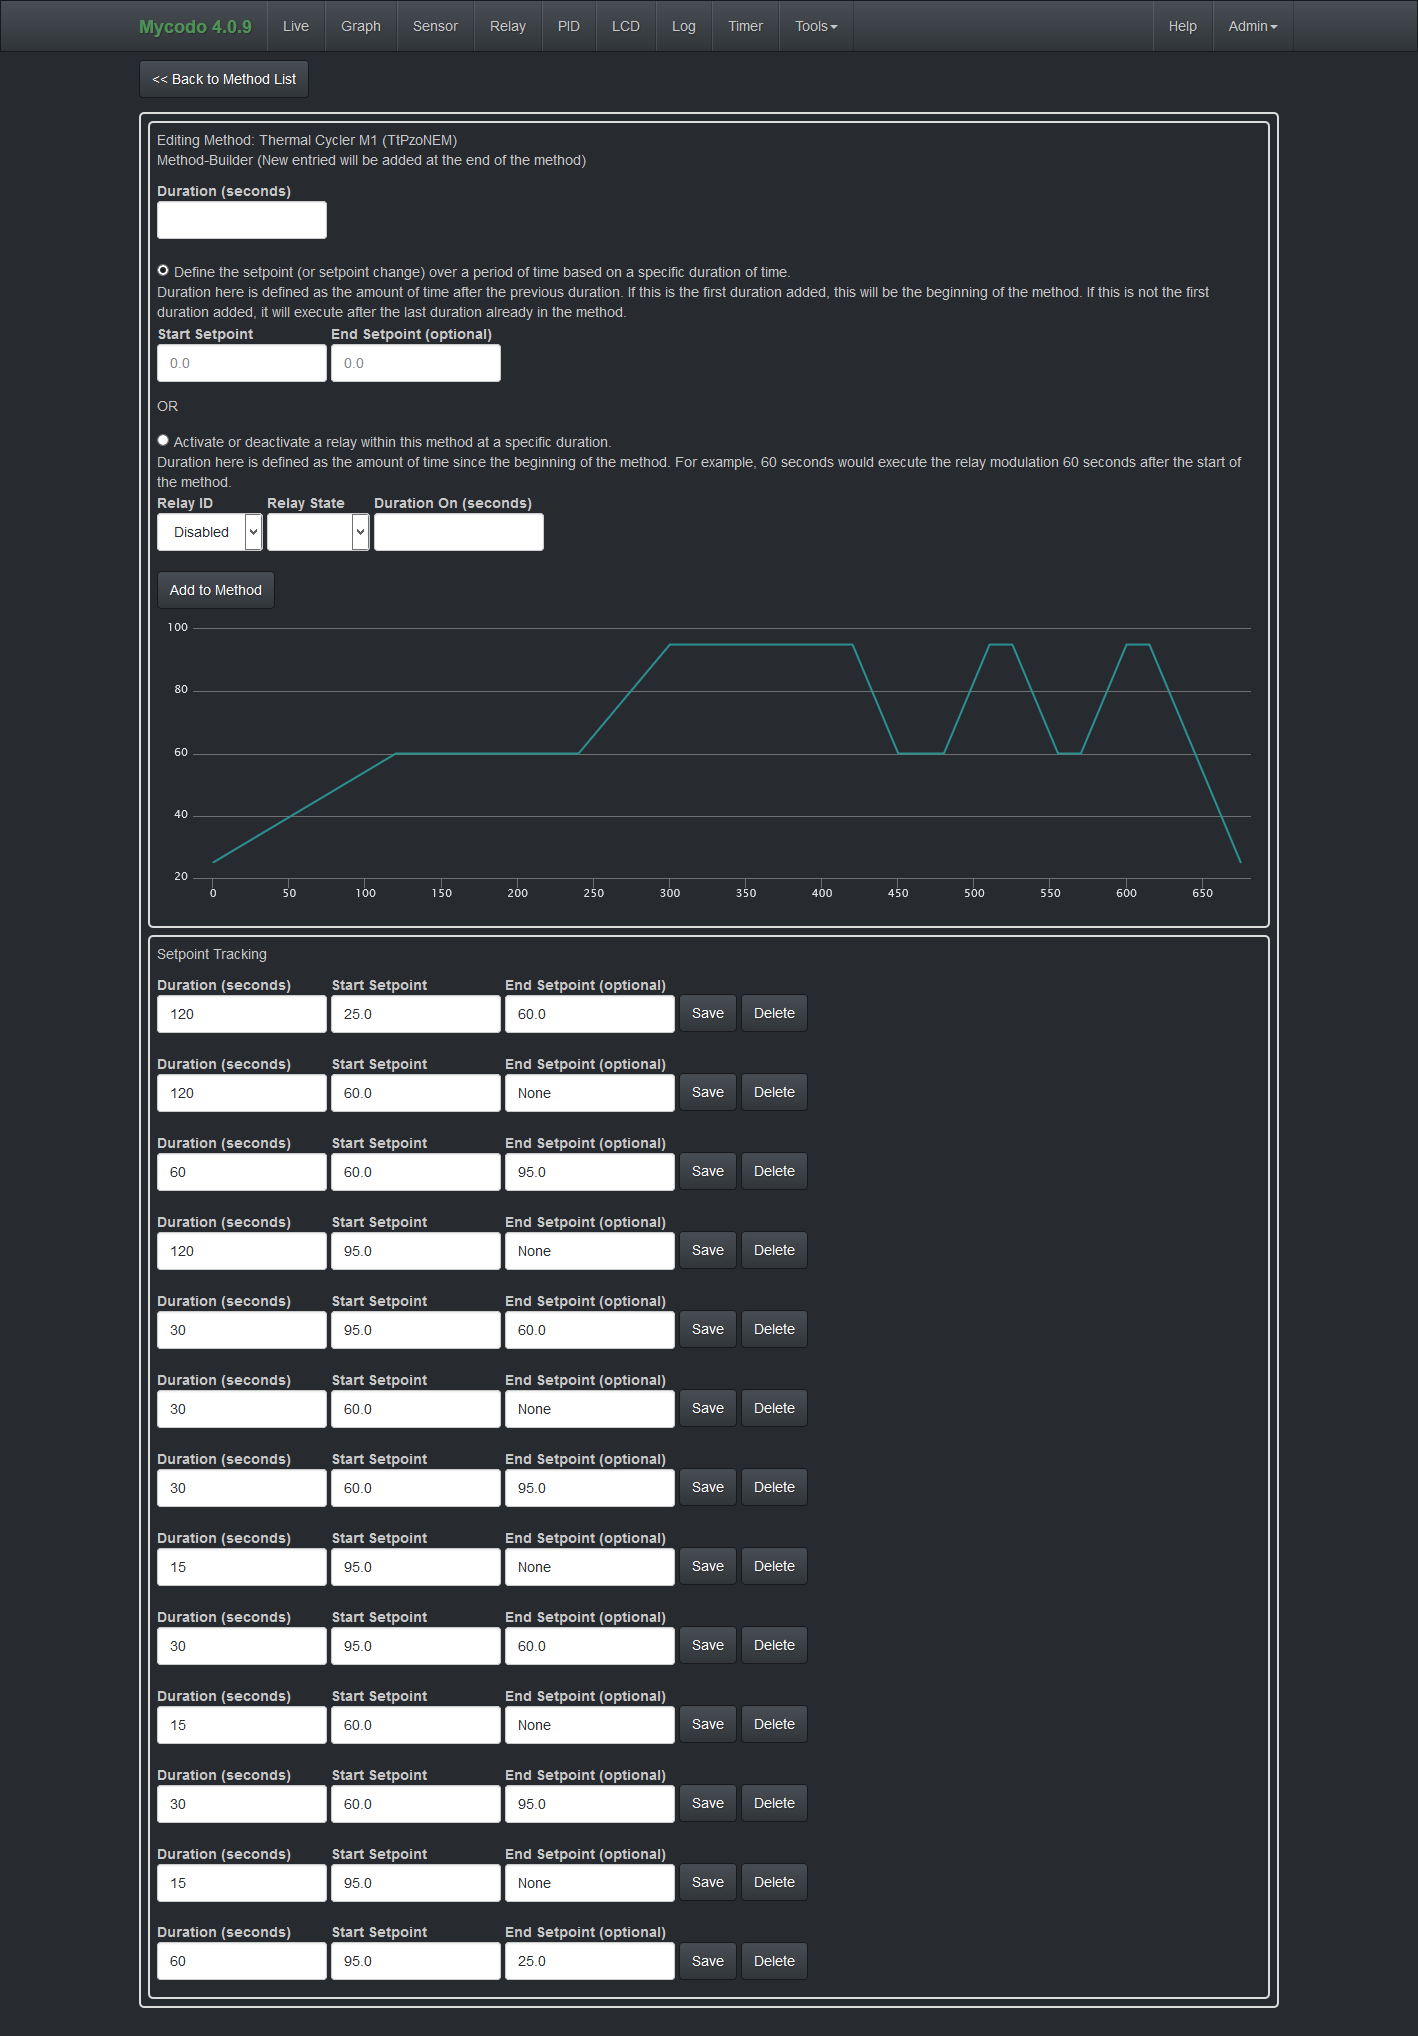
A project to regulate temperature and humidity to increase mushroom yield. Parts: Raspberry Pi 2, 2-amp power supply, and 8 individually-switched 120-volt AC outlets.
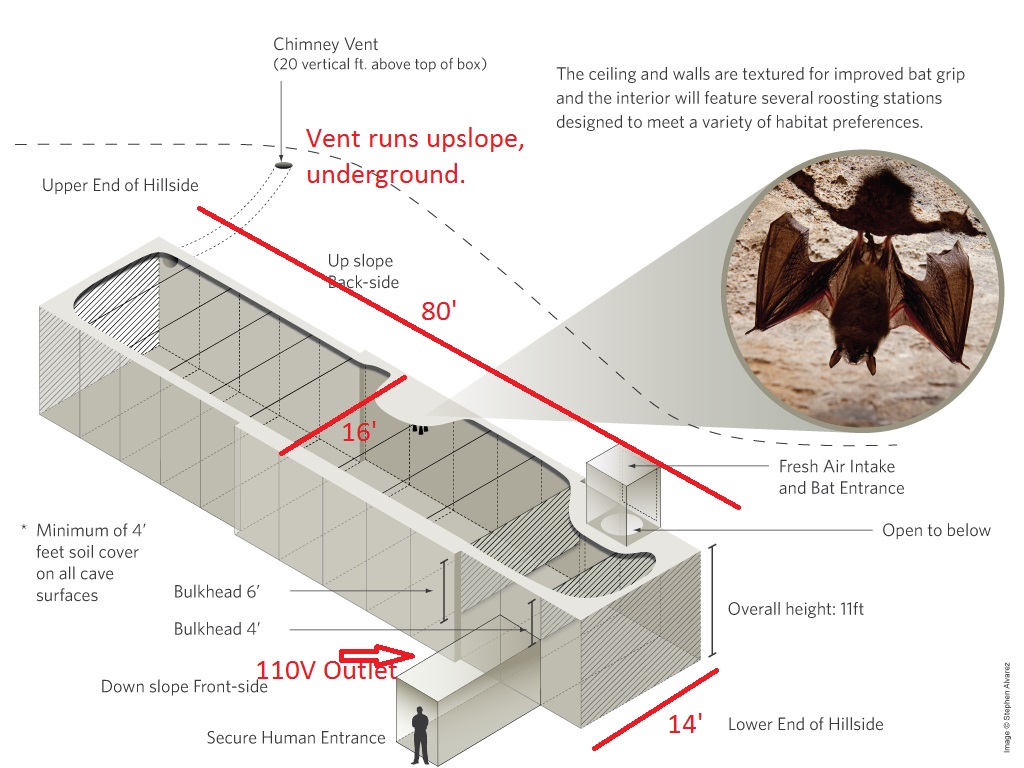

Artificial Bat Cave

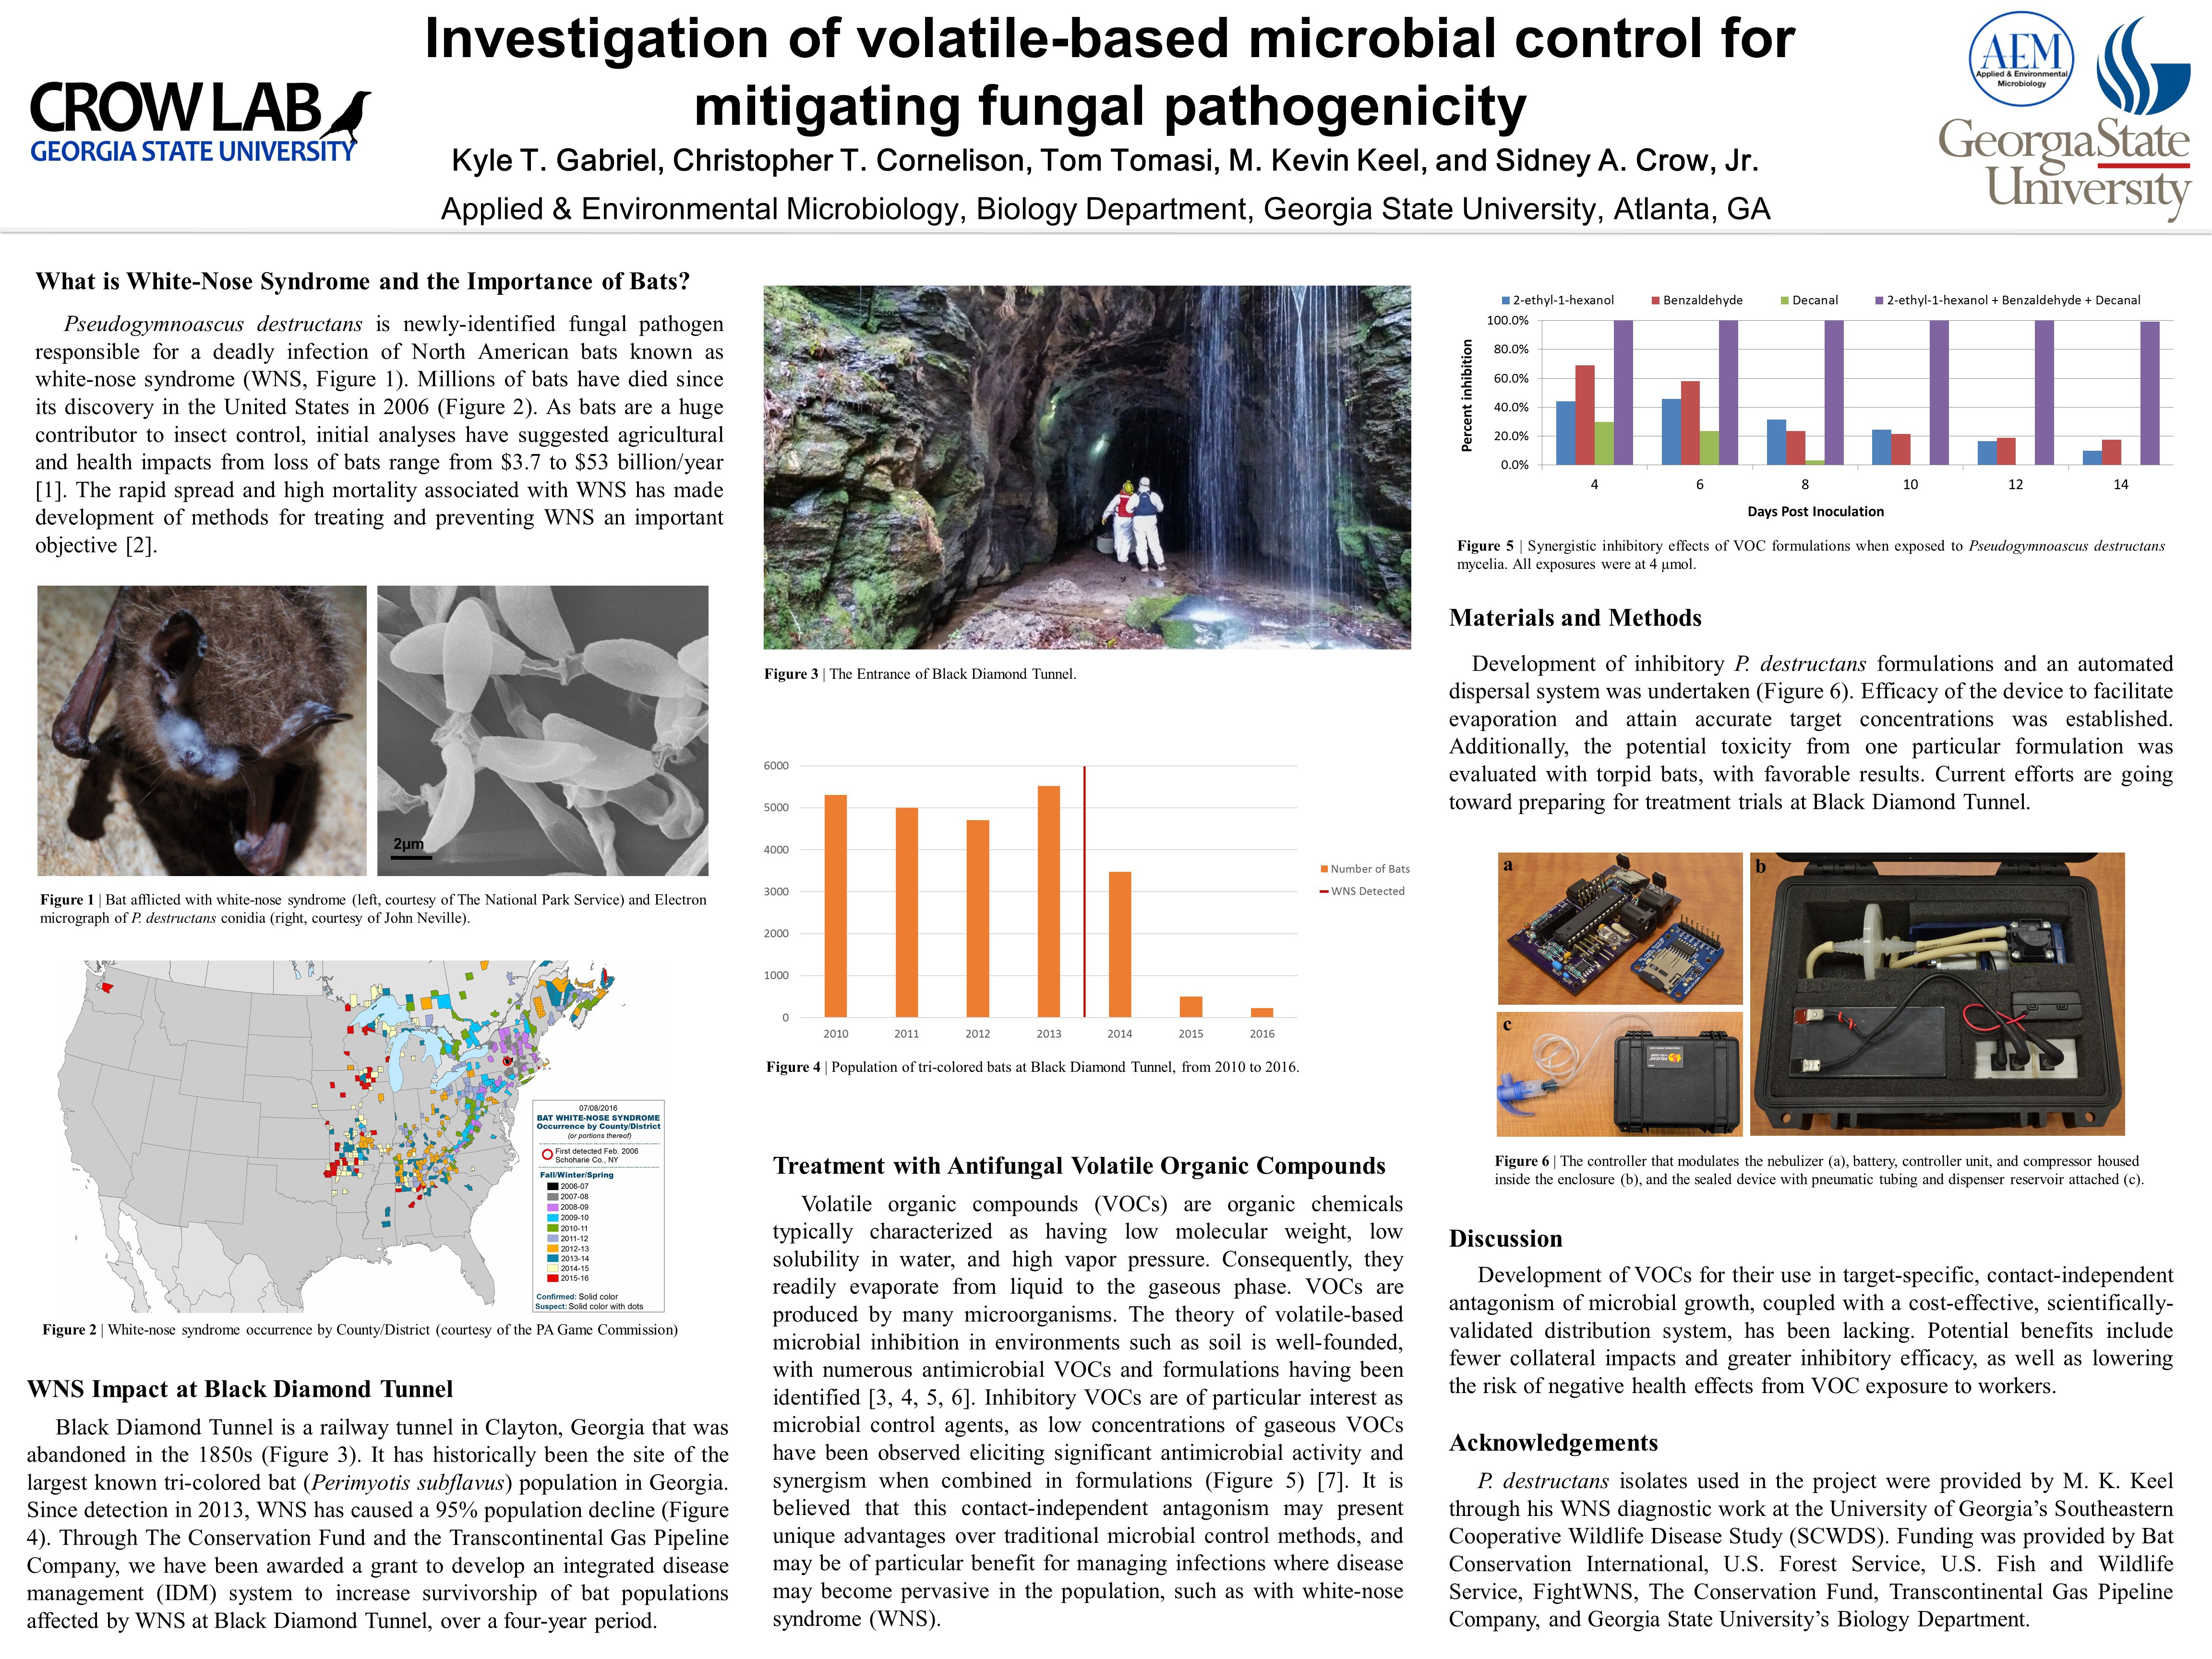
In collaboration with the Tennessee Chapter of The Nature Conservancy, a colleague and I installed a humidity regulation system in a 13,000 ft3 artificial cave, the first of its kind, for conducting scientific research with bat white-nose syndrome.


The BeeSL-2 (aka BSL-2)

A collaboration to build a humidity- and temperature-regulated apiary, mimicking a natural hive environment to conduct experiments on honey bees in a laboratory setting. This was set up to study fungal pathogenesis and treatment method development.


Features

  • Read and log a wide variety of analog and digital sensors (see below).
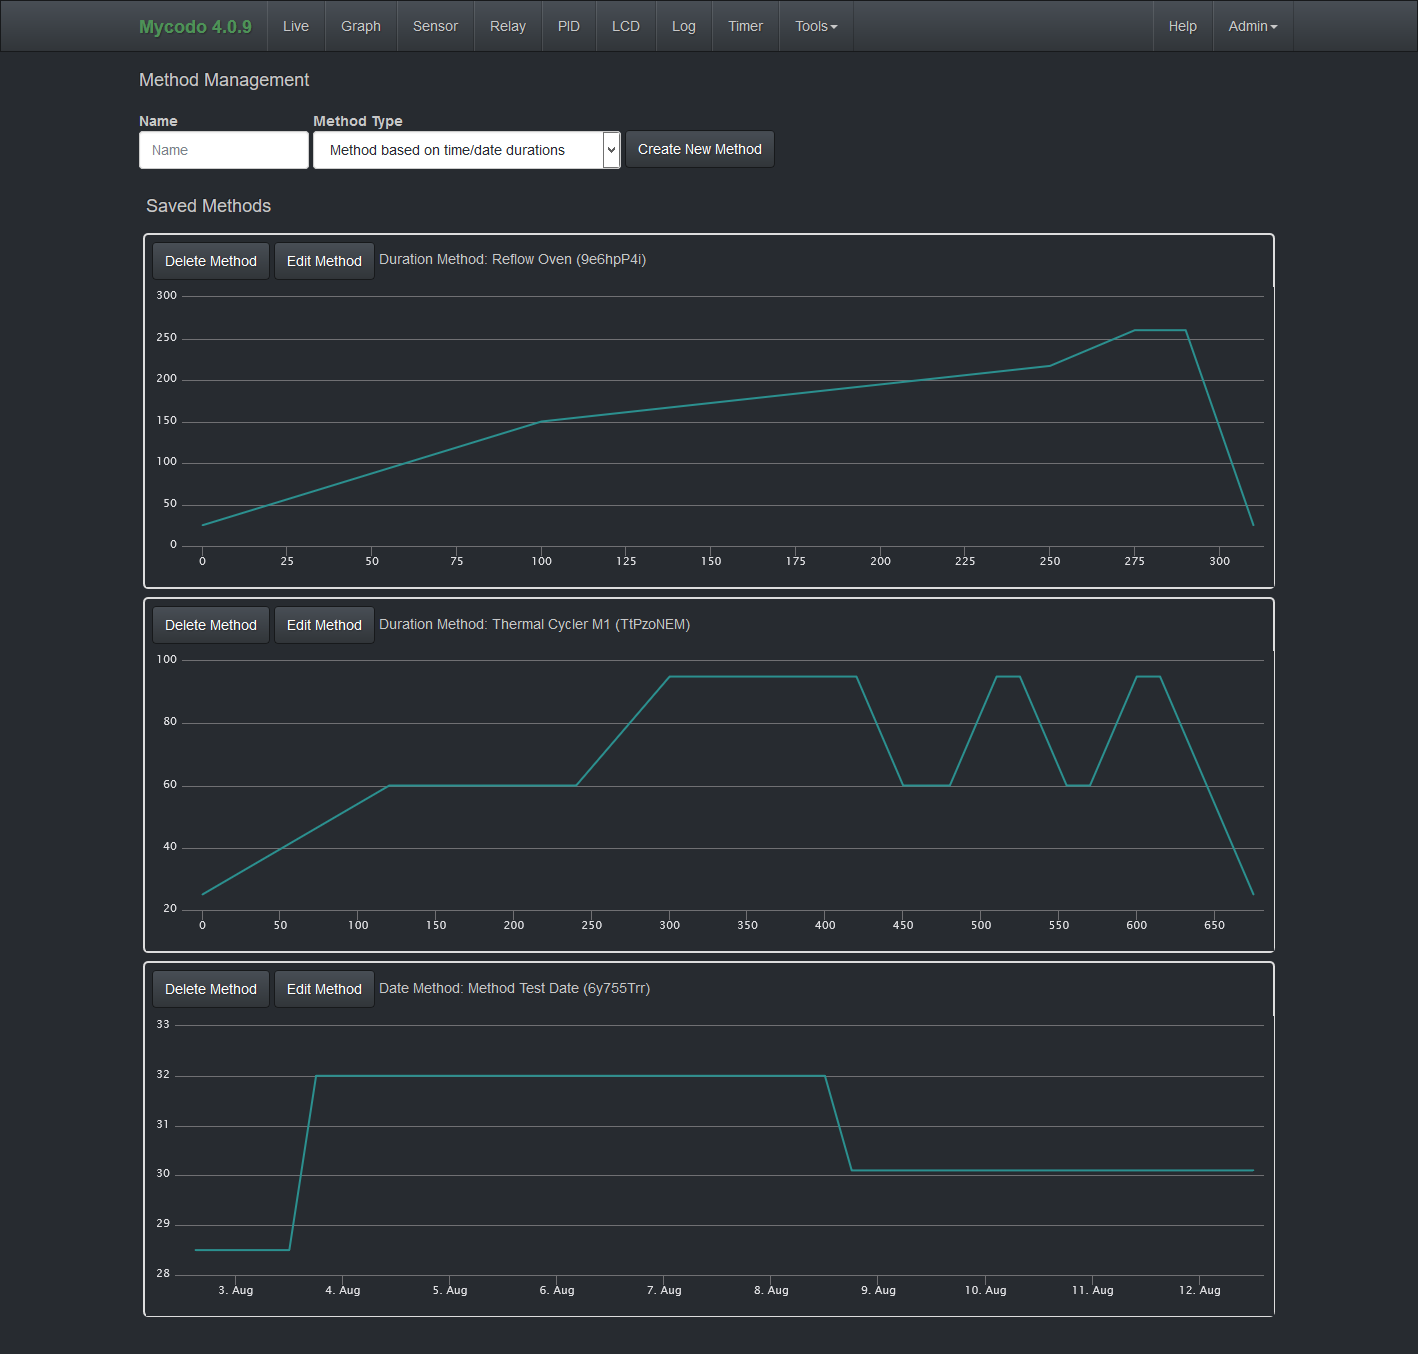
  • Web interface, accessible from anywhere, to visualize data, configure, and manipulate the system (with authentication, user levels, and SSL for the highest...
Read more »

Portable Network Graphics (PNG) - 392.75 kB - 09/12/2016 at 23:52

Preview
Download

  • 1 × Electrical box Metal or plastic, the size should fit your needs.
  • 1 × Raspberry Pi Single board computer.
  • 1 × 7-inch touchscreen LCD display Waveshare (1024x600 native resolution)
  • 10 × Power outlets Standard 120/240-volt (depending where you live) alternating current (AC) outlets.
  • 10 × Relays Verious brands. Input should accept 5 volts. Output should be rated for the devices desired to be powered (DC/AC, amount of amps).

View all 13 components

  • Guest on HackaDay TV's Show & Tell

    Kyle Gabriel10/23/2016 at 02:40 0 comments

    I recently appeared as a guest on HackaDay TV's Show & Tell with Sophi Kravitz of HackaDay and Limor “Ladayada” Fried of Adafruit, with a bunch of other talented guests who showed off their Raspberry Pi projects. Check out the hour segment below. I appear at 46:30.

  • Sprout Time-Lapse

    Kyle Gabriel10/22/2016 at 04:12 0 comments

    I wanted to share a time-lapse I created of the past two weeks that Mycodo has been caring for seedlings in Georgia while I've been traveling in California. After a week of germinating under the soil, this is their first two weeks above ground.


  • Video and RAMC

    Kyle Gabriel10/10/2016 at 01:16 0 comments

    I had planned a grand video demonstrating both the hardware and software of Mycodo, for the final round of the Hackaday Prize. However, my PhD dissertation (related to microbial control and wildlife disease management), traveling, and the conference I'm currently atrending in San Diego, California (Recent Advances in Microbial Control), has impacted my productivity more than expected.

    Edit: Video removed

  • Sous Vide PID Tuning and the Unexpected Electrical Fire

    Kyle Gabriel09/19/2016 at 00:00 0 comments

    Never underestimate the potential for the human element to cause catastrophic devastation, or at least cause you to find yourself with a flaming pool of molten metal burning through your tabletop.

    I had spent a good part of this weekend tuning a PID controller to heat an open pot of water to 50°C. This will be used for a cooking method known as sous vide, which translates to "under vacuum." This refers to the traditional vacuum bag that the food (which is commonly meat) is put into to increase heat transfer from the water to the food. It relies on using a temperature-controlled water bath to cook the food to a precise temperature. This method also makes it virtually impossible to overcook (which is easy to do on a stovetop or grill) and enables cooking a rare or medium-rare steak as easy as setting the temperature and letting Mycodo do the rest. Because the temperature is regulated, foods can be cooked for extended times, such as hours or days, to attain your desired tenderness. Some of the most delicious foods I've tasted have been made with sous vide, and I'm excited to be demonstrating the tuning I went through to get my sous vide system up and running.

    I had a submersible 120-volt AC heating element, my new Atlas Scientific PT-1000 temperature probe, and a hot water pump. I secured them all to a metal screen and began my long journey of tuning.

    To begin tuning a PID, you have to understand some PID theory. I've covered this in the Mycodo manual and other things I've written in the past, so hopefully this explanation can improve upon my previous works by illustrating what I'm talking about with actual data and graphs I obtained from tuning this PID over the past two days.

    First, lets discuss some terminology. PID stands for Proportional Integral Derivative. Each word describes a variable that contributes to processing an output value, called the manipulated variable (MV), from an input value, called the process variable (PV). All three P, I, and D variables are summed to produce the MV (P + I + D = MV). The duty of a PID controller is to affect the PV to move to a desired position, called the Setpoint (SP). The difference between the current position and the setpoint is the error (e).

    Using water heating as an example, the process variable will be the measurement from a temperature sensor submerged in the water, which at room temperature is 28°C. The manipulated variable will be the number of seconds a heating element submerged in the water will turn on for. Our setpoint will be 50°C, making our initial error = 50-28 = 22. Therefore, at a measurement period of 35 seconds (an output is created from the input every 35 seconds), the heater would be turned on for 22 seconds and off for 13 seconds. This can be referred to as the duty cycle, and in this case would be 22/35 = 62.8%. Over the period of time where this on/off cycle persists with these durations, the heater is energized 68.2% of the time. By increasing the duty cycle, more energy would be put into the system.

    The minimum options for Mycodo's PID controller are period (which determines how often a measurement is taken and the heater powered), a relay to power the heater, a sensor to obtain a measurement from, Kp, Ki, Kd, and a setpoint. Kp, Ki, and Kd are three main gains that determine how much each of the P, I, and D variables contribute to the MV. The expanded equation to produce the MV now looks like this: (Kp * P) + (Ki * I) + (Kd * D) = MV. Since P, I, and D are calculated by the controller (we're going to get into this shortly), the gains determine the degree to which each variable contributes to the final MV. So, if all gains are set to 0, the output will of course be 0, meaning the heating element will not turn on at all. And if the Kp is set to 0.1 it will produce a smaller MV than if Kp was set to 1.0.

    This makes it simple to use the gains to tune the controller and to enable or disable the contribution of each part of the MV calculation. If...

    Read more »

  • Software Updates: New Sensors and Methods

    Kyle Gabriel09/12/2016 at 15:29 0 comments

    While eagerly waiting all my components for my [secret mycodo] project to arrive in the mail, I took the opportunity to update the mycodo software. Here are the highlights for each minor version update since the last software update log that covered the new Method feature:

    v4.0.18: Add sensor: Atlas Scientific PT-1000 I2C temperature sensor.
    v4.0.17: Add new method type: Setpoint tracking of a sinusoidal wave that repeats daily.
    v4.0.16: Add option to force browser to use SSL/HTTPS.
    v4.0.15: Add sensor: HTU21D I2C temperature and humidity sensor.
    v4.0.14: Add new method type: Setpoint tracking that repeats daily.
    v4.0.13: Modify time-lapse method so it can resume if there is a power failure or reboot.
    v4.0.12: Add ability to select I2C bus for all I2C devices, for TCA9545A I2C Bus Multiplexer.
    v4.0.11: Add Pi camera streaming and time-lapse functionality; fix still image capture.

    With the addition of two new method types to track a setpoint over the day and repeat each day, there are a lot of new possible uses for mycodo. These two types allow the user to exactly define what the regulation setpoint should be at any point of the day. For instance, if you want to raise the temperature mid-day and lower it at night every day, this is now possible. The new sine wave daily repeating method allows the user to define a sine wave based on amplitude, frequency, angle shift, and y-axis shift, to enable smooth setpoint tracking, so you can do things such as create a setpoint change across the day to mimic the swing you commonly see with temperature or humidity.

    For new sensors, we have the HTU21D temperature and humidity sensor and the Atlas Scientific PT-1000 industrial temperature sensor. The HTU21D is an affordable (breakout boards are $4 on ebay) I2C temperature sensor. It lacks the filter membrane of its sister chip, the HTU21D-F, but this is something you can create yourself and save $15. Next, the Atlas Scientific PT-1000 is a high-range industrial temperature probe and I2C-enabled (also UART) circuit board to process the signal. Encased in a waterproof cable and with the removable thermowell, temperatures can be measured indefinitely from a submerged environment, from -200°C to 850°C.

  • Full Electrical Connectivity

    Kyle Gabriel09/05/2016 at 19:53 0 comments

    It was time for all the components to finally come together and to fully power the system. Power was fed through the bottom and passed through all outlet boxes.

    It's pretty tight at the very top, where all the wires must pass.

    In the electrical box, power was distributed through a terminal block with all the terminals linked. Each of the 10 relays were connected to each outlet and are now individually controllable with the Raspberry Pi. All boards and relays in the box were fixed to a white piece of plastic from a broken flatbed scanner and cut down to size. The metal ring securing the electrical outlet array is a sprocket lock washer that outlived its safe use on a motorcycle of mine.

    Communication to the Raspberry Pi was accomplished with a breadboard-style perfboard and an IDE cable breakout, soldered together. The power rails were just a bit too wide for the perfboard but after some coaxing, everything aligned nicely. This perfboard has the same latitudinal and longitudinal connections as a breadboard, making expanding connected devices a bit easier.

    Top left: Raspberry Pi IDE/perfboard

    Bottom left to right: 2 Crydom D1240 solid state relays (40 amps each), 4 mechanical relays (10 amps each), and 4 solid state relays (2 amps each).

    Everything wired and powered up. The wall wart powers the Raspberry Pi and the LCD touch screen. Sensors either connect through the ethernet port on the left side of the box (behind the IDE cable), or from the opening in the bottom-right, The ethernet connection currently carries ground, 3.3v, 5v, I2C lines (data and clock), and Tx/Rx (for CO2 sensor). The 8th wire is currently unused.

    Even thought the ethernet connection permits a long distance between the head unit and sensor array, I currently have most of the sensors sitting in a tray on the top of the box while I prepare to set the system up for live use.


    The pipe fittings that make up the temporary stand actually provide a nice amount of holds for organizing wires. Black is power, white is the motion sensor, yellow is I2C and Tx/Rx, and grey is the CO2 sensor.

    That's all for this weekend. Perhaps the next update will have Mycodo growing or cooking something.

    I'd like to thank everyone who has supported this project. Mycodo was recently selected from the Automation round of the Hackaday Prize to be 1 of 100 great projects judged in the final round.

  • Moisture Sensor Calibration and Tuning #2

    Kyle Gabriel08/16/2016 at 18:05 0 comments

    It's now been 18 days since I started the soil moisture measurement experiment. This was a test I began 18 days ago, when I saturated the soil that had a soil moisture probe submerged into it, for measuring conductivity. To be able to accurately determine how moist the soil is, measurements at both total saturation and total dryness must be known. In this case, voltage is the measured value, and this will be converted to a percentage scale. The raw data is below.

    It appears that temperature and soil conductivity are correlated, so I've included the temperature data to explain the bumps in the soil probe voltage.

    The volume of this pot is roughly 1 liter. The soil is very degraded (dense) with a lot of clay (fine particles), which could explain the high conductivity for the majority of the test. The plant that's in the pot is also a slow-growing succulent (cactus), and does not require a great amount of water. These things combined make it difficult to determine the voltage at which it would be most appropriate to water. Other plants and soil makeups will invariably need the system to be calibrated again.

    I have been meaning to purchase a grow light and tent to conduct actual grow studies, but due to my motorcycle being stolen recently, and having to deal with insurance and transportation issues, I've had to put that off until I am more financially stable.

    In the mean time, I can theorize about optimal soil moisture and methods for improving this system. One improvement that may be beneficial would be to remove a small core sample of the dense clay soil and fill that with more loosely-packed soil, which the soil moisture probe could be placed. This allows the plant to retain the soil surrounding its roots, but enable the moisture probe to potentially react more quickly to moisture changes. The loosely-packed soil surrounding the probe would still be affected by the surrounding soil's moisture ,yet because of the lower conductivity, could react quicker and yield a more discernible voltage difference earlier in the test.

    Having two soil moisture probes to measure at the same time would be ideal for this type of test, however with the assumption this data curve is reproducible throughout this soil, one probe will suffice.

    I hope to bring more tests, Mycodo features, and a working automated plant monitoring and grow setup in the near future.

  • New Feature: Method Development

    Kyle Gabriel08/02/2016 at 18:22 0 comments

    Today's log will be short. I just wanted to share a new feature being developed. Using a PID to regulate an environment is nice, but what if you want more than a simple static regulation? What if you want that regulation to change at different time points? This has major utility if you want to build things like reflow ovens (soldering SMD parts), thermal cyclers (replicate DNA), and systems for food production (cultivating, fermenting, aging, etc.), to name a few.

    Afew months ago I implemented a feature, known as setpoint tracking, that allowed a daily schedule to be built (to a resolution of 1 minute). This enabled the setpoint (where the environmental condition would be regulated at, for instance temperature) to change throughout the day. However, this was limiting if you wanted to build a method that would change the setpoint farther into the future (such as over a weeks, months, or even years), or if you required a resolution of less than a minute.

    This new method builder feature is a major expansion to the initial daily schedule builder, and enables method creation without any duration limitation. The next feature will be the ability to enable repetition, if you want to have a method that repeats at a defined interval.

  • Moisture Sensor Calibration and Tuning #1

    Kyle Gabriel07/30/2016 at 01:31 0 comments

    Before beginning to talk about today's topic, I wanted to briefly say the SIMB conference I just returned from was a huge success. I was able to listen to a lot of great talks and share ideas with many great scientific minds. I also won the Carol D. Litchfield Poster Presentation Award in the Environmental Microbiology category, and wanted to share that poster, which briefly covers my graduate research.


    Having just returned home, I decided to relax and do some light data analysis of the sensor data I collected while out of town, and discuss the process I went through to calibrate the analog to digital converter (ADC) for the soil moisture sensor placed in a potted plant.

    Since different soils will vary in electrical conductivity due to variance in substrate composition, it's necessary to calibrate the ADC and probe to a particular soil in order be able to more accurately measure the moisture. The first step is to ensure the maximum voltage being returned from the moisture probe doesn't exceed the maximum detectable voltage of the ADC. The particular probe I'm using, the SparkFun soil moisture sensor, returns a voltage between 0 and the input voltage, depending on the conductance of the soil. The more wet the soil becomes, the higher the conductivity, and the closer the sensor output voltage will be to the input voltage.

    I have two voltages I can easily use from the Raspberry Pi as input to the sensor- 5 or 3.3 volts. The MCP3424 ADC I'm using has a maximum detectable voltage of 2.048 volts, and requires the use of a voltage divider (Figure 1) to reduce the measured voltage below 2.048 volts.

    Figure 1 | Voltage divider with resistors Z1 and Z2 (courtesy of Wikimedia).


    The voltage ratio for this voltage divider is:


    Rearranging to solve for Vout yields:


    Two 10 kOhm resistors were chosen, which reduced Vout to 1/2 of Vin. This voltage divider would reduce 5 volts to 2.5 volts, or 3.3 volts to 1.65 volts. Our only option to yield an output voltage within our target range (with this particular resistor combination) is the 3.3-volt input.

    The next step was to submerge the sensor in the soil and measure the voltage when the soil is both dry and wet to determine the significant detection range. The measured voltage will be converted to a configurable condition, which in this case was the "moisture" of the soil (to which the %-sign was the unit). Therefore, 0% soil moisture would be equated to the voltage returned when the soil is dry, and 100% soil moisture to the voltage returned when the soil is saturated with water.

    I planned to use the SIMB conference as an opportunity to collect a week's worth of data in order to have enough to effectively calibrate. I set the recordable voltage range to the maximum the ADC could measure, from 0 to 2.048 volts, thus ensuring the measurable voltage would fall within the detection limit of the ADC. Since the soil of plant I was testing had an unknown initial moisture content, I decided to begin my measurements after watering the plant then measure for several days as the soil dried from the water being taken in by the plant and evaporation.

    Over the next week, the soil changed from saturated to dry. The recorded voltage started at 1.27 volts and ended at 1.16 volts. It wasn't necessary to allow the soil to become completely dry, as this would be unhealthy for the plant (and most likely impossible due to the high humidity). Rather, it only had to dry to the degree that would be useful for triggering a watering system. Several days without watering was more than enough to accomplish. In fact, it probably became dryer than I would normally have allowed it to become. Using this data, the ADC and soil moisture sensor combination was calibrated to convert 1.15 to 1.3 volts to a scale of 0 - 100% moisture. I collected a few hours of data, completely saturated the soil again, and recorded a few more hours of data (Figure 2).

    Figure 2 | The first few hours of voltage and moisture data recorded after setting...

    Read more »

  • Guest Access to Server

    Kyle Gabriel07/23/2016 at 16:32 0 comments

    Next week I'll be at the annual Society of Microbiology and Biotechnology conference in New Orleans, While learning about science and industry and presenting my graduate research (unrelated to Mycodo), I wanted to give the public guest access to one of my Mycodo development systems. I spent yesterday tightening security for guest users on the system. If you happen to find a bug or security lapse, please contact me at http://kylegabriel.com/contact/ or create an issue at https://github.com/kizniche/Mycodo/issues.

    Server: https://fungi.kylegabriel.com
    User: mycodo
    Pass: guestpass

    Enjoy!

View all 12 project logs

  • 1
    Step 1

    Installation

    Download and burn the free image of the Raspbian Operating System to a micro-SD card. Insert the card into the Raspberry Pi, connect an ethernet cable from your router to the Pi, then power it up. Log in to your router and view the DHCP table of connected devices to determine what the IP address of the Pi is (the hostname will be "raspberrypi"). Use an ssh client to connect to the IP address of your Pi, using the user name "pi" and the password "raspberry".

    Once Raspbian is running and you've successfully logged in, you're ready to install Mycodo. Go to https://github.com/kizniche/Mycodo to get the latest instructions of how to Install and log into Mycodo.

  • 2
    Step 2

    Sensors

    Out of the box, Mycodo can begin logging the temperature of the Raspberry Pi's CPU with its internal sensor, as well as the CPU processing load. These can be added from the Sensor tab.

    If you have supported sensors, connect them to the appropriate communication pins (UART, I2C, GPIO, etc.). The most current list of supported sensors and setup documentation can be found at https://github.com/kizniche/Mycodo#supported-devices-and-sensors

  • 3
    Step 3

    Relays

    Connect one or more relays to the GPIO pins of the Raspberry Pi, then add and configure them from the Relay tab.

    The required current and voltage capacity of your relay will be best determined by the device you desire to control. For instance, if using a device that plugs into a standard US 120-volt alternating current (AC) wall socket, you will want a relay that can handle switching 120-volts AC and has a current capacity that can safely operate the device you intend to connect. Ensure the relay can also accept a switching signal of 3.3 volts and does not exceed the Raspberry Pi's maximum GPIO current draw of 16 mA. Below are two different schematics to illustrate sensor and relay wiring.

    The first image is a wiring diagram with a Raspberry Pi connected to one DS18B20 1-wire temperature sensor and 4 relays connected to AC outlets. Note that although there are 8 outlets, this diagram only has 4 relays, which means each set of 2 outlets have a shared connection with each relay. To energize each outlet individually of a set, typically a conductor (a piece of metal) needs to be broken that links the live plugs of each outlet together, then wire each live plug to the normally-open contacts of each relay. The ground link does not need to be broken.

    The second image is a wiring schematic with a Raspberry Pi connected to 8 relays that are energizing each outlet of an 8-outlet AC power strip. Each outlet is connected to the normally-open contacts of each relay. This is done as a safety precaution to prevent an outlet from becoming energized in the event of a lost signal to the relay, switching the outlet to the default state of an open circuit.

    There are numerous different combinations of relays and outlets that can be used. This illustrates the basic principle of how each outlet is able to be controlled. When wiring AC lines, always switch the hot wire with the relay. This ensures the wire that's always connected to the outlet is ground (so if you accidentally come into contact with that wire it's safe) and a live connection only travels to the outlet when the relay is activated.

View all 4 instructions

Enjoy this project?

Share

Discussions

Similar Projects

Does this project spark your interest?

Become a member to follow this project and never miss any updates