 Ariel Quezada
Overview
Machinery vibration is usually the best indicator of overall mechanical condition. It is used in preventive and corrective maintenance.
It can be measured using displacement and velocity transducers, and accelerometers. You can get an overall reading indicating the maximum value of vibration, but the most useful information is obtained with a FFT spectrum analysis of a time period reading.
Machinery vibration analyzers are usually expensive and complicated and many small and medium sized industries can't afford this instruments, particularly in my country (Bolivia).
Open source hardware and software tools are very accessible this days, and a simple, inexpensive and open source FFT spectrum analyzer can be easily built using some of this tools.
Description
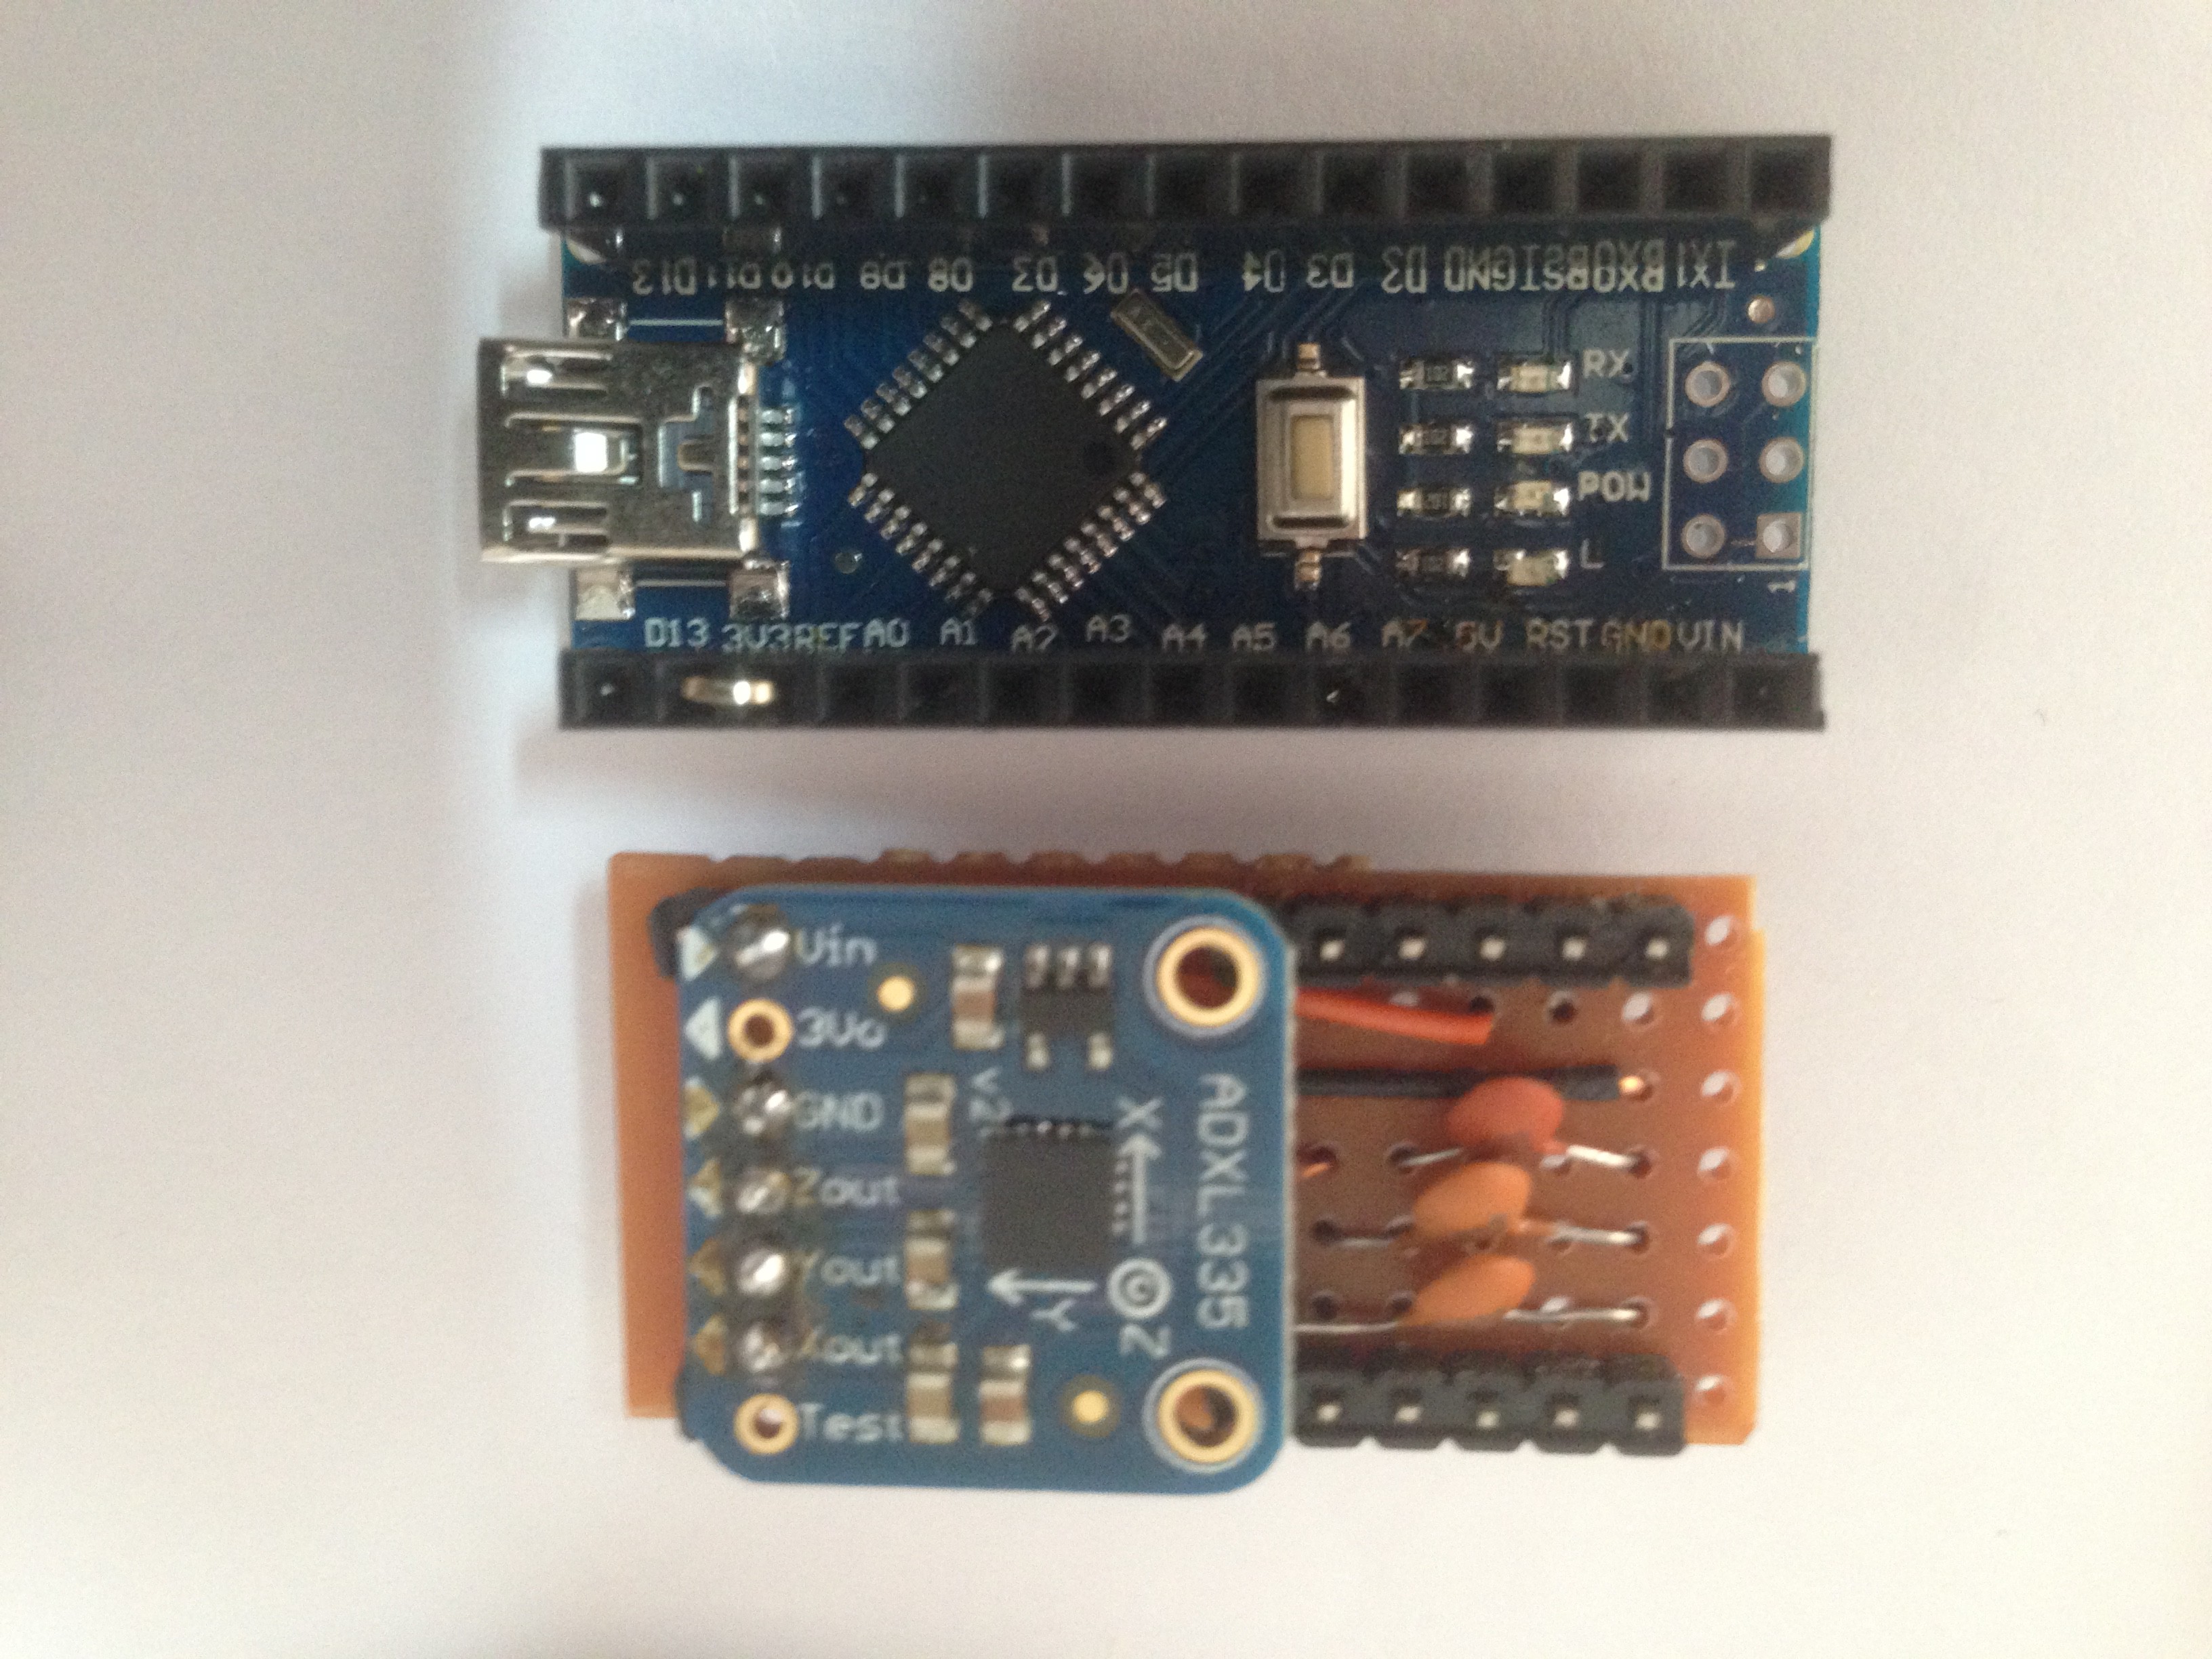
For this project, an Arduino Nano is used as the data acquisition system, it contains an USB to serial converter and ADC channels. A common accelerometer, the ADXL335 is used as the transducer for vibration measurement, and a computer is the FFT analyzer, using Python and Numy, Scipy and Matplotlib libraries.
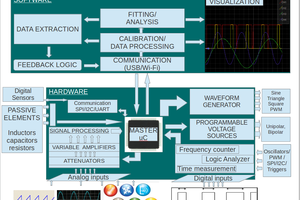
A system diagram is shown below.
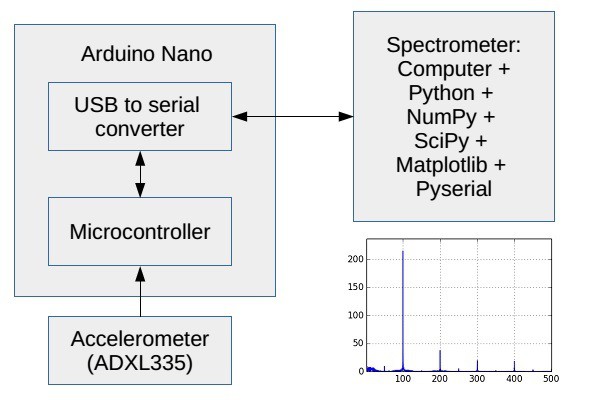
The Arduino Nano listens for an incoming command from the computer, that tells it to start or stop sending ADC readings. The ADC reads the accelerometer vibration channels on a given sampling frequency (5000 Hz), controlled by one of the micro controller timers. This readings are sent on the serial port at a speed of 0.5 Mbps.
The Arduino Nano program (adxl335_01.c ) is compiled with Avr gcc, and programmed using Avrdude and the Arduino Bootloader installed in the atMega328 microcontroller. The Arduino libraries and IDE are not used.
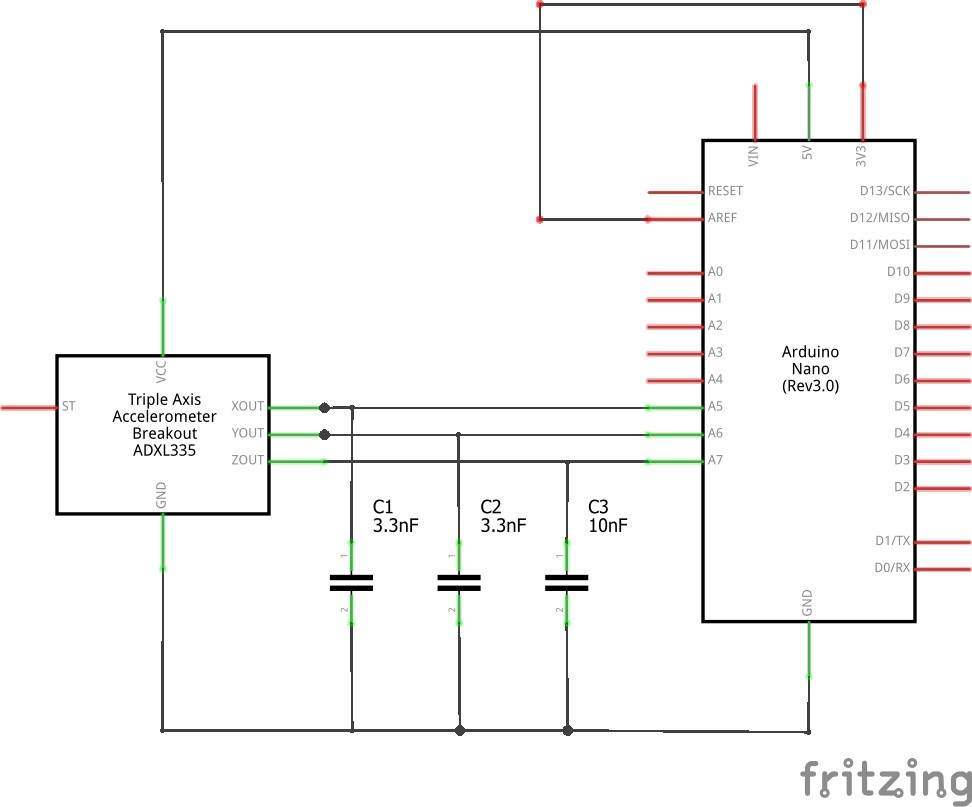
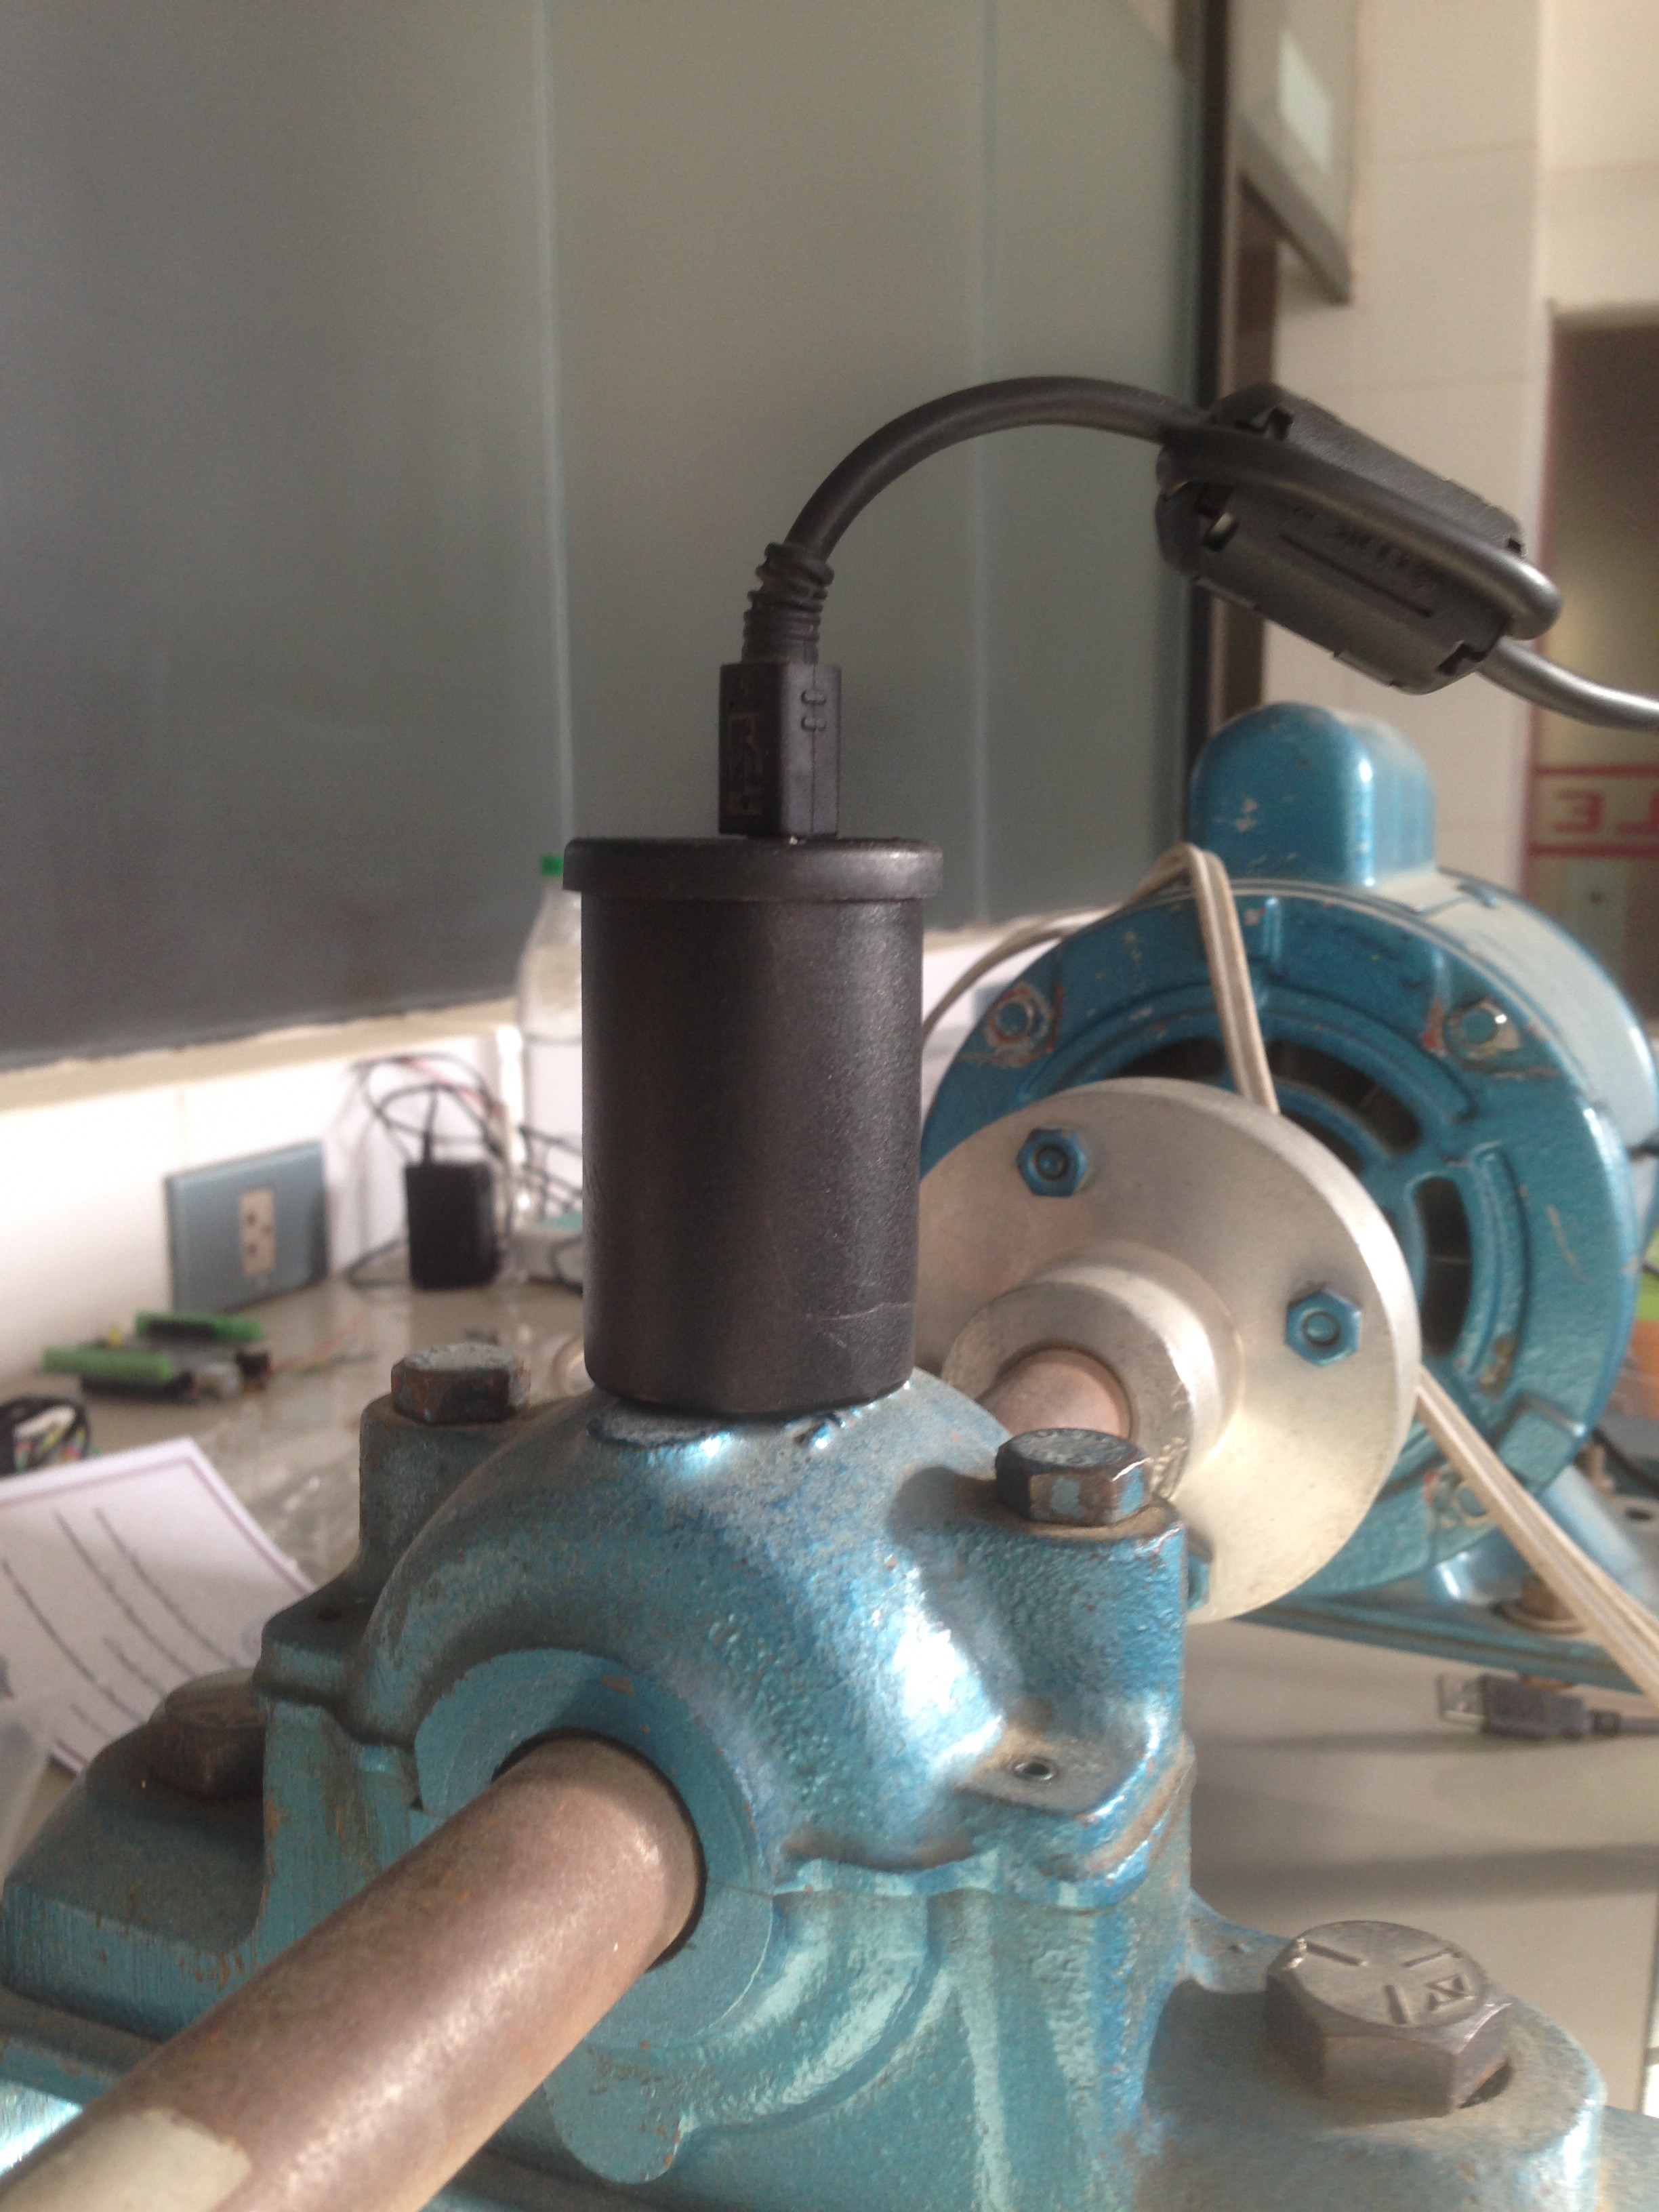
The ADXL335 is a small, thin, low power, complete 3-axis accelerometer with signal conditioned voltage outputs. Maximum bandwidth is selected for the application, with a range of 1600 Hz for the X and Y axes. The Z axis maximum range is 550Hz, and is not used because the limited range, but it is wired to the micro controller in case it is used in the future.
A circuit diagram is shown next.
The computer controls the data acquisition sending commands to start or stop the transmission of samples. The program counts the amount of data received and the amount of data it needs (sample size). When the necessary amount of data has been taken, a command to stop is send to the microcontroller. Pyserial is the python library used to control the serial communication.
The serial communication is binary based and a mechanism to mark the end of packages is necessary. A PPP type byte stuffing algorithm is used for this. In PPP frame boundaries are marked with a reserved byte value 0x7E. This reserved value is not permitted to occur in any other place than frame boundary. In a case the reserved value should occur in data packet, an escape sequence is used to transfer 0x7E into byte sequence of 0x7D, 0x5E. The byte value 0x7D means that a possible escape follows and is called a Control Escape value. Also the Control Escape itself needs to be escaped and becomes to byte sequence of 0x7D, 0x5D.
This PPP framing algorithm is used in the Arduino Nano and on the python program for the computer.
There are two python programs, one for data acquisition from the serial port and saving that data, and the second for file opening, plotting of data and FFT spectrum calculation and plotting.
Program serial_avr_01.py sends commands to the Arduino and reads data from the serial port. Once the desired amount of data has been acquired, it is saved on a file, as text, separated by comas and delimited by tags.
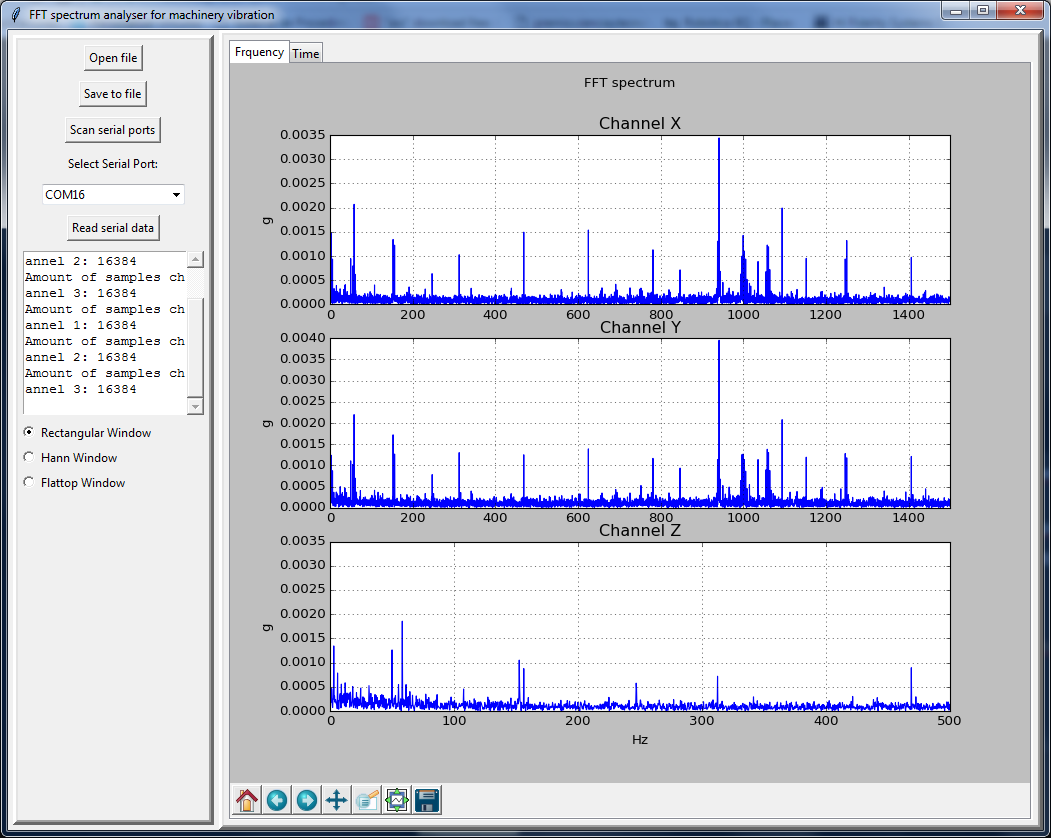
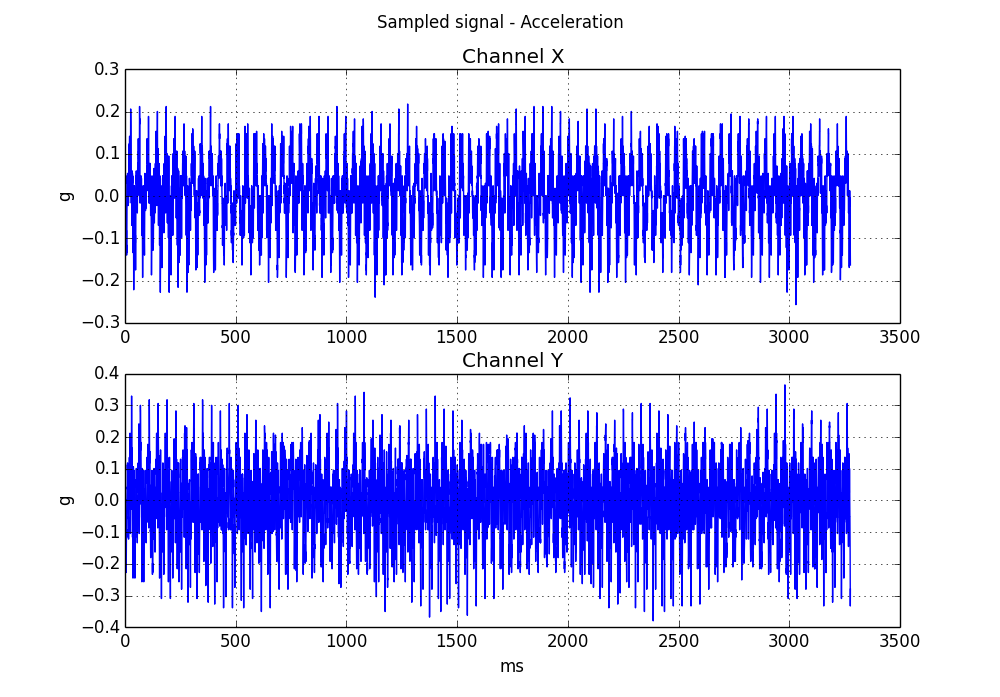
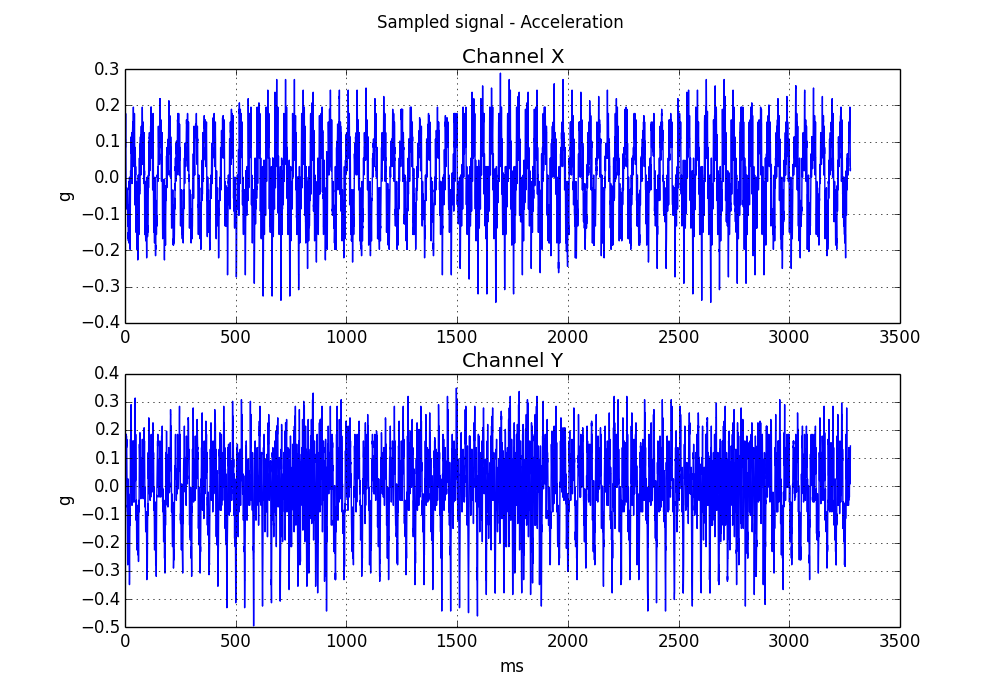
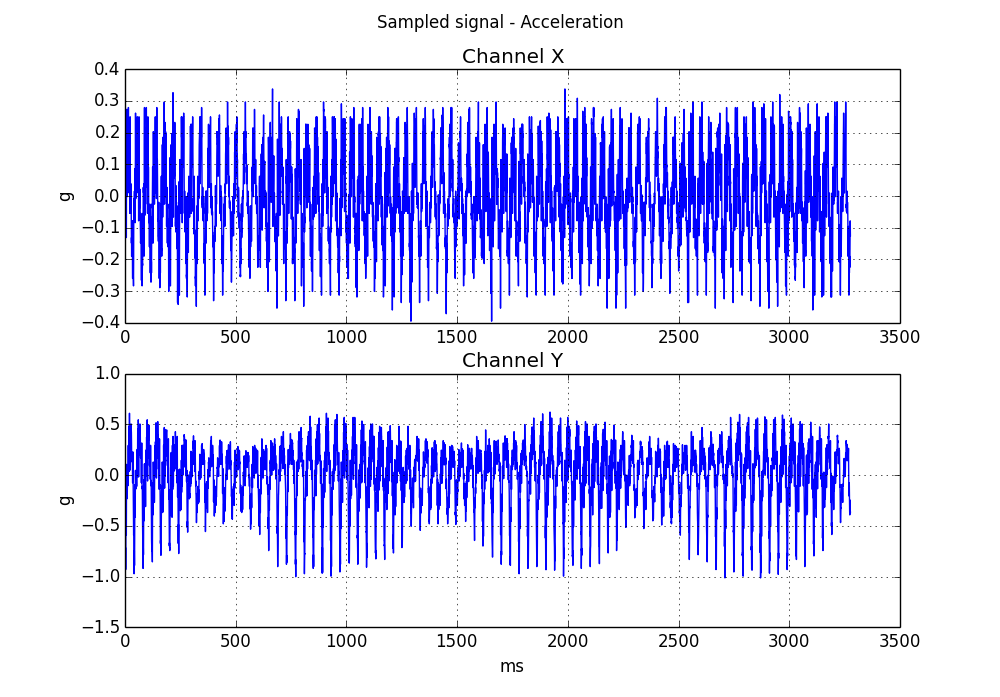
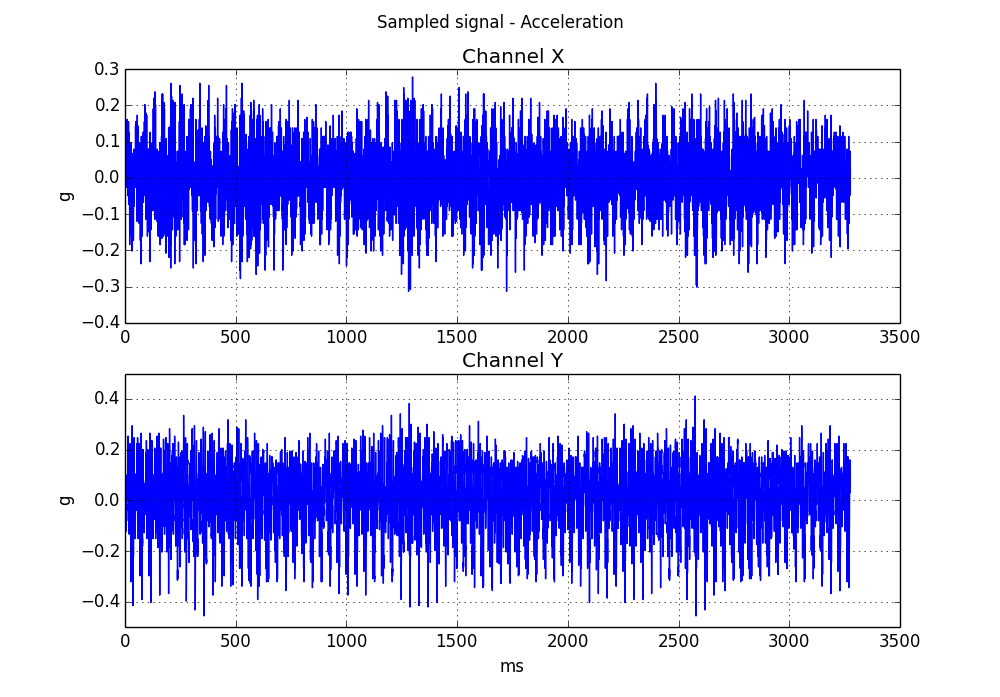
Program acel_file_plot_02.py waits for a file name introduced on console, opens the file and plots the signal from the accelerometer. It is shown on the next picture.
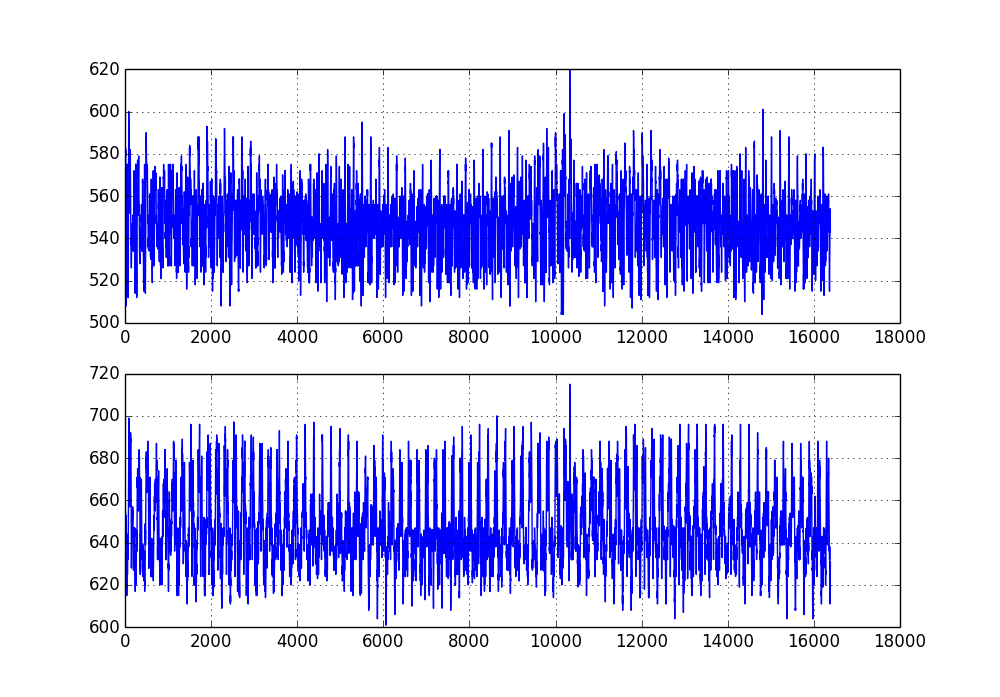
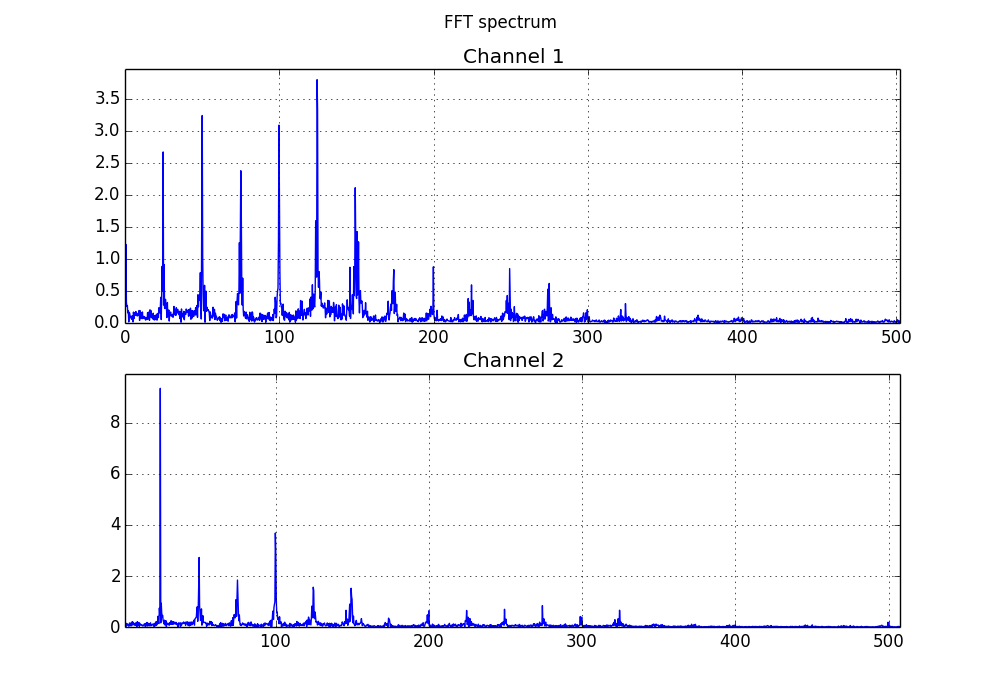
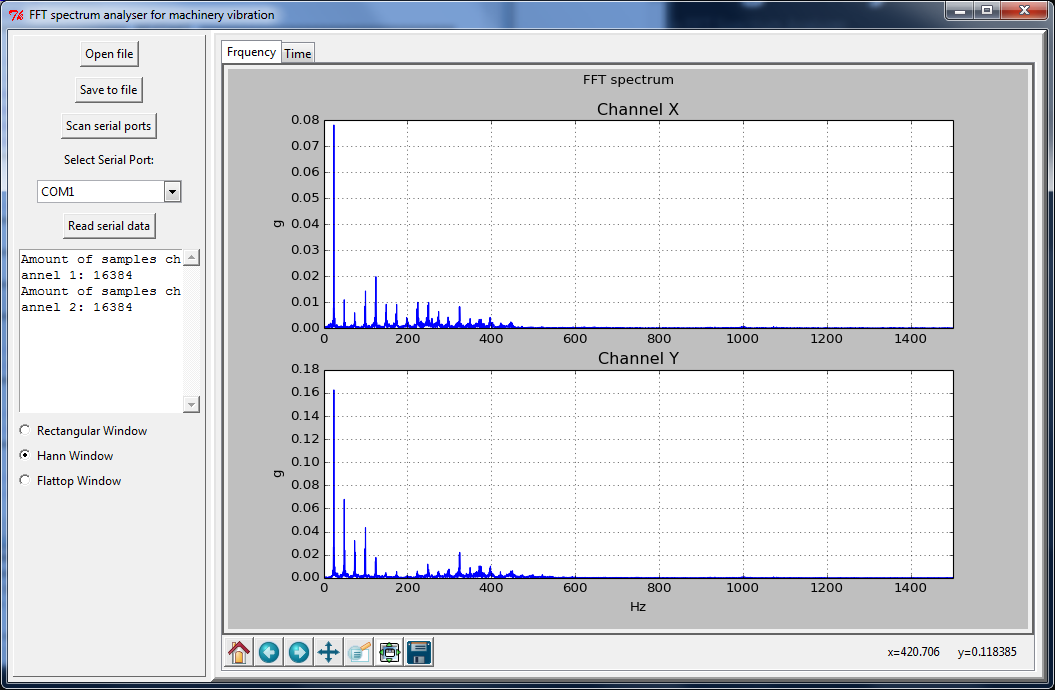
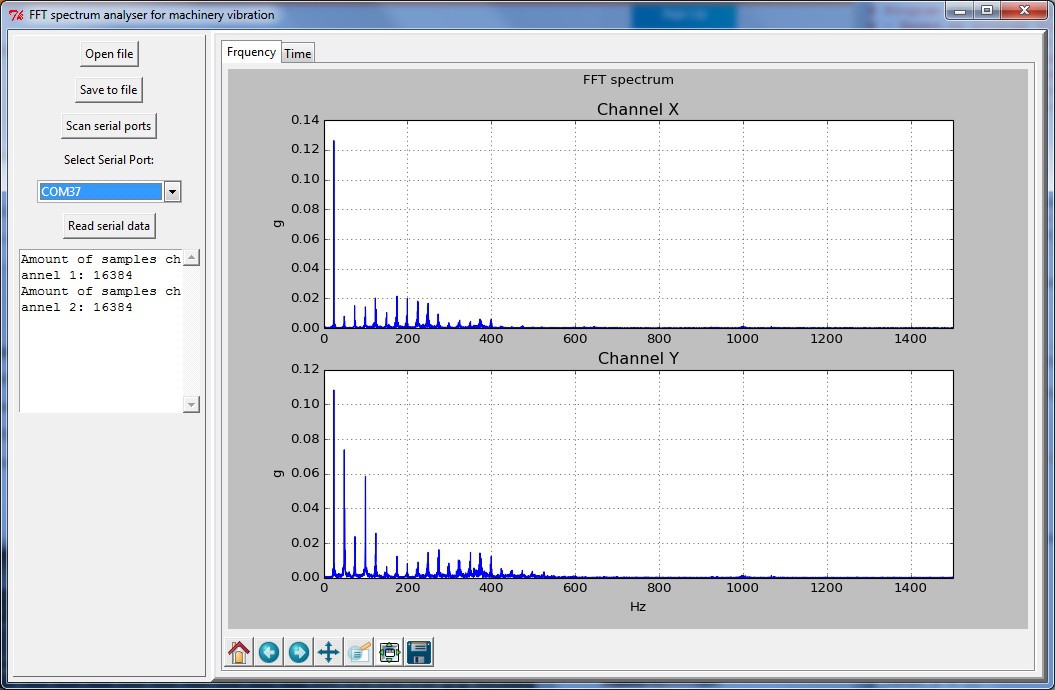
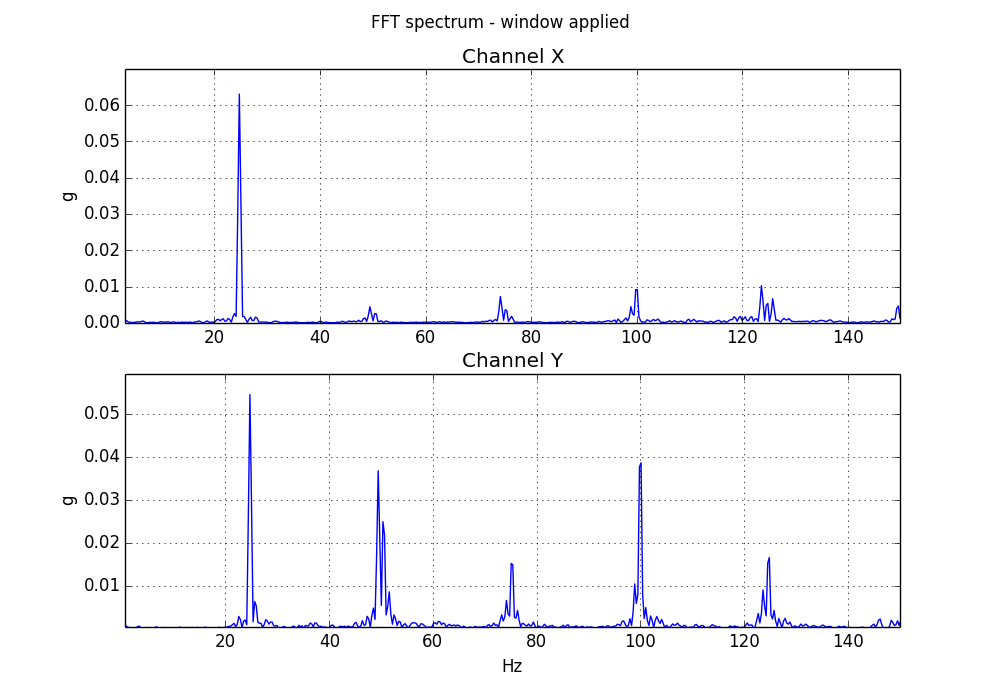
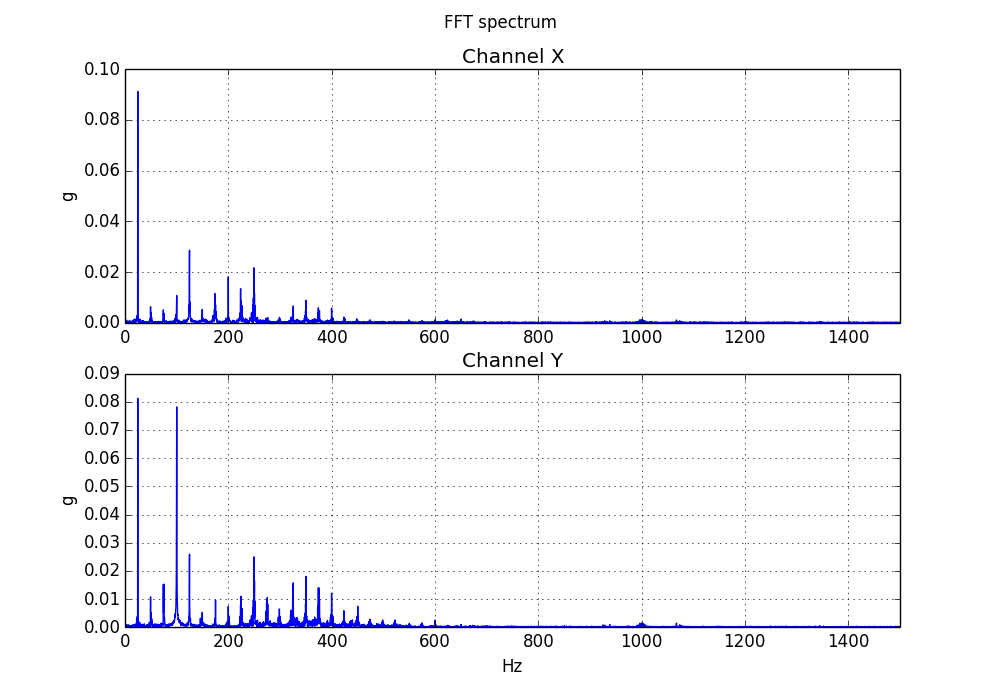
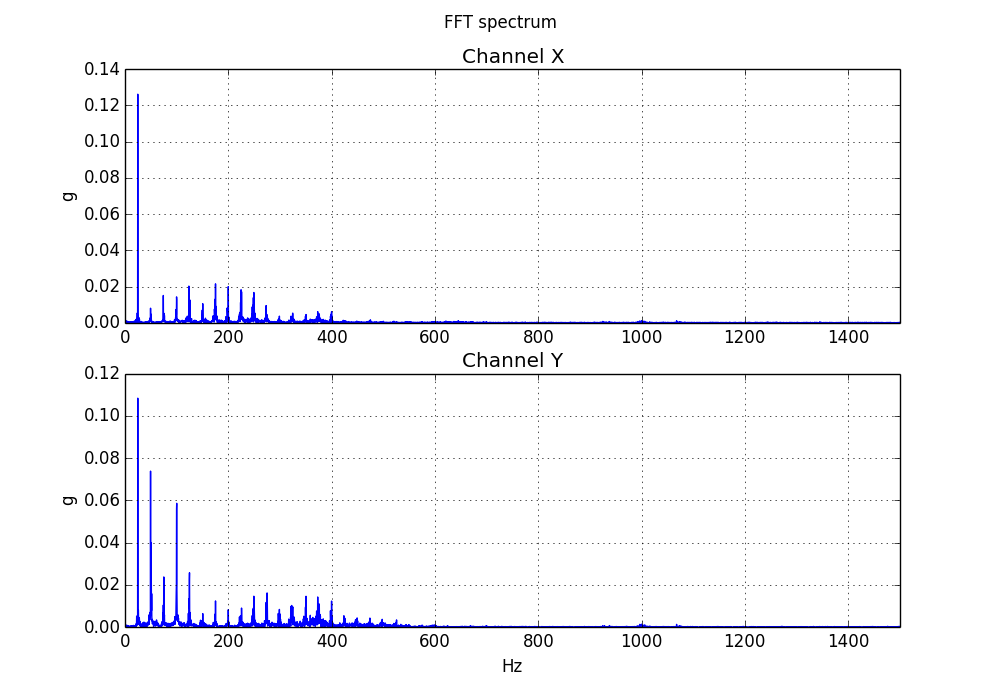
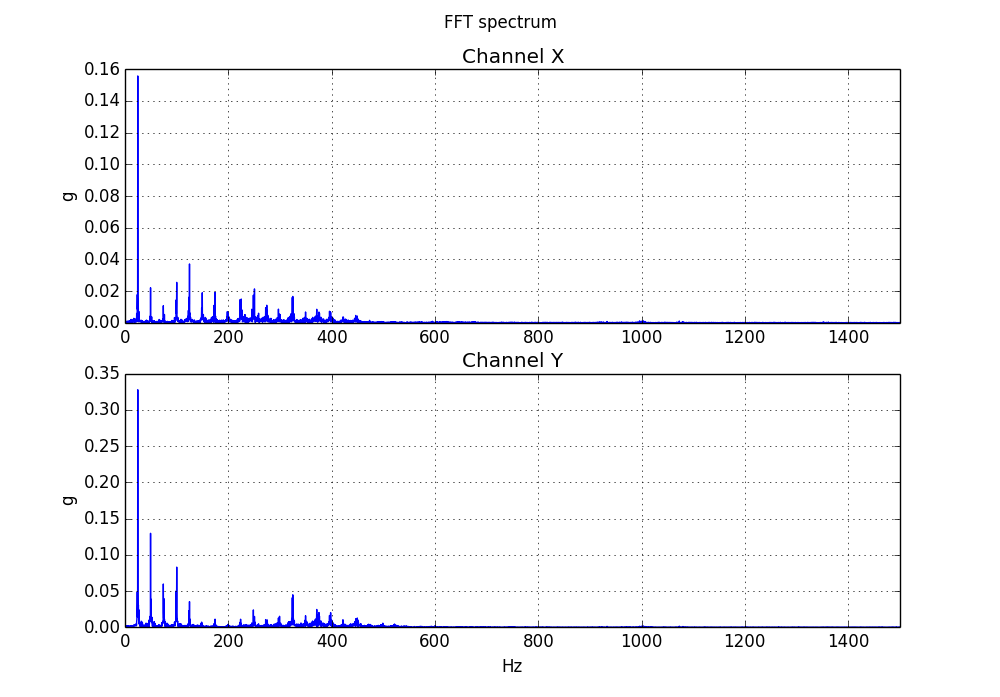
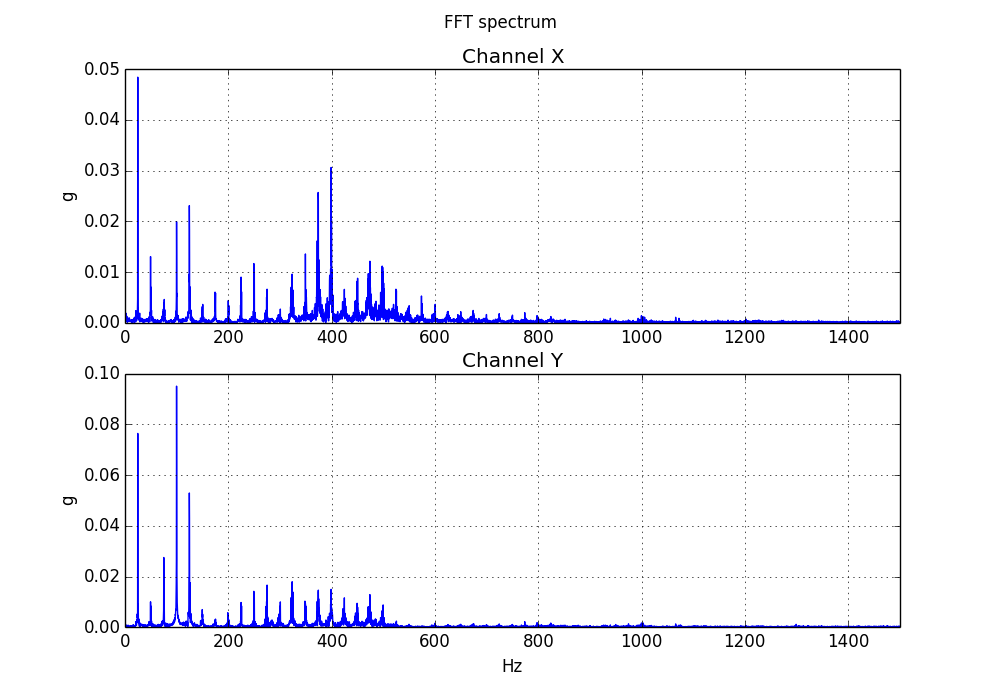
Then, the FFT spectrum is calculated and plotted. It can be seen in the next picture.
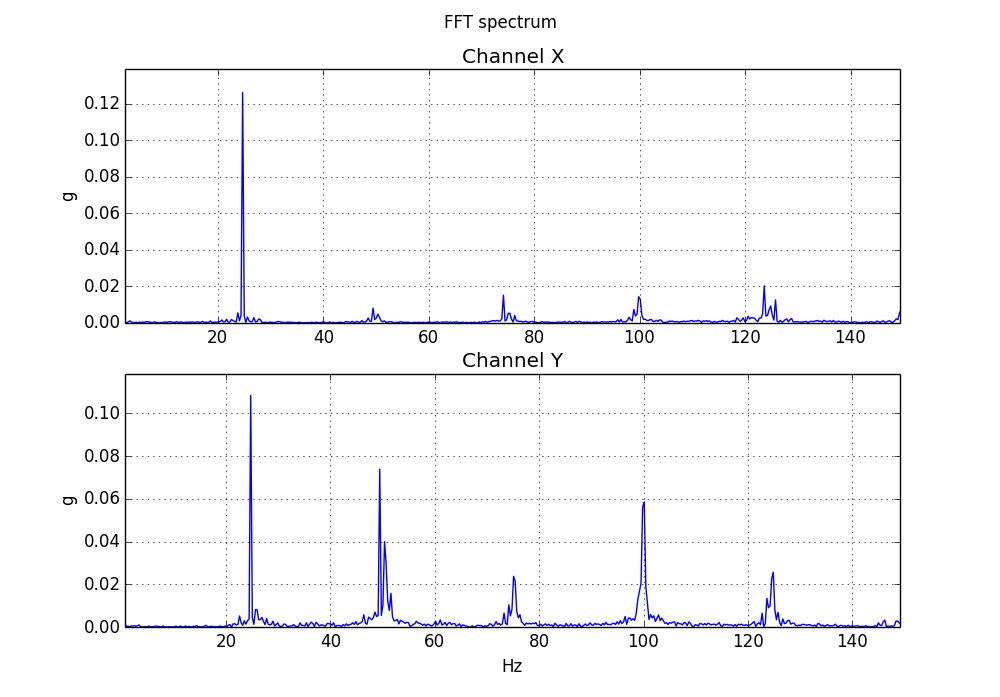
This images correspond to a motor running at 1450 rpm (24.17 Hz). It can be seen that the peaks in the FFT spectrum are multiples of this frequency (24.17, 48.33, 72.5, 95.67, 120.83 and so on).


 Jithin
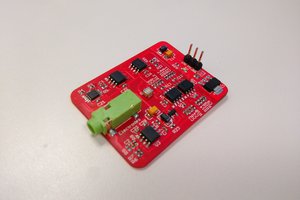
 Alvaro Villoslada
 edensrock
Hola Ariel Mi español es terrible Por favor, ignore algunos errores.
Me gustaría hablar idéias de algas intercambiais e intercambiais sobre su projeto, tengo un projeto semelhante.
correo eletrônico: josiasblue@hotmail.com
Agradecido