 David H Haffner Sr
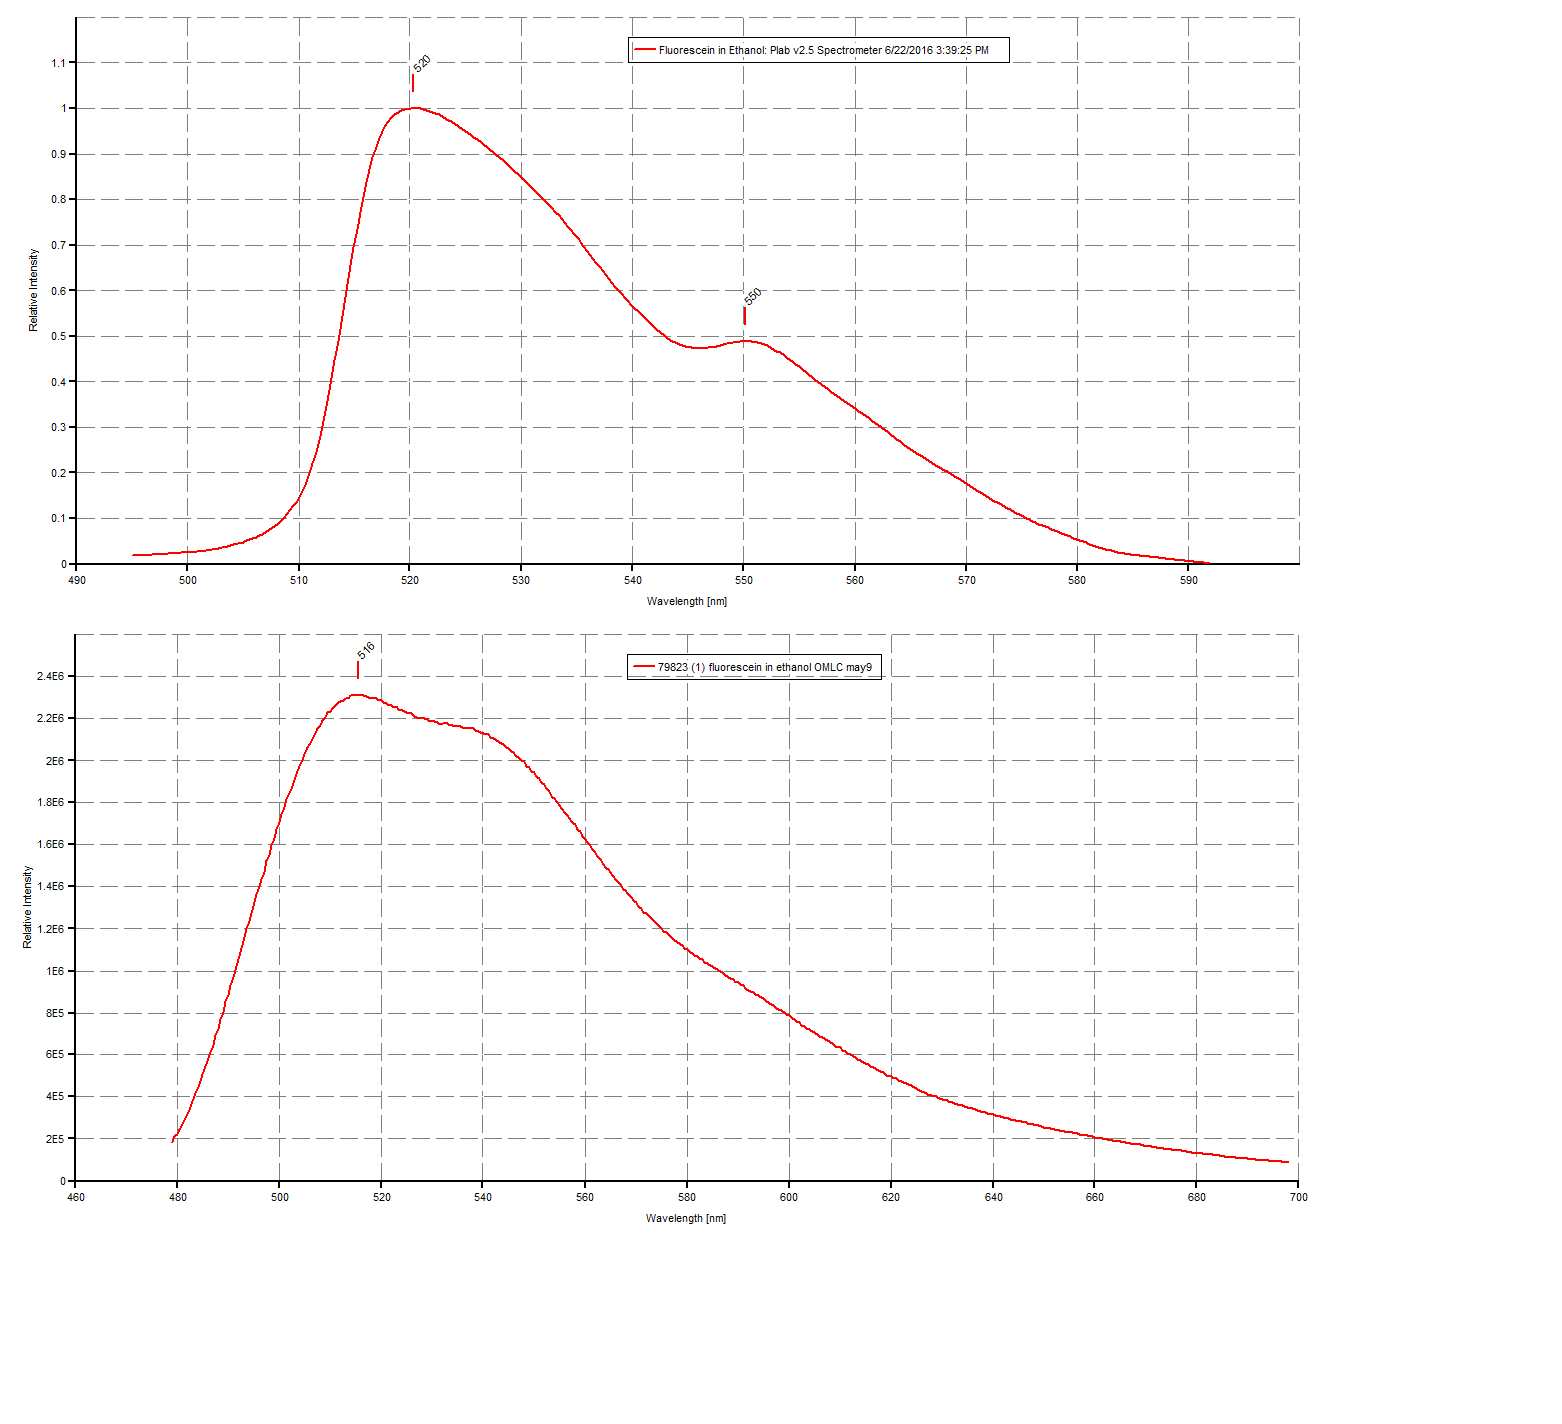
Here are the two sample spectra separated on different graphs so the plab sample isn't crunched up on the same plot:
The only caveat about the Plab plot for the fluorescein sample is, that you can see how the 532nm laser's wavelength dominates the peak, especially at the second smaller peak down at the tail end, ( I need either a notch filter or long pass filter to eliminate the laser line.)
Discussions
Become a Hackaday.io Member
Create an account to leave a comment. Already have an account? Log In.