 David H Haffner Sr
A question I had asked myself was, “can I get an absorption and emission spectrum together at the same time by using a laser?”
The answer was yes! I prepped 5 sample cuvettes with 5 different dilutions of Safranin O and I used the solvent Methanol, I used this solvent because there are two major research publications using Safranin O and Methanol, so I followed their method an attained similar results.
I wanted to know the answer as to how and why, it could be possible that a fluorescent spectrum could yield an absorbance spectrum also using a laser, so I did some research and this is what I found:
“Just going back to basics, an absorption spectrum measures wavelengths at which a molecule absorbs light, while an excitation spectrum determines the wavelengths of light necessary to produce emission or fluorescence from the molecule, as monitored at a particular wavelength. One can think of an excitation spectrum as "fluorescence detected absorption'“. For many aromatic organic molecules, there is a rule called Kasha's rule, which states that although absorption can occur to several excited singlet states, S1, S2, S3, etc., emission (fluorescence) normally occurs only from the lowest excited singlet, S1. When one excites the higher states S2, S3 etc., one typically has rapid radiation less relaxation down to S1 on the picosecond timescale, followed by emission to the ground singlet, S0. So in such molecules one will indeed observe peaks in the excitation spectrum (obtained while monitoring S1 fluorescence) corresponding to absorptions to S2, S3, etc., because such absorptions do ultimately lead to emission from S1. If, by contrast, absorption to the higher S2, S3 states gives rise only to radiation less deactivation to the ground state (the case described by Dr. ten Brink), then the excitation spectrum for S1 fluorescence would not show the S2, S3 absorptions.
A final comment: Bear in mind that the intensity of peaks seen in the excitation spectrum is directly proportional to the number of photons absorbed. By contrast, in absorption spectroscopy, one usually measures the absorbance, which is log (base10) of incident light intensity over transmitted light intensity. Thus peaks in the excitation spectrum will not have the same relative intensities as peaks in the absorption spectrum, although they should appear at the same wavelengths. As an example, consider two peaks in a hypothetical absorption spectrum with absorbance’s of 2 and 1, respectively. Of course the first peak will appear to be twice as "high" as the second, on an absorbance scale. But in terms of absorbed light, for the first peak, 99% (1% transmitted) of the light is absorbed, while for the second peak 90% is absorbed (10% transmitted).
So in the excitation spectrum, the first peak would have an intensity only about 1.1 times that of the second peak. As one goes to a very dilute sample, however, the relative intensities in the two types of spectrum approach the same value.” (excerpt quoted from Research Gate online, reference given below.)
For an in depth education on this, I have provided the reference below;
In essence, the main reason I could observe the absorption peaks of my sample of Safranin O (basic red#2) is because the excitation source (the 532nm laser,) was able to excite the higher S2 and S3 transition states. This is NOT the case though, with all chromophore’s when using a laser source.
Now since this was my highest concentrated solution at 112mg, this makes sense that my first peak has a slightly lower intensity percentage than the second peak, as one factor goes up (absorption) the other factor goes down (transmittance.)
The Beer-Lambert Law still applies, whether I use a laser or a radiant white light source.
Targets and purpose for this study were, to test the Plab v2.5 Spectrometer’s capabilities at accurately resolving both absorption and emission spectra at its present specifications, using both a steady and reliable radiant light source (Solux 4700K 12vdc lamp) and a DPSS 150mW Green laser source.
The four main points of this study are bulleted below;
- 1 )Reference material- SPECTRAL CHARATERISTICS OF AZO DYES (2)
- 2)Safranin O (basic red # 2)
- 3)Absorption maxima @ 522, 524 and 525nm respectively (published in the literature) (1)(2)
- 4)Emission maxima @ 563nm in Methanol (6 – 24%) (published in the literature) (1)(2)
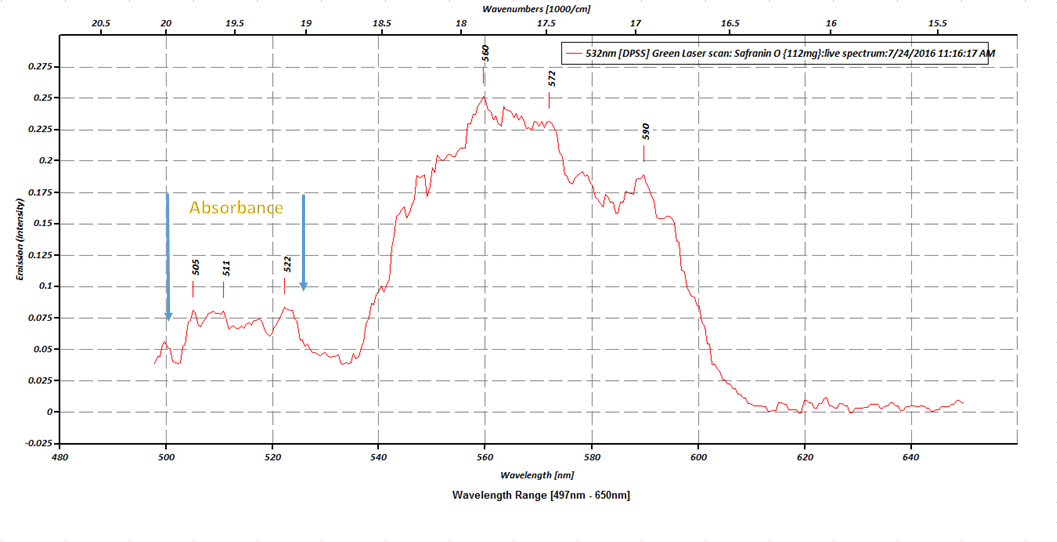
- The first plot is the raw data from the initial scan, and I have it marked on the plot, the absorption peaks from the excitation states S2and S3.
![]() So we can see that, the fluorescence of our sample, has caused sufficient emission from the S1 state, to were, we are able to observe the absorbance in the S2 and S3 states.The next plot compares the absorption and emission percentages of T-transmission and A-absorption. The first peak (absorption) is @ 68% absorbance, where the second peak (emission) is @ 87%. There is also a picture in the plot of the 5 samples of Safranin O at there exact dilutions, the same samples are also depicted in the last picture with my 405nm UV laser pointer illuminating through all 5 samples, in order to demonstrate the beer-lambert law in action.
So we can see that, the fluorescence of our sample, has caused sufficient emission from the S1 state, to were, we are able to observe the absorbance in the S2 and S3 states.The next plot compares the absorption and emission percentages of T-transmission and A-absorption. The first peak (absorption) is @ 68% absorbance, where the second peak (emission) is @ 87%. There is also a picture in the plot of the 5 samples of Safranin O at there exact dilutions, the same samples are also depicted in the last picture with my 405nm UV laser pointer illuminating through all 5 samples, in order to demonstrate the beer-lambert law in action.![]() This next graph is the absorption plot
This next graph is the absorption plot![]() Emission plot
Emission plot![]()
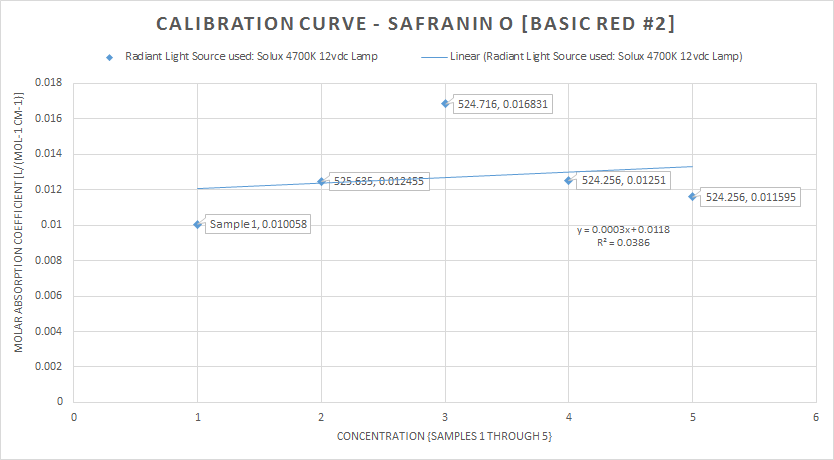
This next plot is the calibration curve for the initial Solux 4700K lamp scan for the 5 samples, and indicates their respective concentrations and absorbance maxima![]()
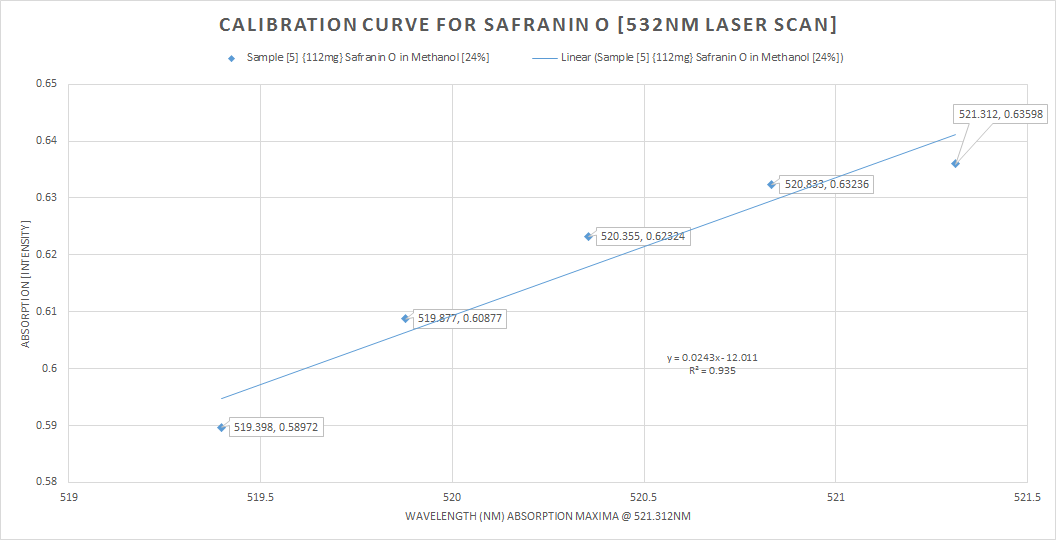
The last plot is the calibration curve for the absorption peak for the 532nm laser scan![]()
Some discussion, with both the radiant light source scan (the Solux 4700K lamp) as my reference and the main target of the study, the 532nm laser scan, experimentally I think I have fell well within acceptable parameters of the main bulleted points from earlier (3) and (4) my target was 1) absorption @ 522nm, 524nm and 525nm for Safranin O in Methanol @ (6-24%)The emission peak at only 561nm is very close to the posted literature of 563nm, so I still have a 2nm error, this can still be operator error, resolution, ect.,In conclusion, I think the techniques demonstrated are very workable for this spectrometer's current specifications of 0.12mm slit width, 2770 lines ruling density (DVD {8.4g} diffraction grating) and the JDEPC-OV05 cmos sensor.References:(1)http://www.researchgate.net/publication/10769812_Spectral_studies_of_safranin-O_in_different_surfactant_solutions - - Safranin O in Methanol
(2)http://shodhganga.inflibnet.ac.in/bitstream/10603/9919/9/09_chapter%204.pdf -– Absorption and Fluorescent Spectra of Safranin O, Pg.93 SEC. 4.5.1.2 (SPECTRAL CHARATERISTICS OF AZO DYES)![]()
 So we can see that, the fluorescence of our sample, has caused sufficient emission from the S1 state, to were, we are able to observe the absorbance in the S2 and S3 states.The next plot compares the absorption and emission percentages of T-transmission and A-absorption. The first peak (absorption) is @ 68% absorbance, where the second peak (emission) is @ 87%. There is also a picture in the plot of the 5 samples of Safranin O at there exact dilutions, the same samples are also depicted in the last picture with my 405nm UV laser pointer illuminating through all 5 samples, in order to demonstrate the beer-lambert law in action.
 This next graph is the absorption plot
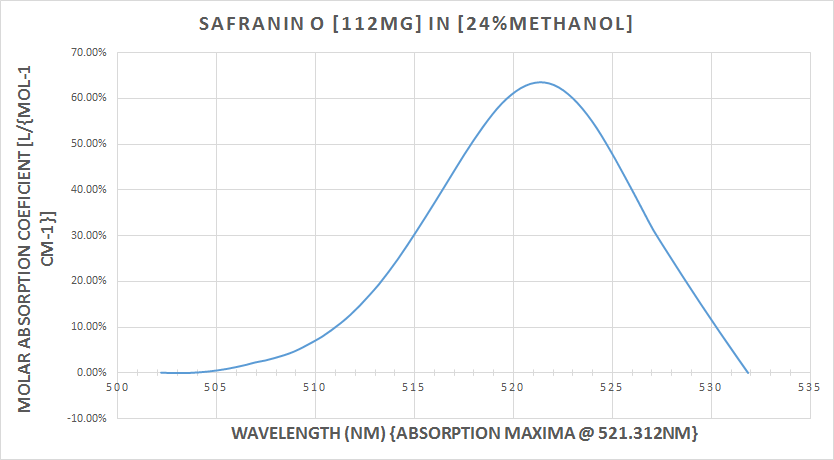 Emission plot
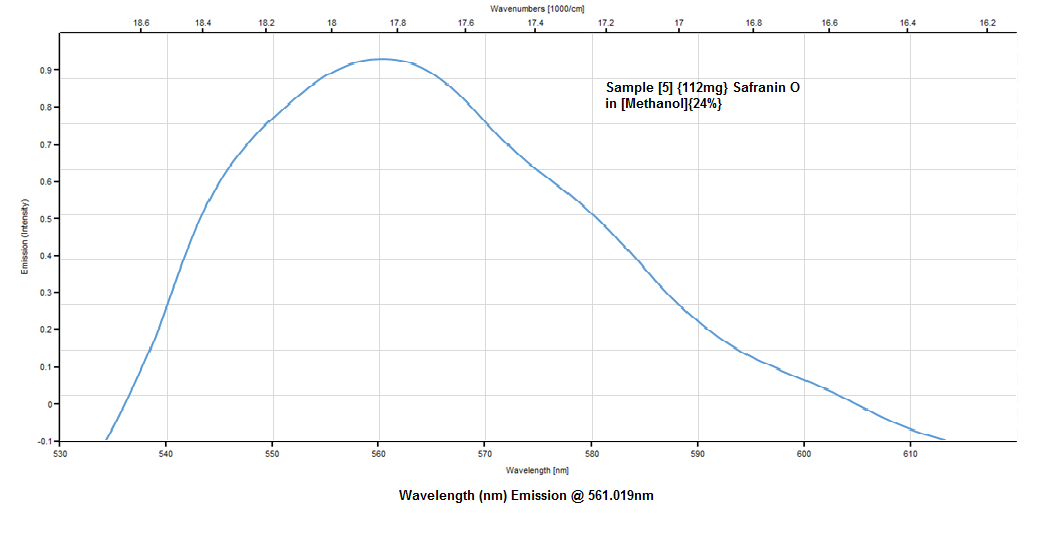

Discussions
Become a Hackaday.io Member
Create an account to leave a comment. Already have an account? Log In.