 Arthur Admiraal
In this log, I will try to succinctly explain the information I have gathered on flow-dependent electrical behaviours of electrolytic solutions in basic terms. So let’s start by breaking that sentence down.
Electrolytic solutions
As probably everyone reading this knows, our world consists of tiny particles called atoms. These atoms consist of a positively charged nucleus ‘orbited’ by one or more negatively charged electrons. The positive charge of the nucleus and the negative charge of the electrons cancel out, so that the atom as a whole is neutral. Sometimes, an atom can gain or loose an electron, so that it becomes negatively or positively charged respectively. In this case we stop calling it an atom and call it an ion instead[1].

Figure 1: Schematical representation of electrolytic solution.
Electrolytic solutions are solutions that contain ions[2]. Salts, a class of compounds, consist of ions. Table salt is a salt. So, table salt in water is an electrolytic solution. In fact, tap water also contains trace amounts of various salts, which makes it an electrolytic solution, just a very dilute one.
The cool thing about electrolytic solutions is that they can conduct electricity. They can because the ions can freely move throughout the solution and where charge can be moved, electric current can flow.
A basic question
About a year ago, I wondered whether the fact that an electrical current can influence the movement of the ions meant that a movement of the solution could also influence this movement, and in turn, the electrical current.
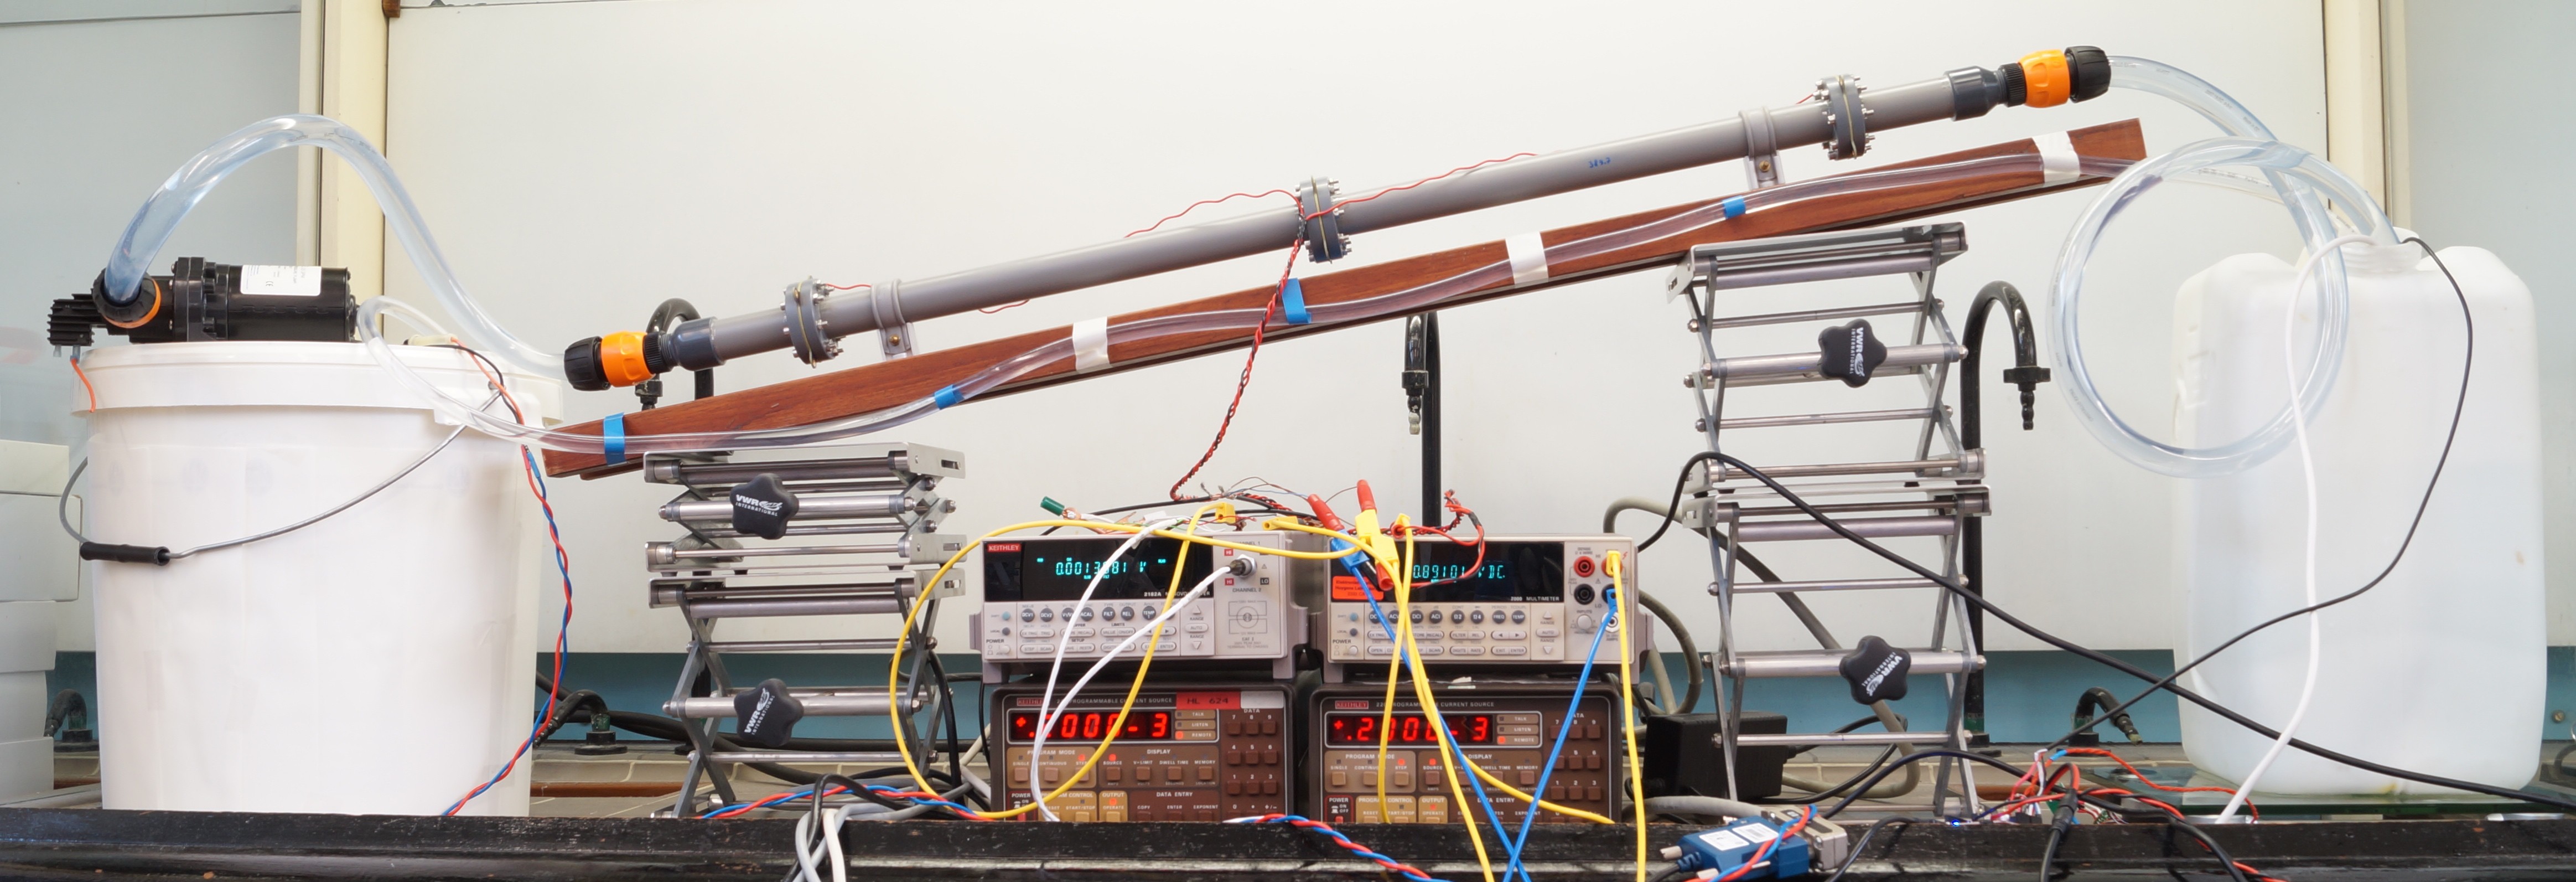
Figure 2: Early revision of test setup.
So I did some research. You can read the full thing here, but I will explain the experiment here and now. My setup consisted of a tube, in which 2 electrodes were placed. I actually used OSHpark PCB’s as electrodes, because they are gold-plated, so they won’t erode and are quite cheap for a gold-plated object to get custom-made. I used a pump to pump a solution of table salt in water through the tube for a certain amount of time. During this time, I put a constant voltage over the electrodes and logged the current using a current amplifier and my oscilloscope. I repeated the experiment for various flow speeds.
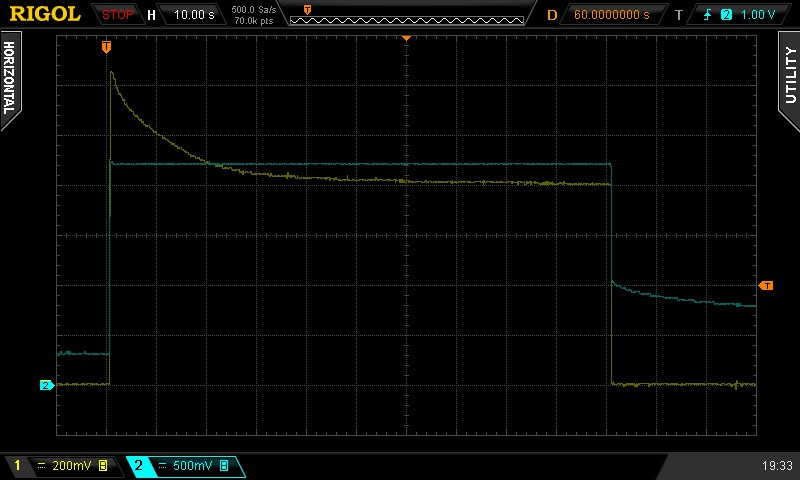
Figure 3: Measurement example.
I got results like the above, taken straight from my oscilloscope. In it, the blue trace is the voltage over the solution, while the yellow trace is the current through it, where one mV on the oscilloscope is one uA of current through the solution.
The origin of the results
Where does the curved shape of the current come from? To find the answer, we need to have a closer look at a fairly obscure area of physical chemistry.
As a voltage is applied over an electrolytic solution, the ions start moving towards the electrode that is oppositely charged to them. You would think that this creates a huge separation of ions throughout the solution, but what actually happens is that the ions clump up close to the electrodes, thereby negating their charge, so that the ions in the bulk of the solution aren’t influenced all that much. This cloud of ions close to the electrodes is called an electrical double layer, and its formation is what causes the current to start out relatively high, and taper off towards the end.
You may be wondering now where the base current comes from, since I just mentioned that the ions, which transfer the electrical charge, stop moving after a while.

Figure 4: Schematical overview of faradaic currents.
This current arises from particles, which are bumped all over the place in a process named diffusion. They react at the electrodes in a redox reaction, thereby gaining or loosing an electron and then diffuse away. Since they basically stole or brought an electron, charge was moved, thus creating an electric current. This current is known as the faradaic current[2].
These two effects shape the equivalent circuit. We model the charging action of the electrical double layers as capacitors, the most basic components for storing charge. The faradaic currents form an additional path for the current to go through, so they can be modelled using resistors in parallel with the capacitors. Then there is also the resistance in the bulk of the solution, due to the drag the ions encounter there. This can be modelled using a resistor in series with our circuit. Keep in mind that there are two electrodes, and that there is a double layer at each of them, so we need two instances of our RC-parallel circuit. Putting all this information together, we get the following circuit:

Figure 5: Equivalent circuit of electrolytic solution.
Analysis
Knowing this circuit, I could find its behaviour by solving a basic differential equitation, again: you can find the nitty-gritty calculations in the full report. I could then fit my data to this behaviour. From this fit, you can calculate the component values in the equivalent circuit. I could then compare those for various flow speeds[3].
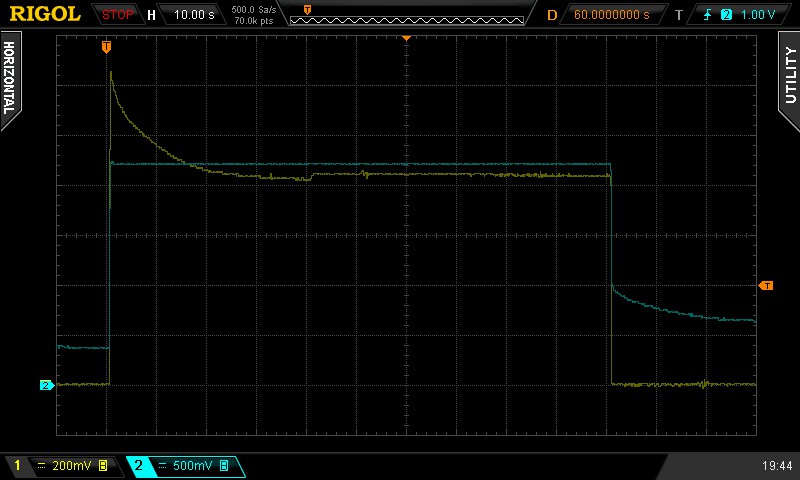
Figure 6: Jumpy current waveform during flow change
I knew there was some change in the electrical behaviour of the electrolytic solution, because I also conducted measurements in which I turned on the pump halfway through, which resulted in a jump in the waveform. What I didn’t know was if this change varied with the flow through the tube. Luckily the calculations yielded an answer:
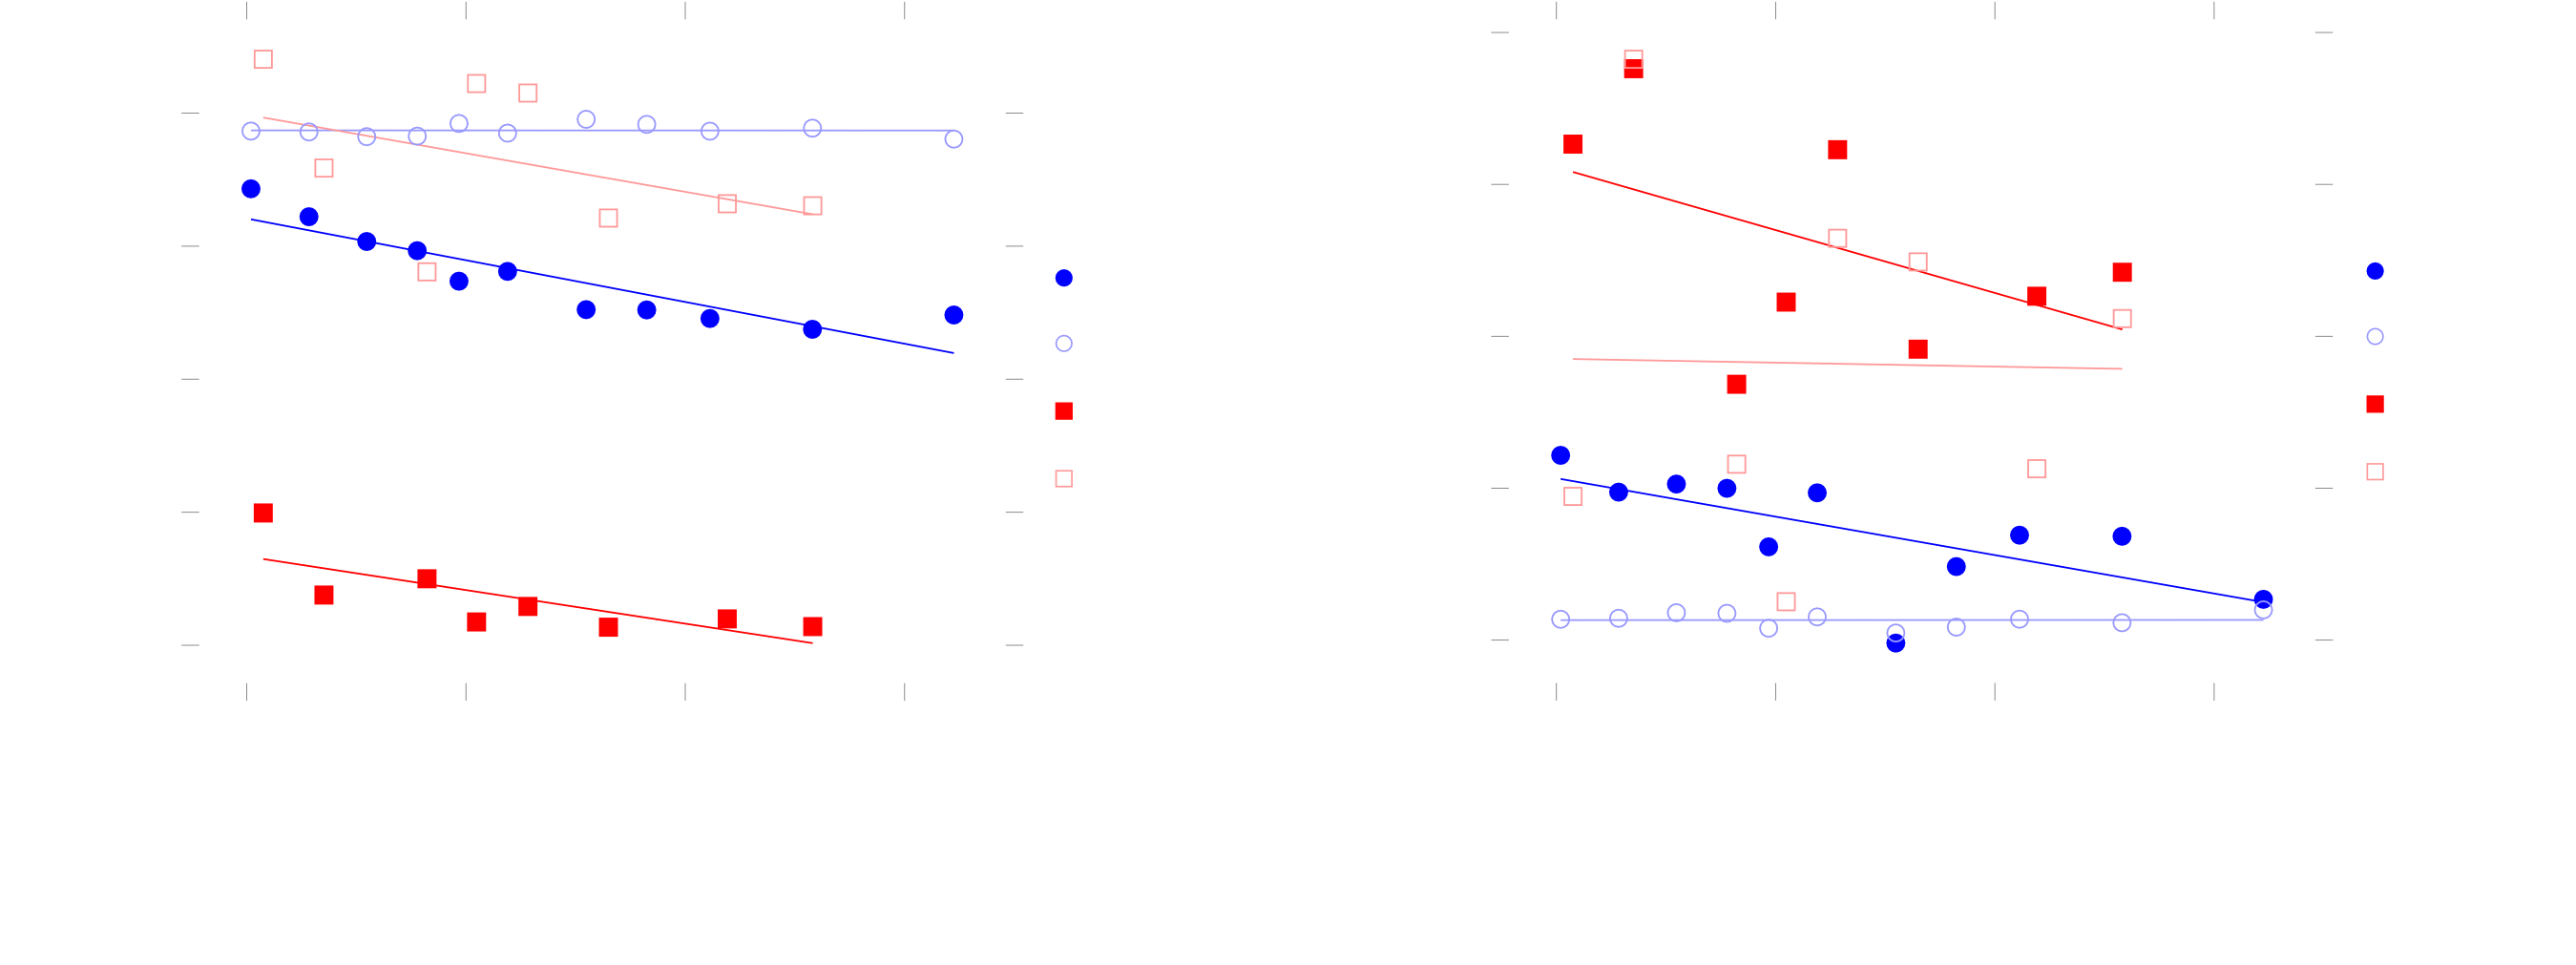
Figure 7: Results
There definitely seems to be some sort of correlation going on. My current thinking is that the flow-dependent behaviours are caused by disturbances in the formation of the electrical double due to the flow, but that is hard to say for sure without some advanced mathematical analysis of double-layer formation and some more data. For now, it’s hard to even tell what kind of correlation there is between flow and the equivalent component values. This is because of some problems with my methodology, on which I want to improve in this project:
- The measurements took quite long.
- The function fitting did not work too well.
- The flow speed was not tightly controlled.
I will examine each of these problems in closer detail, along with the solutions, which formed my current methodology, in a later log. With some luck, I can use the data I gather during this project to find out more about the underlying mechanisms causing the flow-dependent electrical behaviours.
So now you know all about my investigations into this topic so far. If you want to know more, tinker around with the data yourself or just have a look at the code I used in my test setup, I will refer you to the full report. If you have any questions, feel free to ask them in the discussion.
Endnotes
[1] Sidenote: there do also exist ions consisting of more than one atom.
[2] A. D. Mcnaught and A. Wilkinson. IUPAC. Compendium of Chemical Terminology, 2nd ed. (the ”Gold Book”). WileyBlackwell; 2nd Revised edition edition. isbn: 978-0865426849.
[3] This is not quite true, but this explanation gives the gist of it. I actually compared the component values to those of a measurement without flow captured close to the measurement and then plotted the deviations in those values versus the flow. This is also why some of the units on the axis don’t match with the story.
Discussions
Become a Hackaday.io Member
Create an account to leave a comment. Already have an account? Log In.