 Jonathan Buchanan
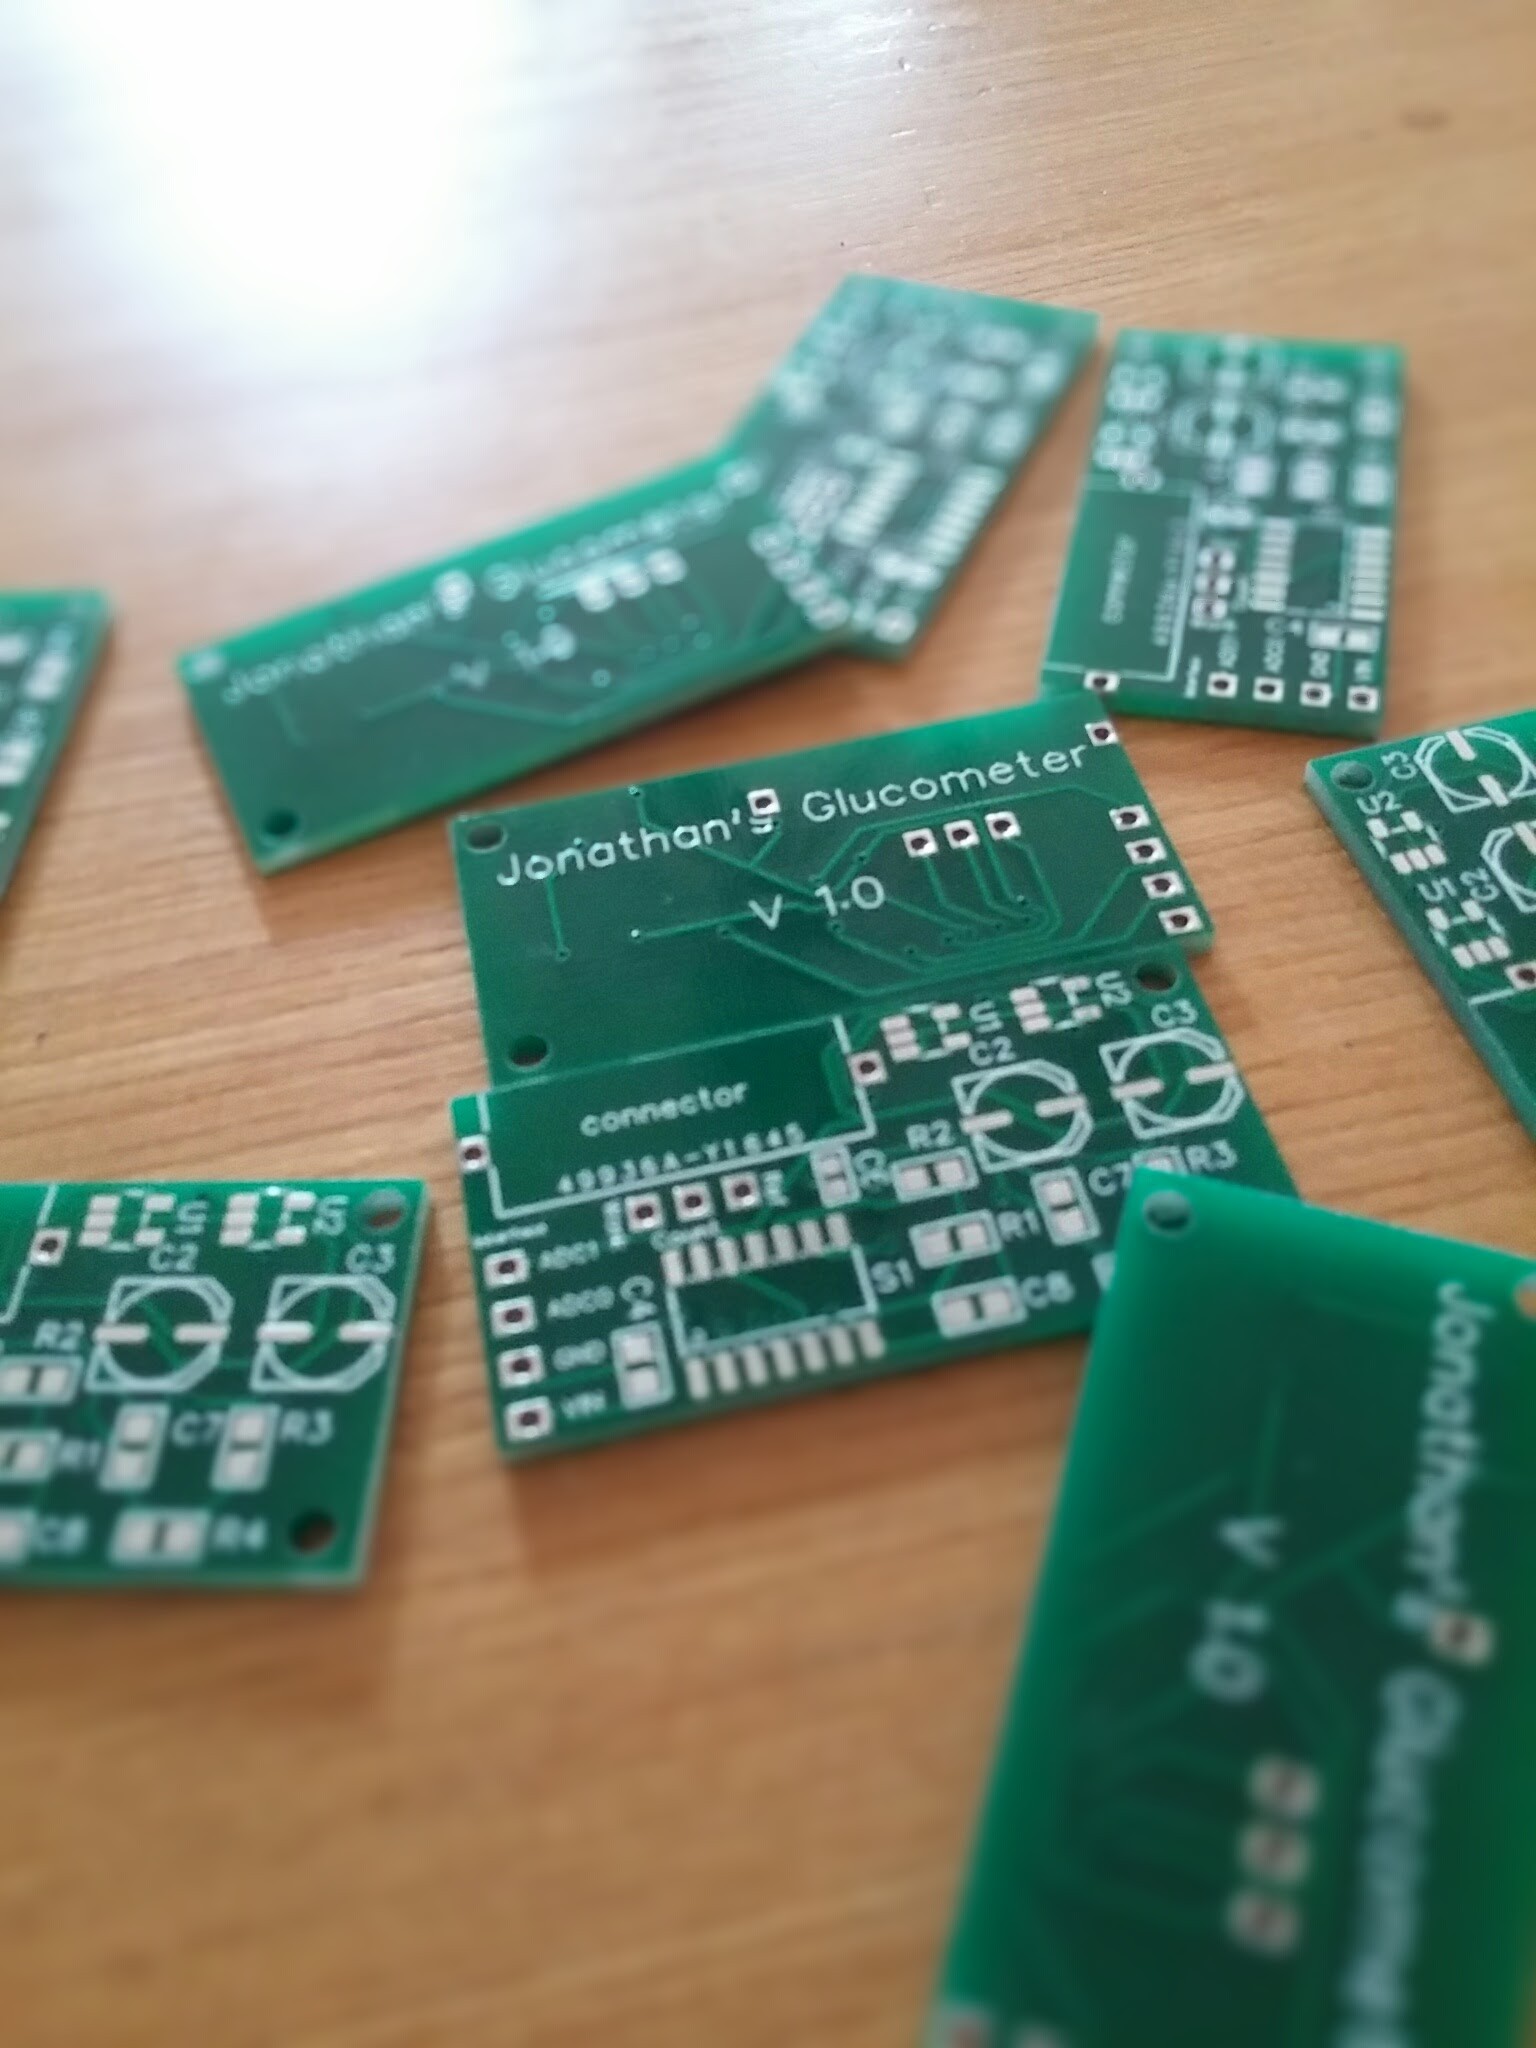
After being diagnosed with type 1 Diabetes in 2015, I began a quest to design and build a glucose meter superior to others with regard to the power and flexibility of its software.
After shuffling through several meters with less computational power than a watch, my doctor gave me the most advanced and only American made glucometer. Its selling feature was that it could divide the number of carbohydrates you put in by a number you set in the settings to "calculate" your insulin dosage.
Although their product's feature is lame, and the meter has countless design flaws I won't get into here, the manufacturers were on to the right idea.
My goal for this project is to create a small, handheld meter that can do the following:
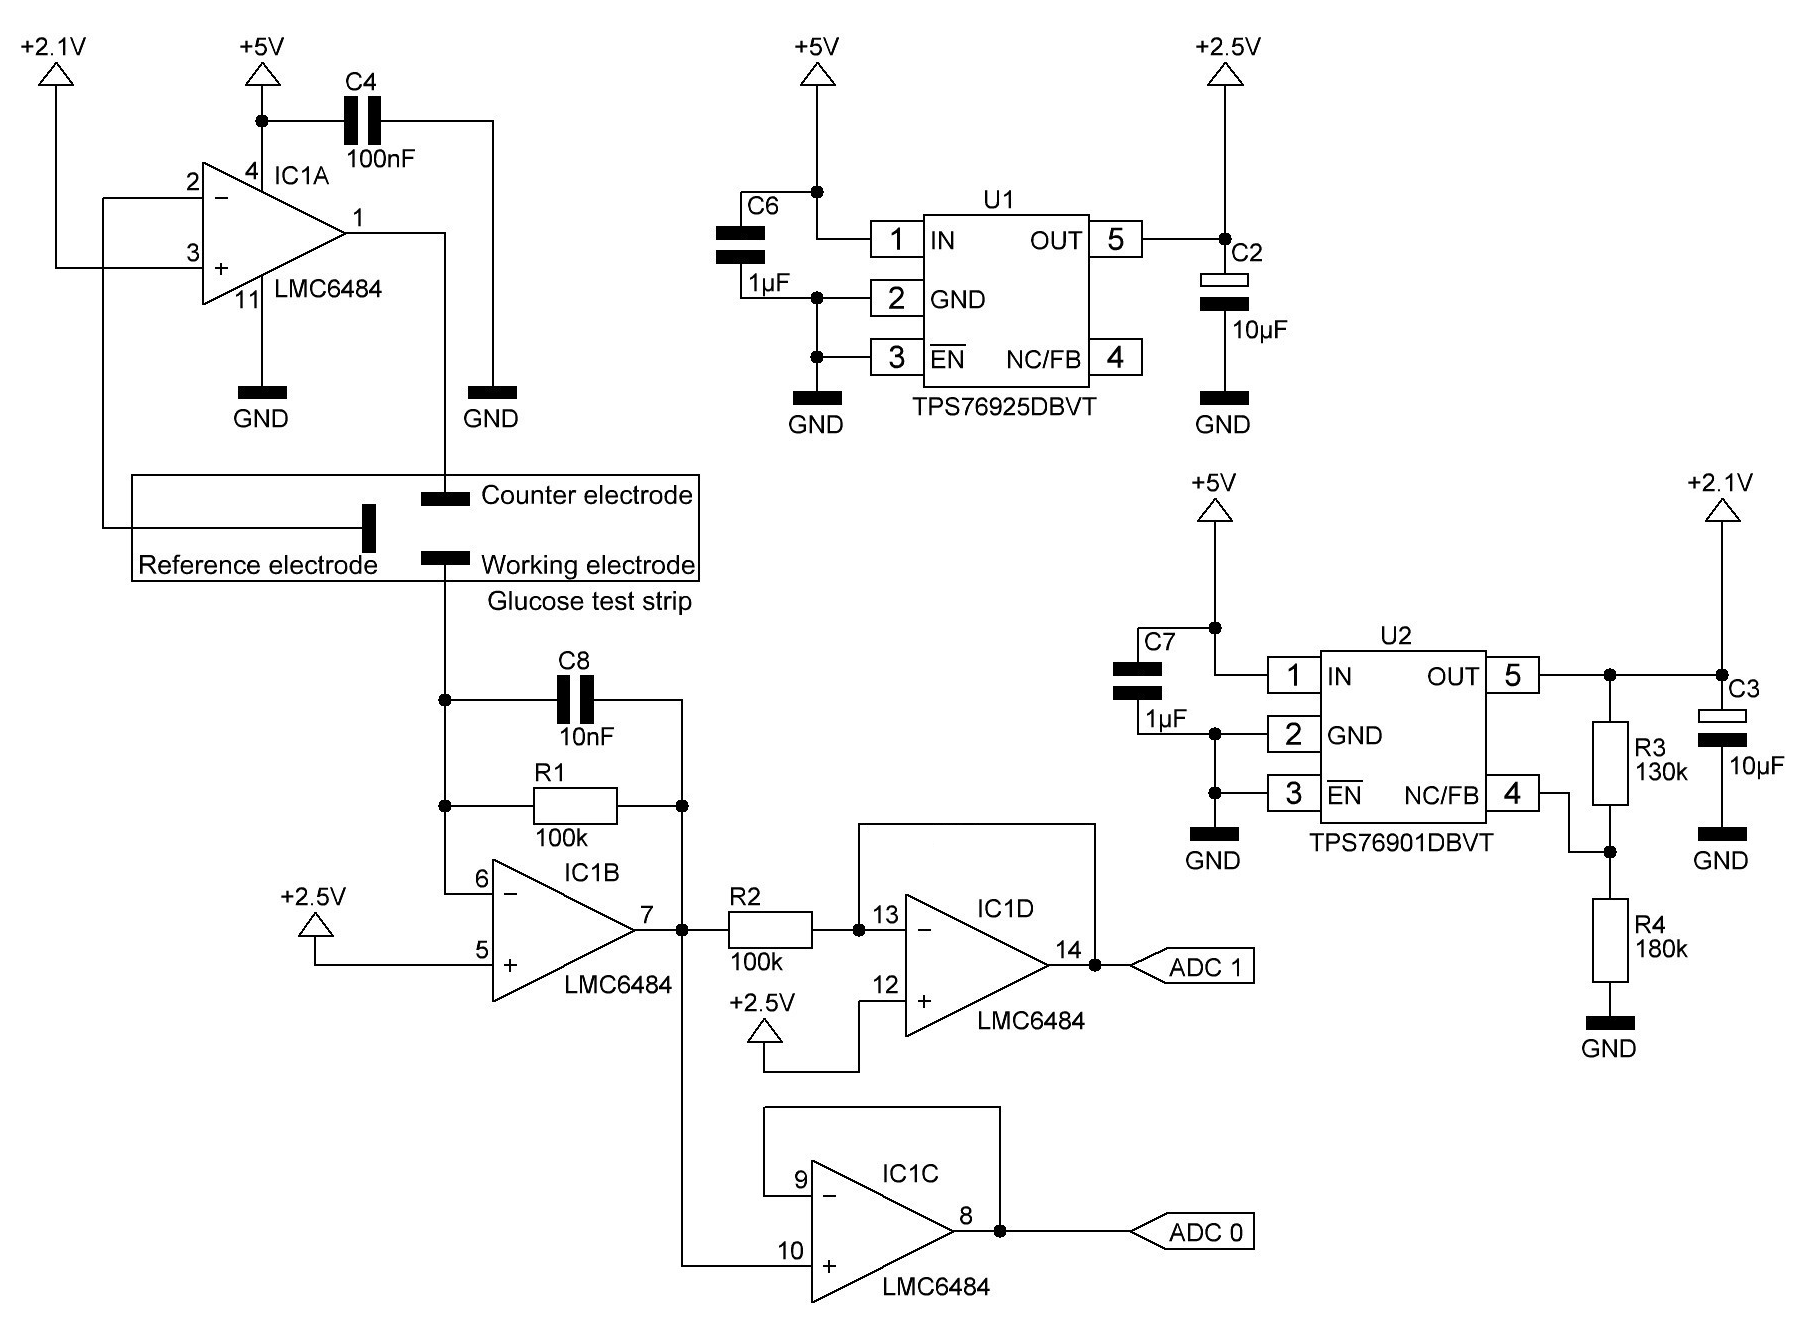
- Accurately test concentration of glucose in a sample
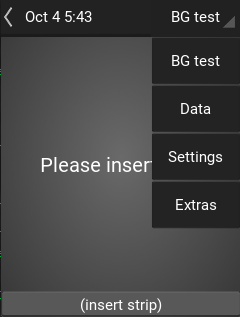
- Be easy to use
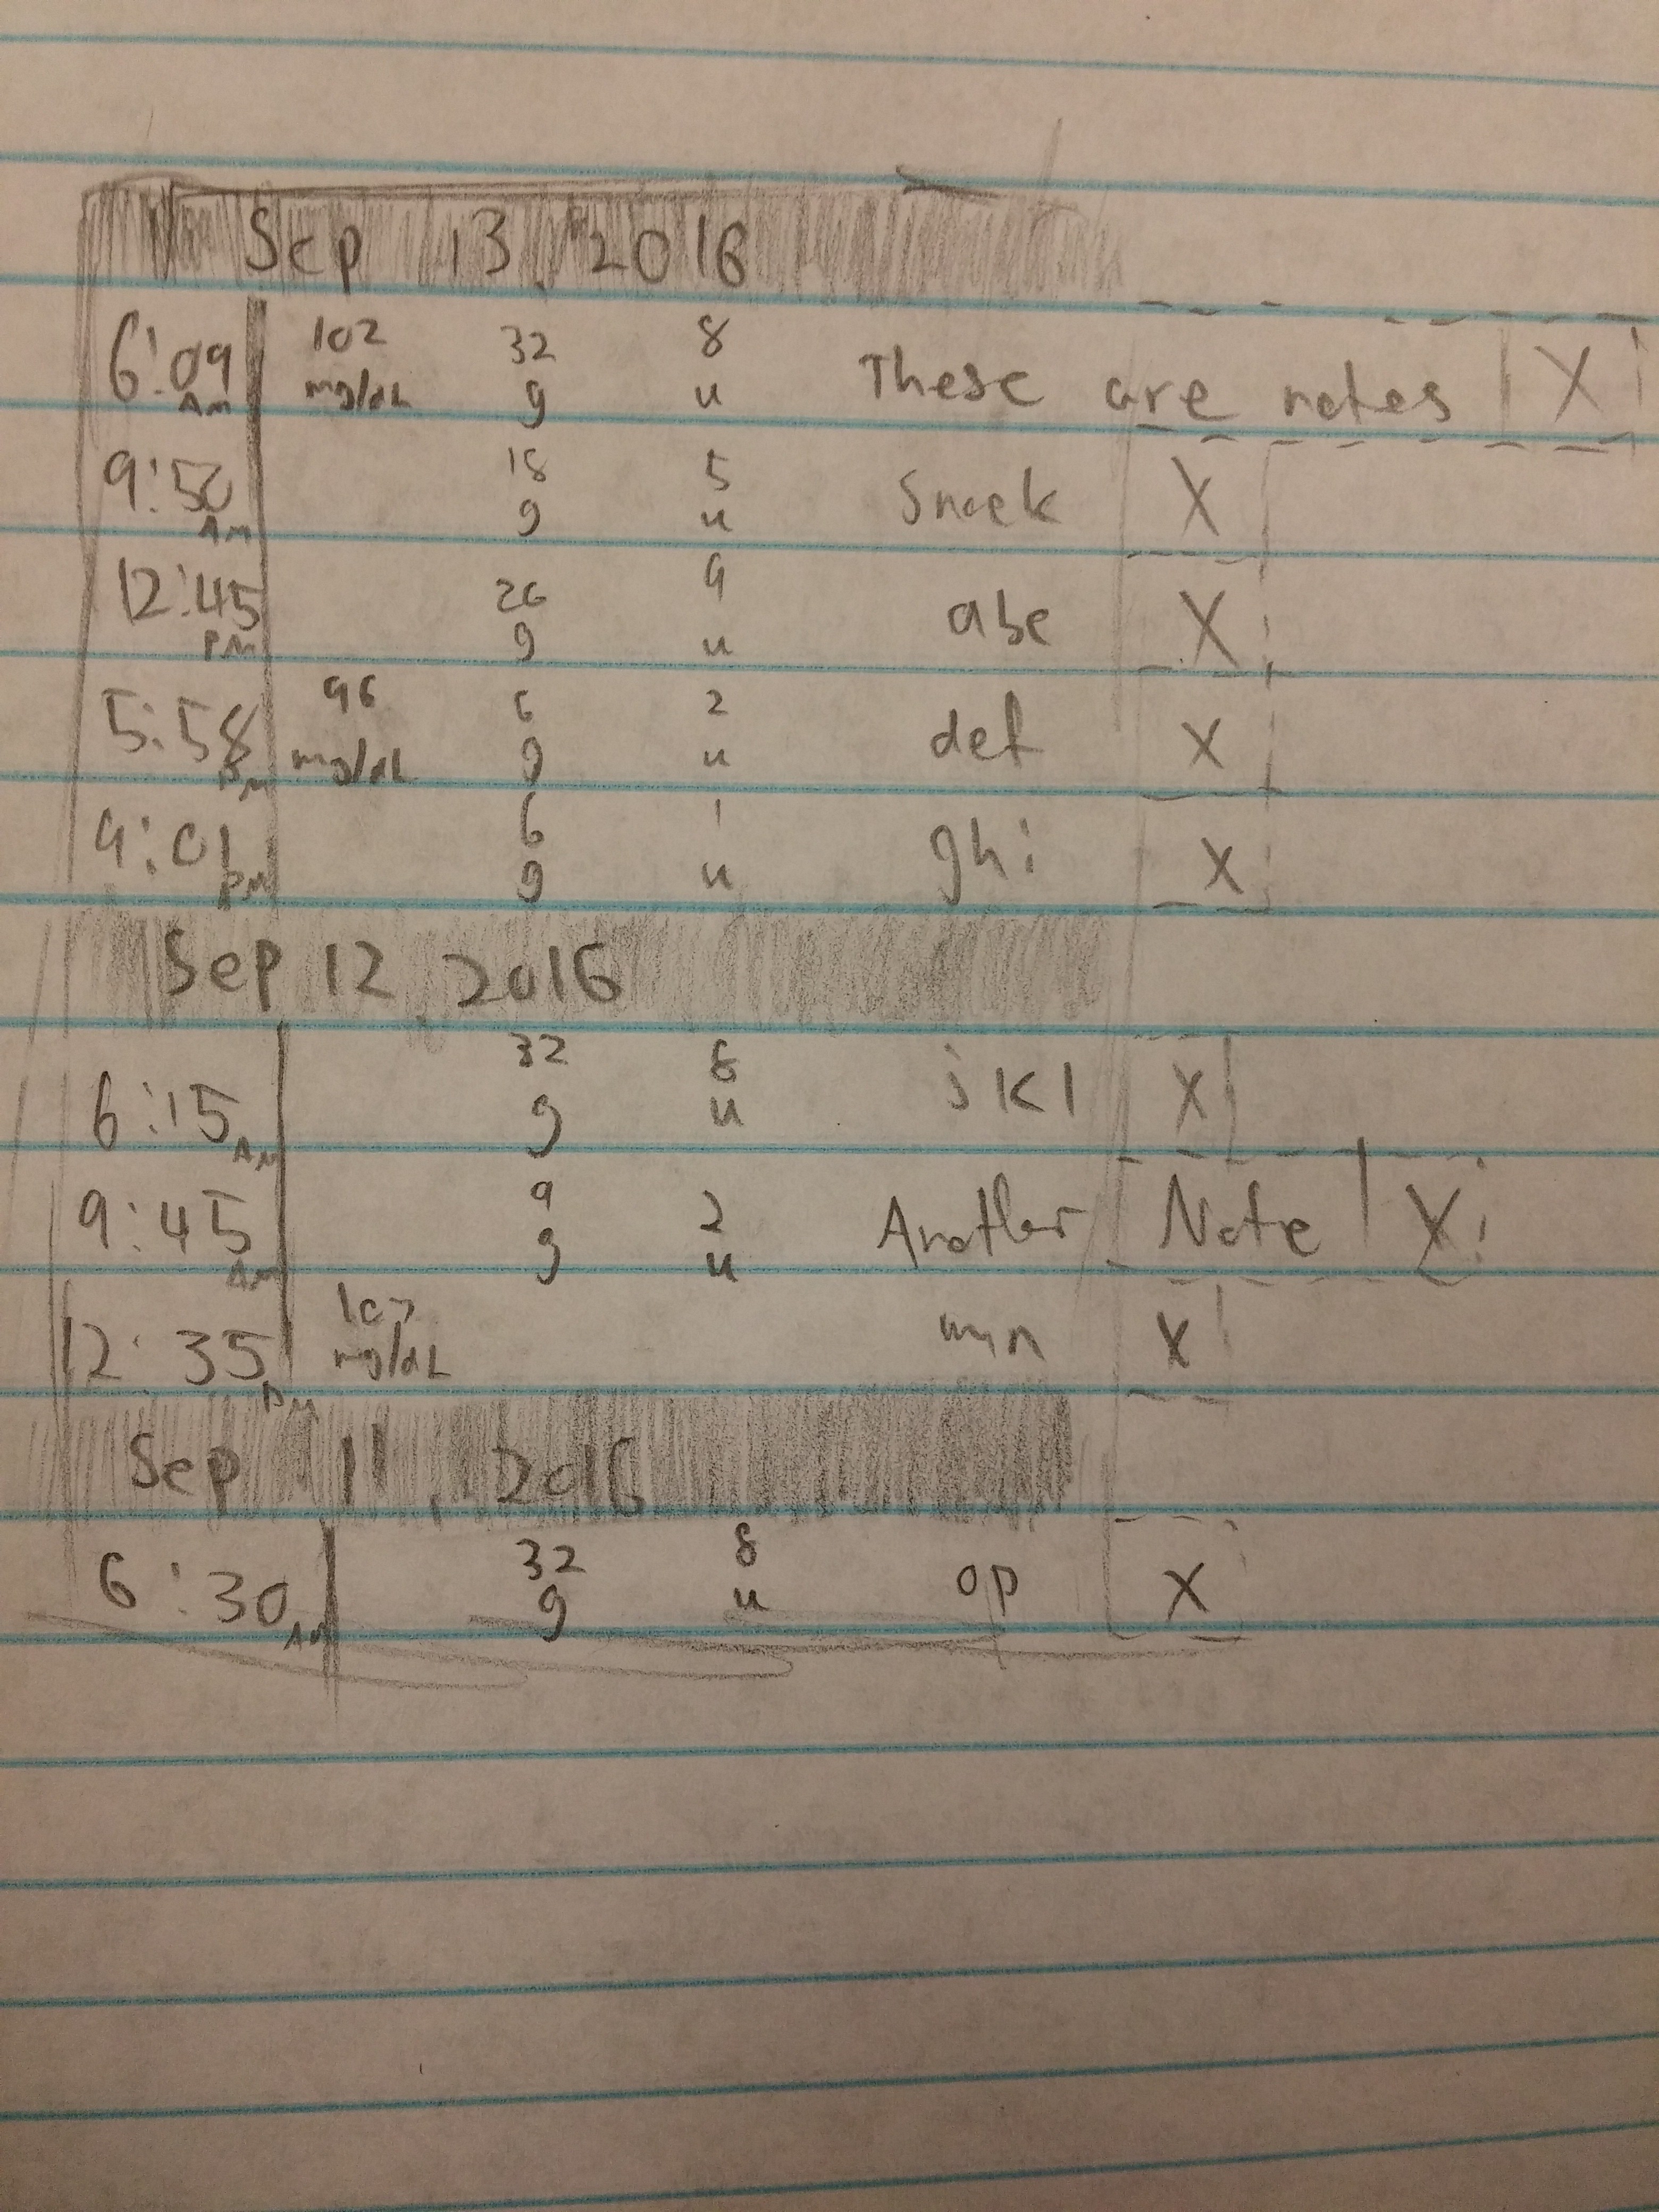
- Record data of bG, insulin, carbs, and other nutritional information
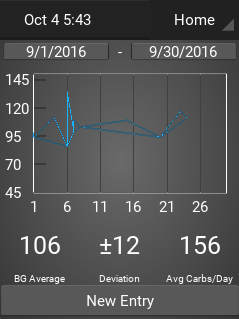
- Format, export, and display data in a useful way
And future goals include more ambitious things:
- Calculate effects of fat and protein in the food on the individual
- Calculate a close prediction of bG at any time based on conditions
The GitHub repository for the glucometer can be found here.
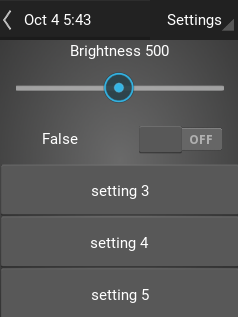
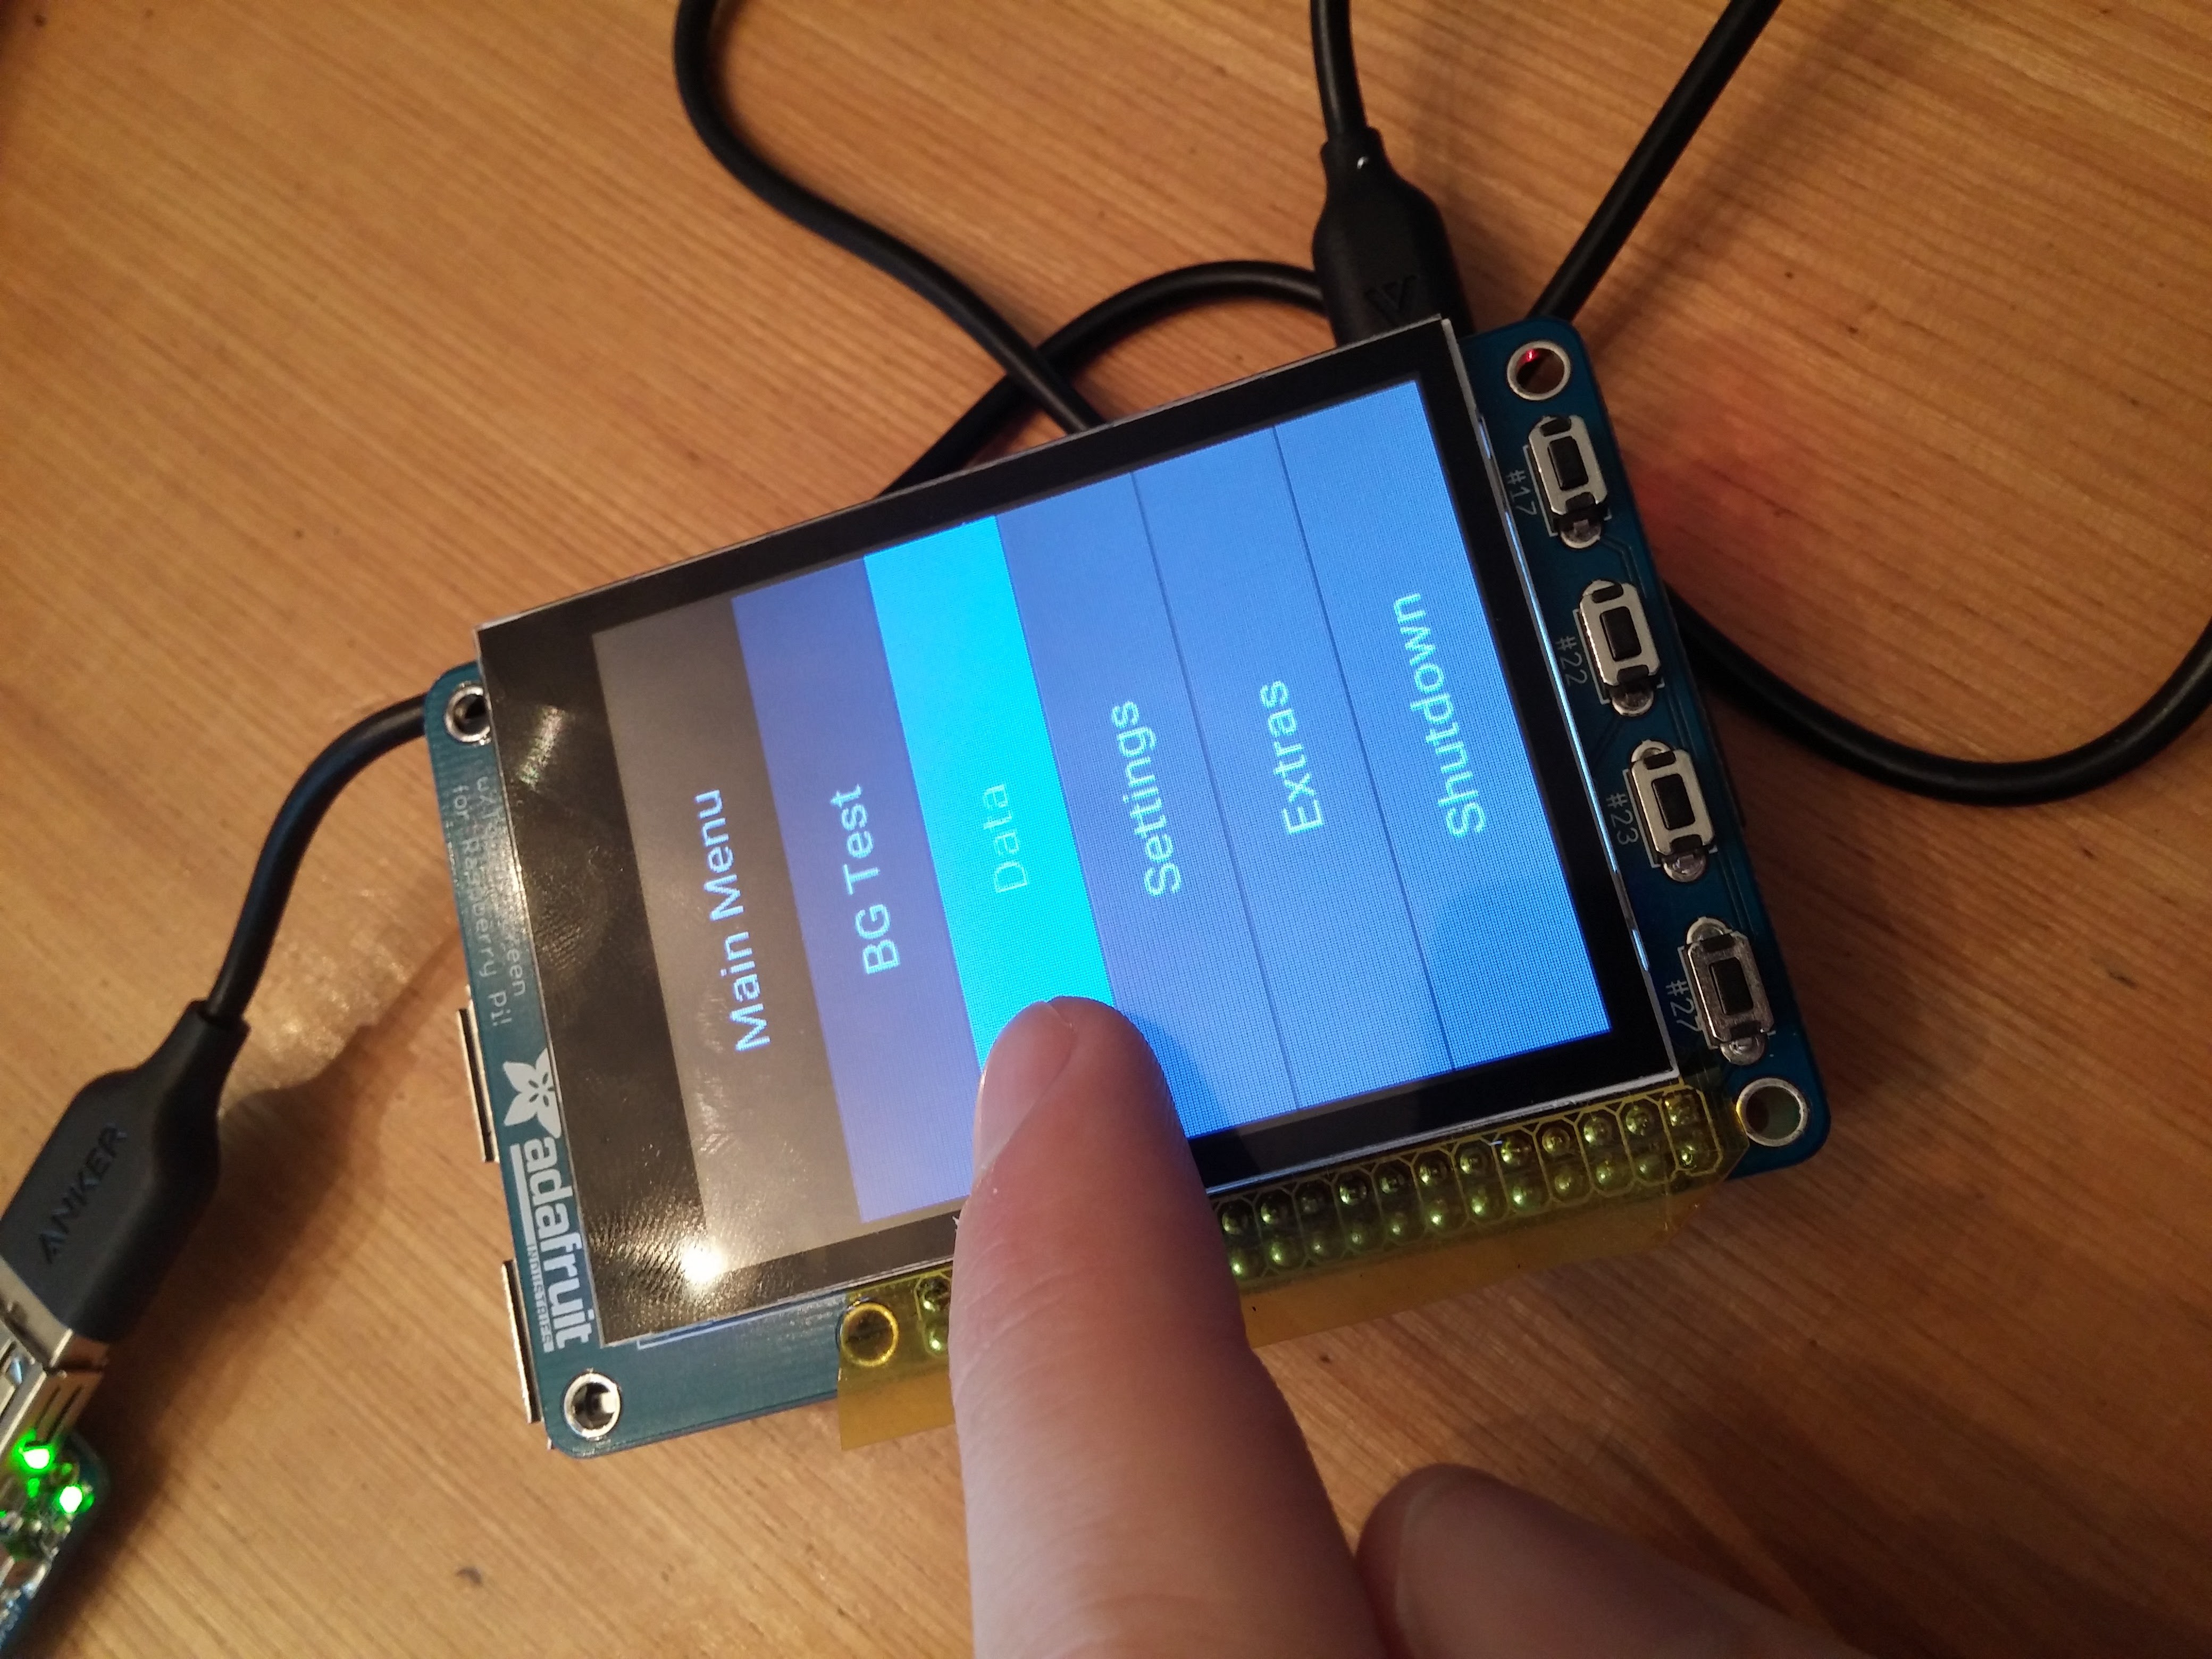
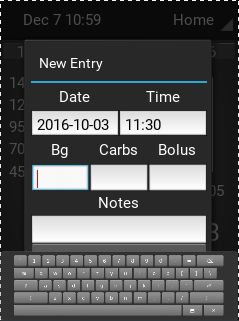 too small (and qwerty)
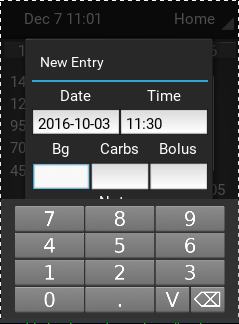 just right
 Other than these things, there is not much more to see on the software side of things.
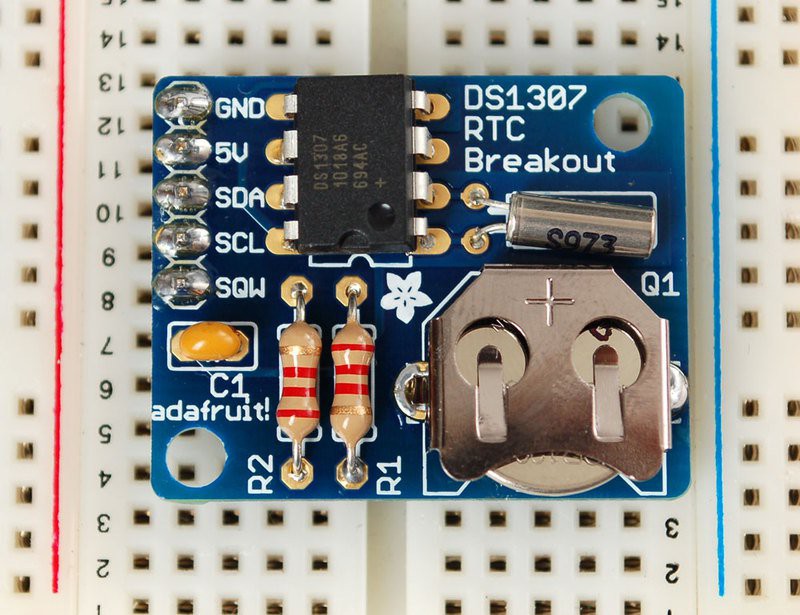


 On a related note, as a follow-up on


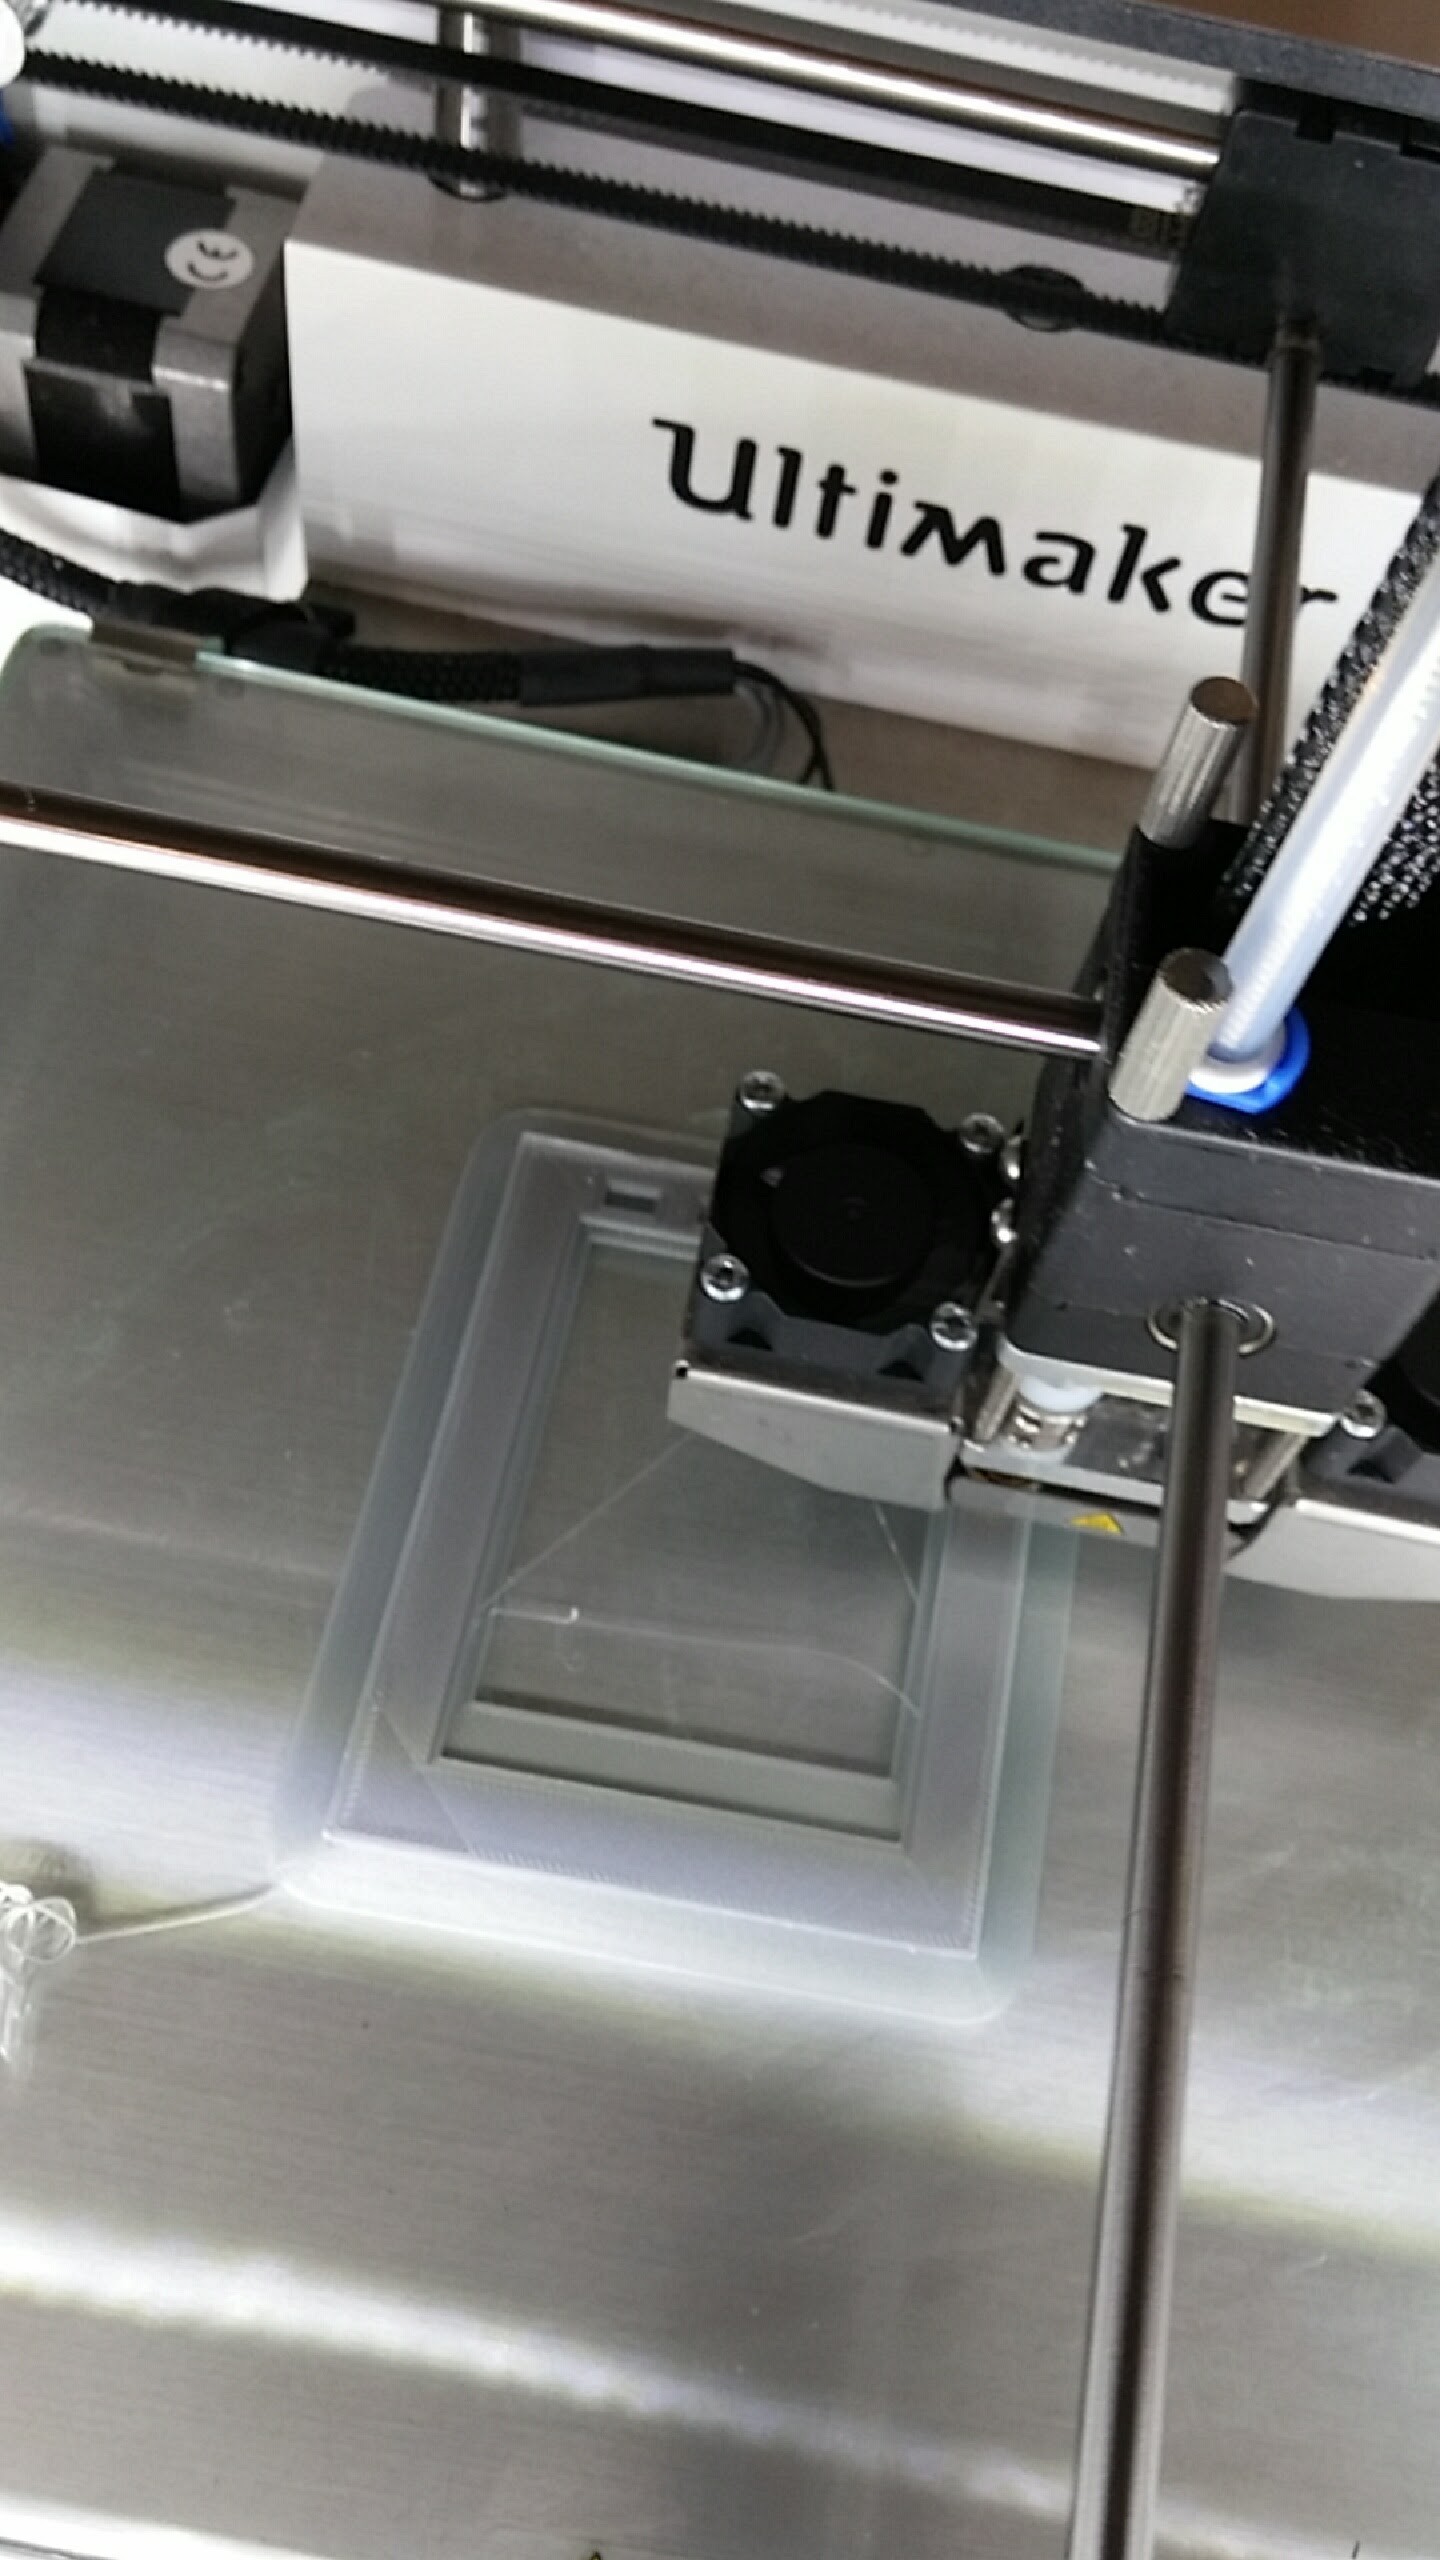
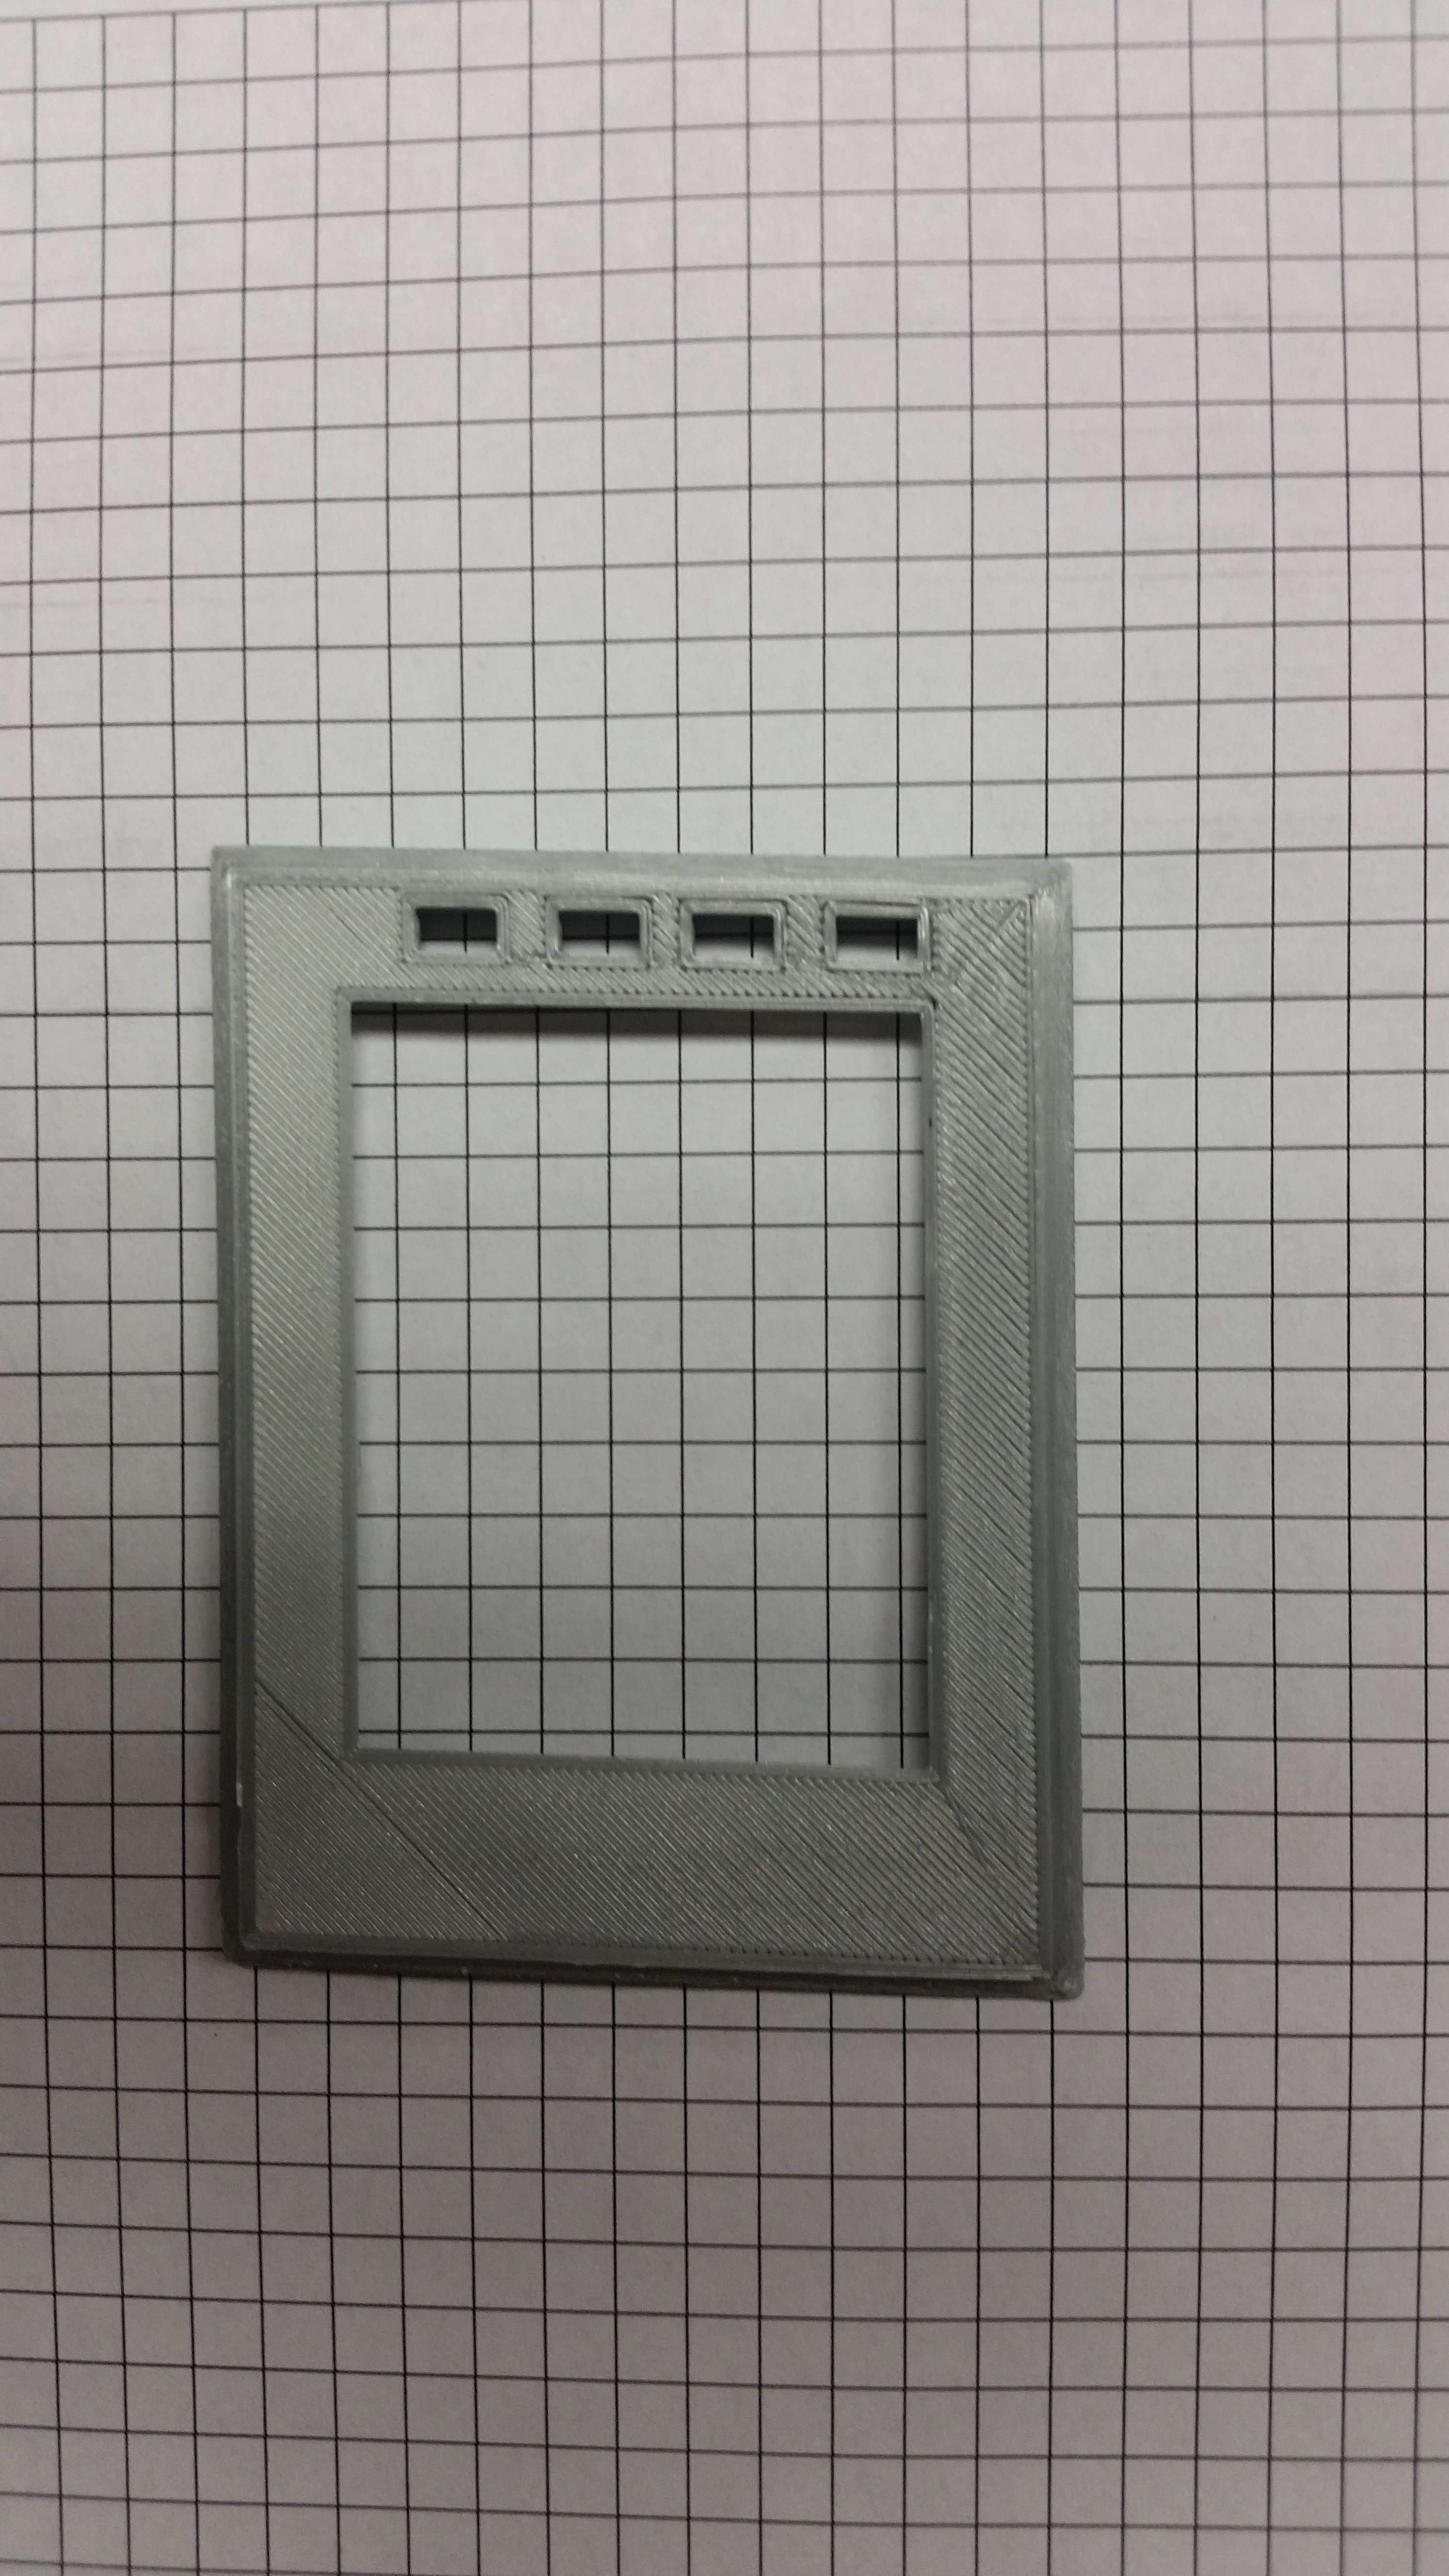
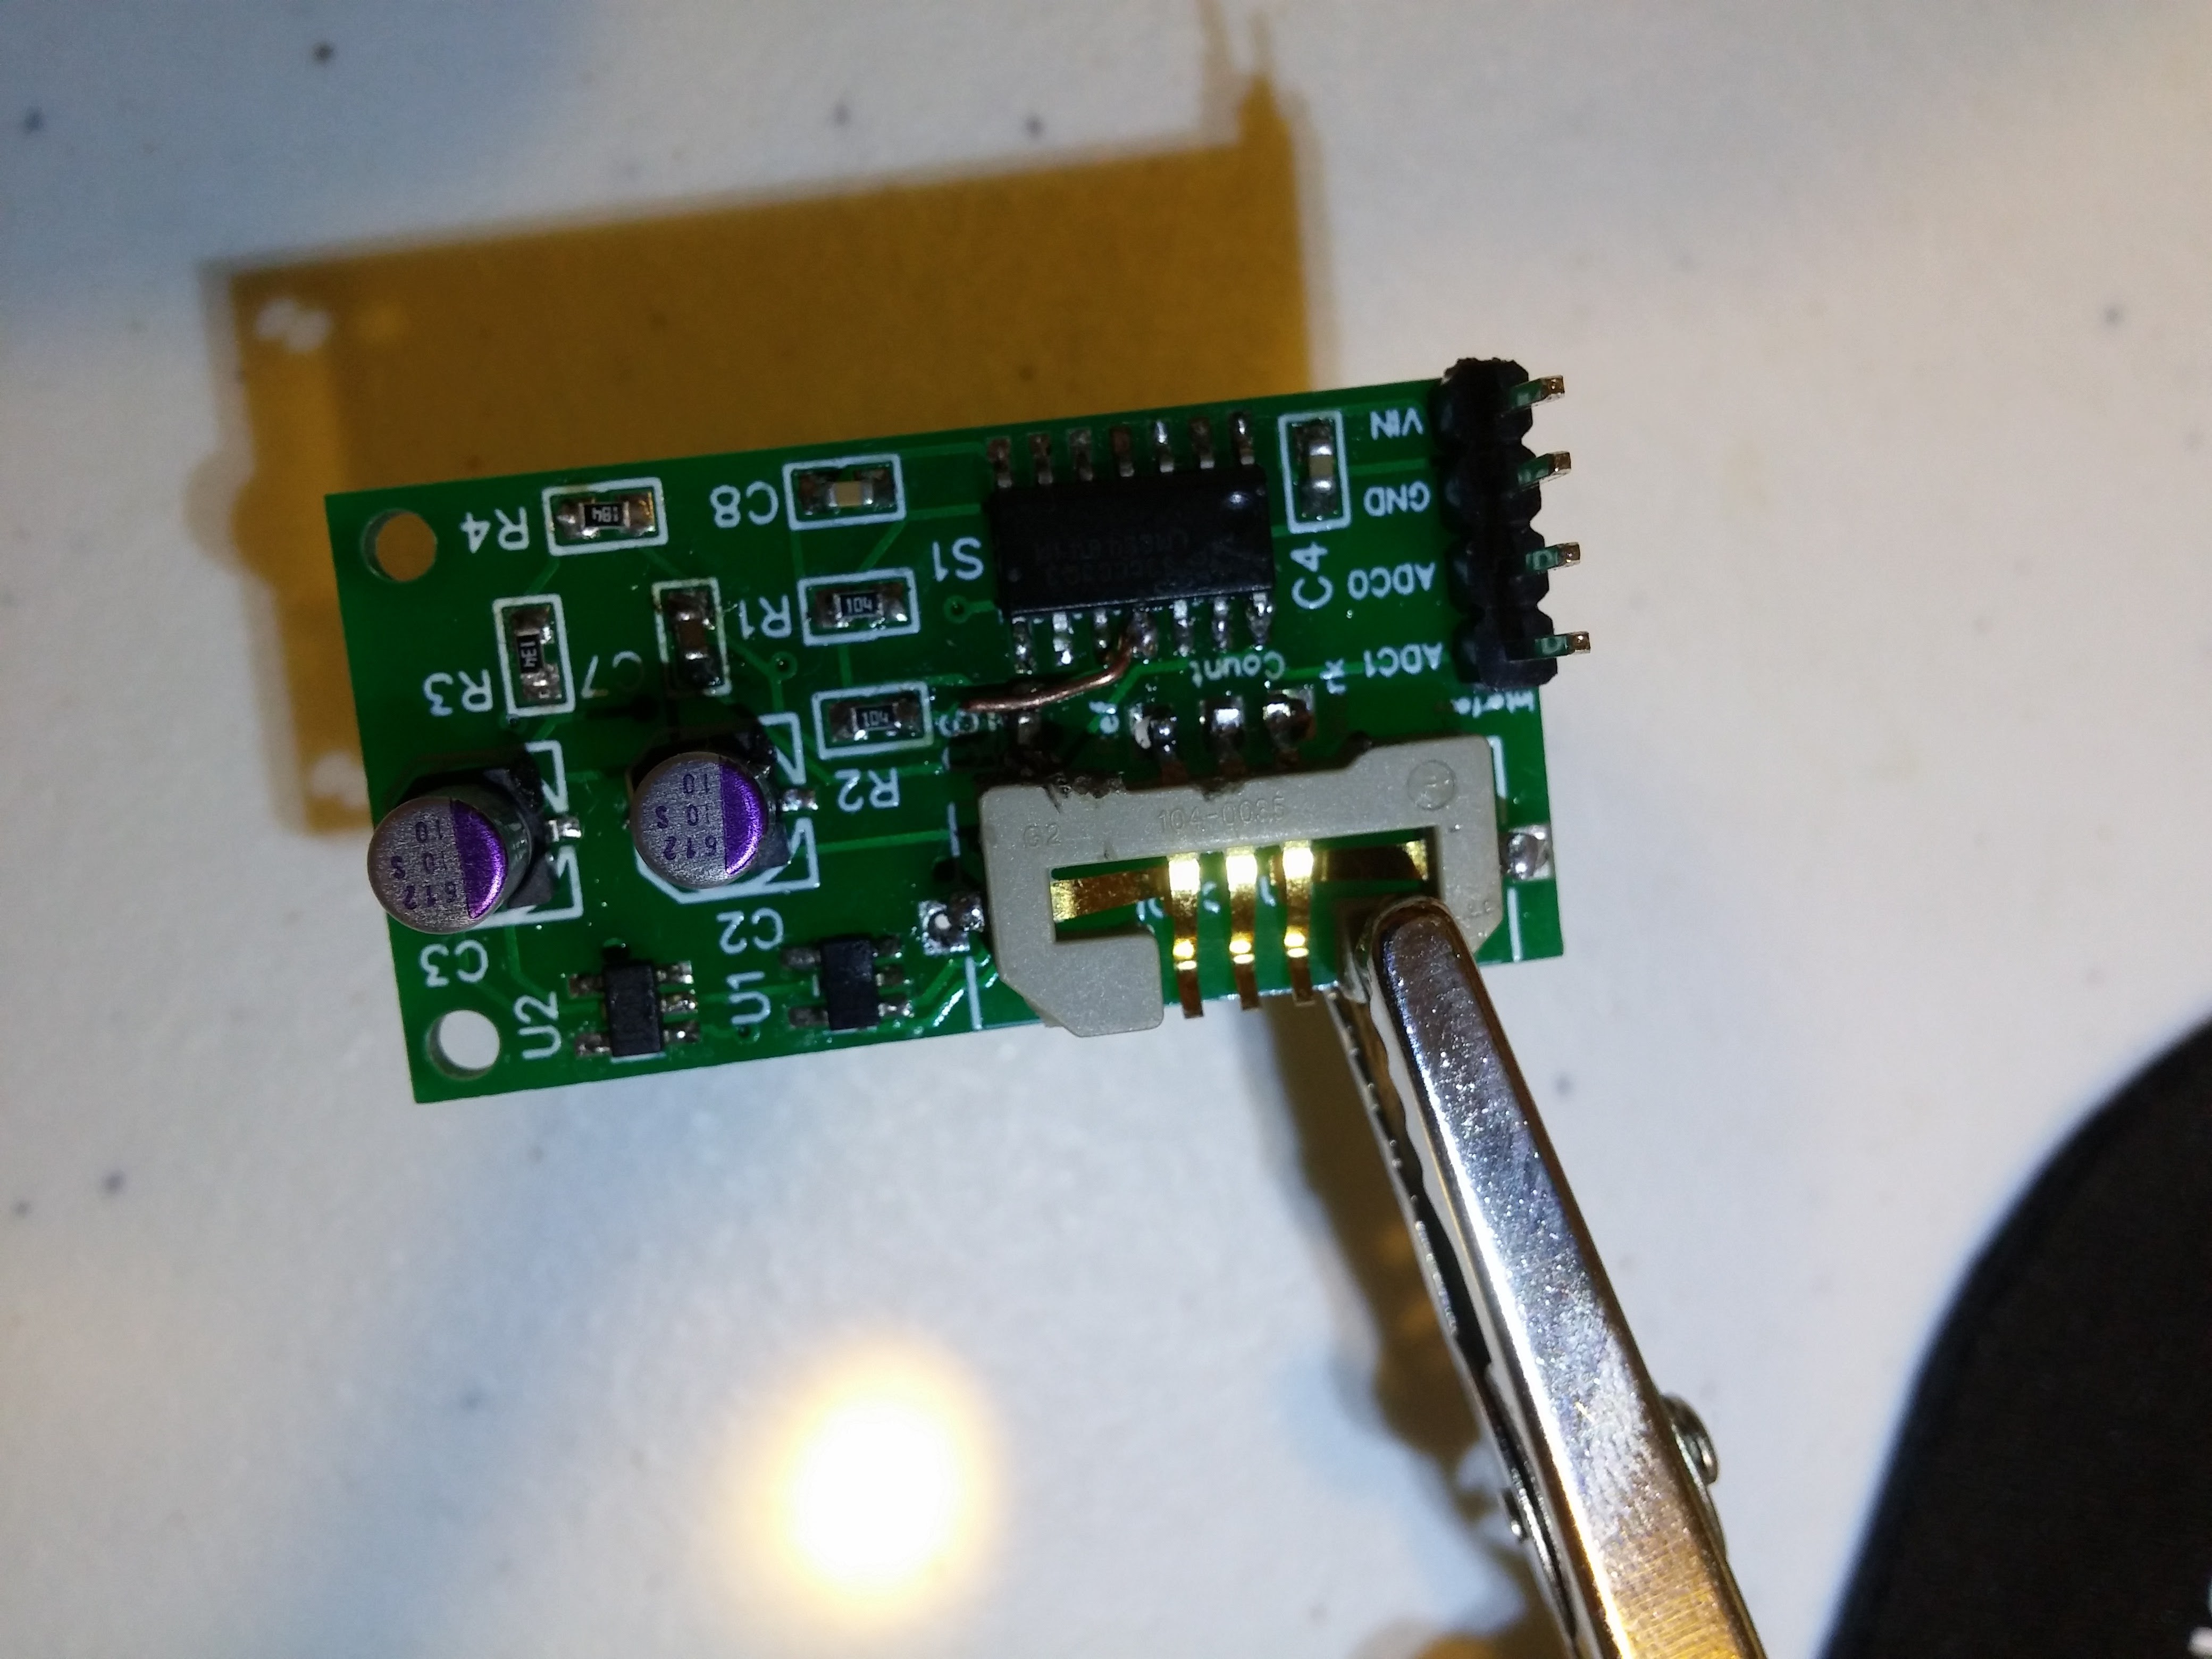
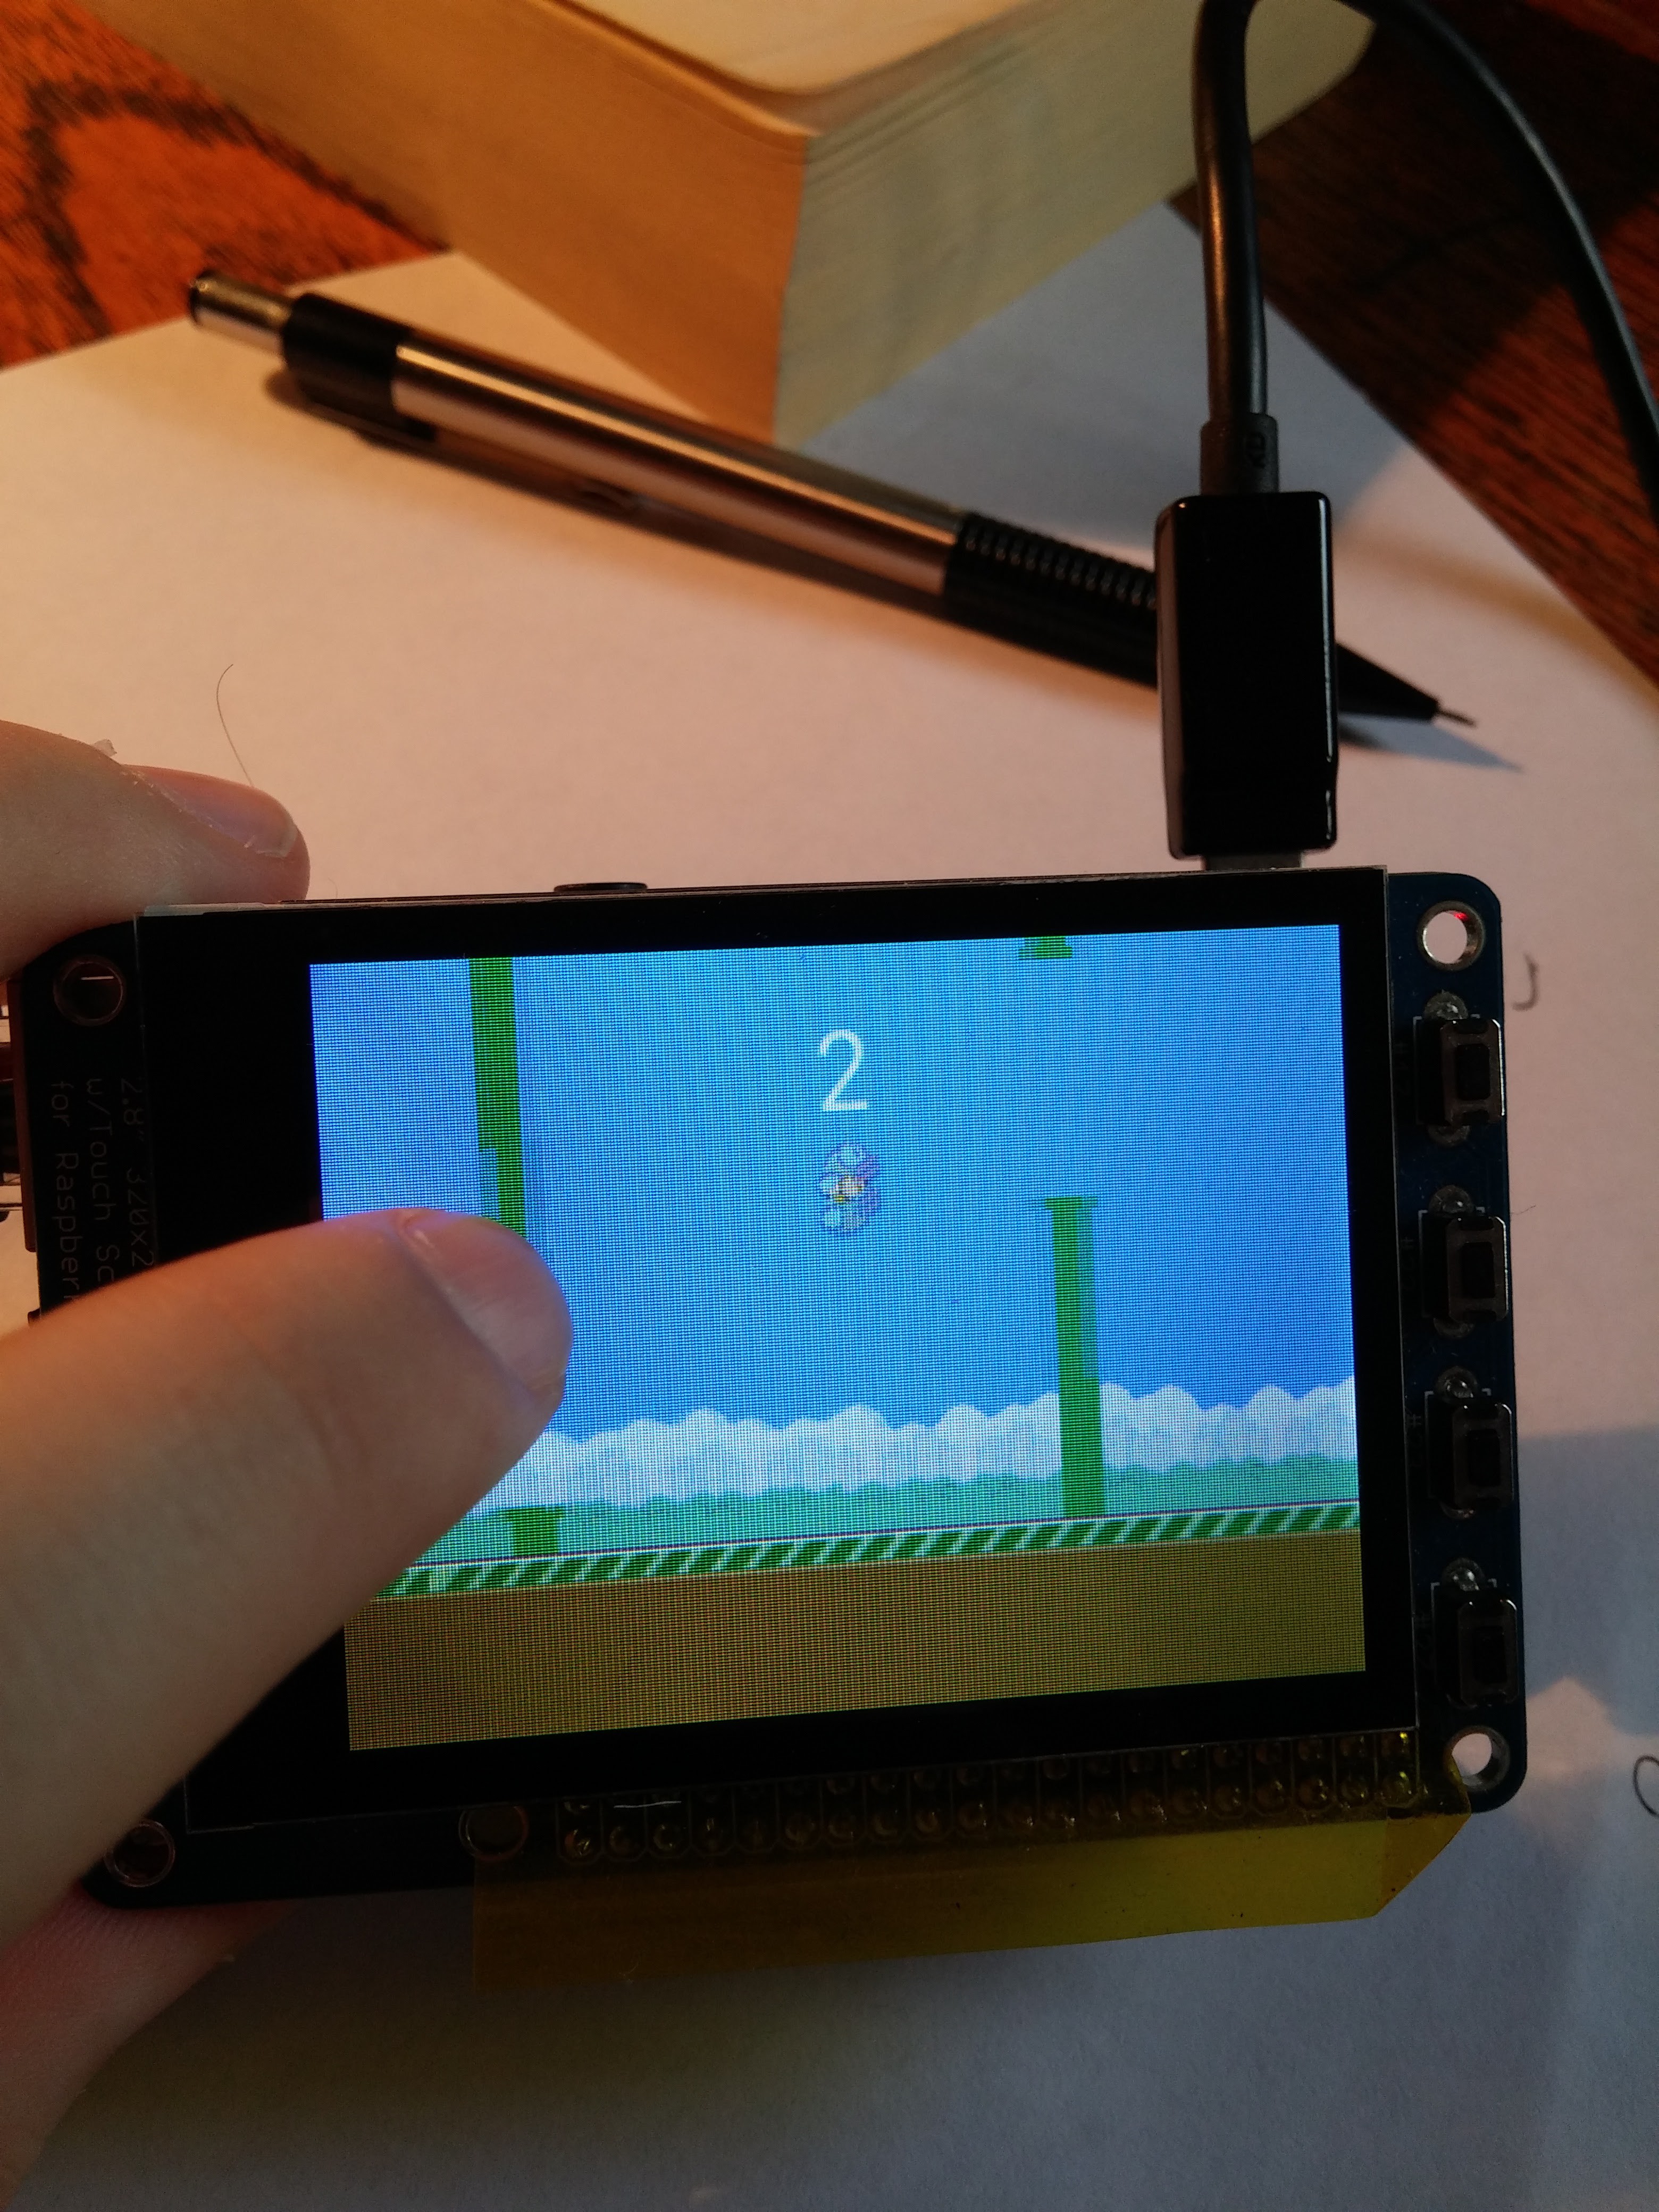 That seemed to work well, but I wanted it rotated so the buttons would be on the bottom, and it would be more consistent with traditional meters.
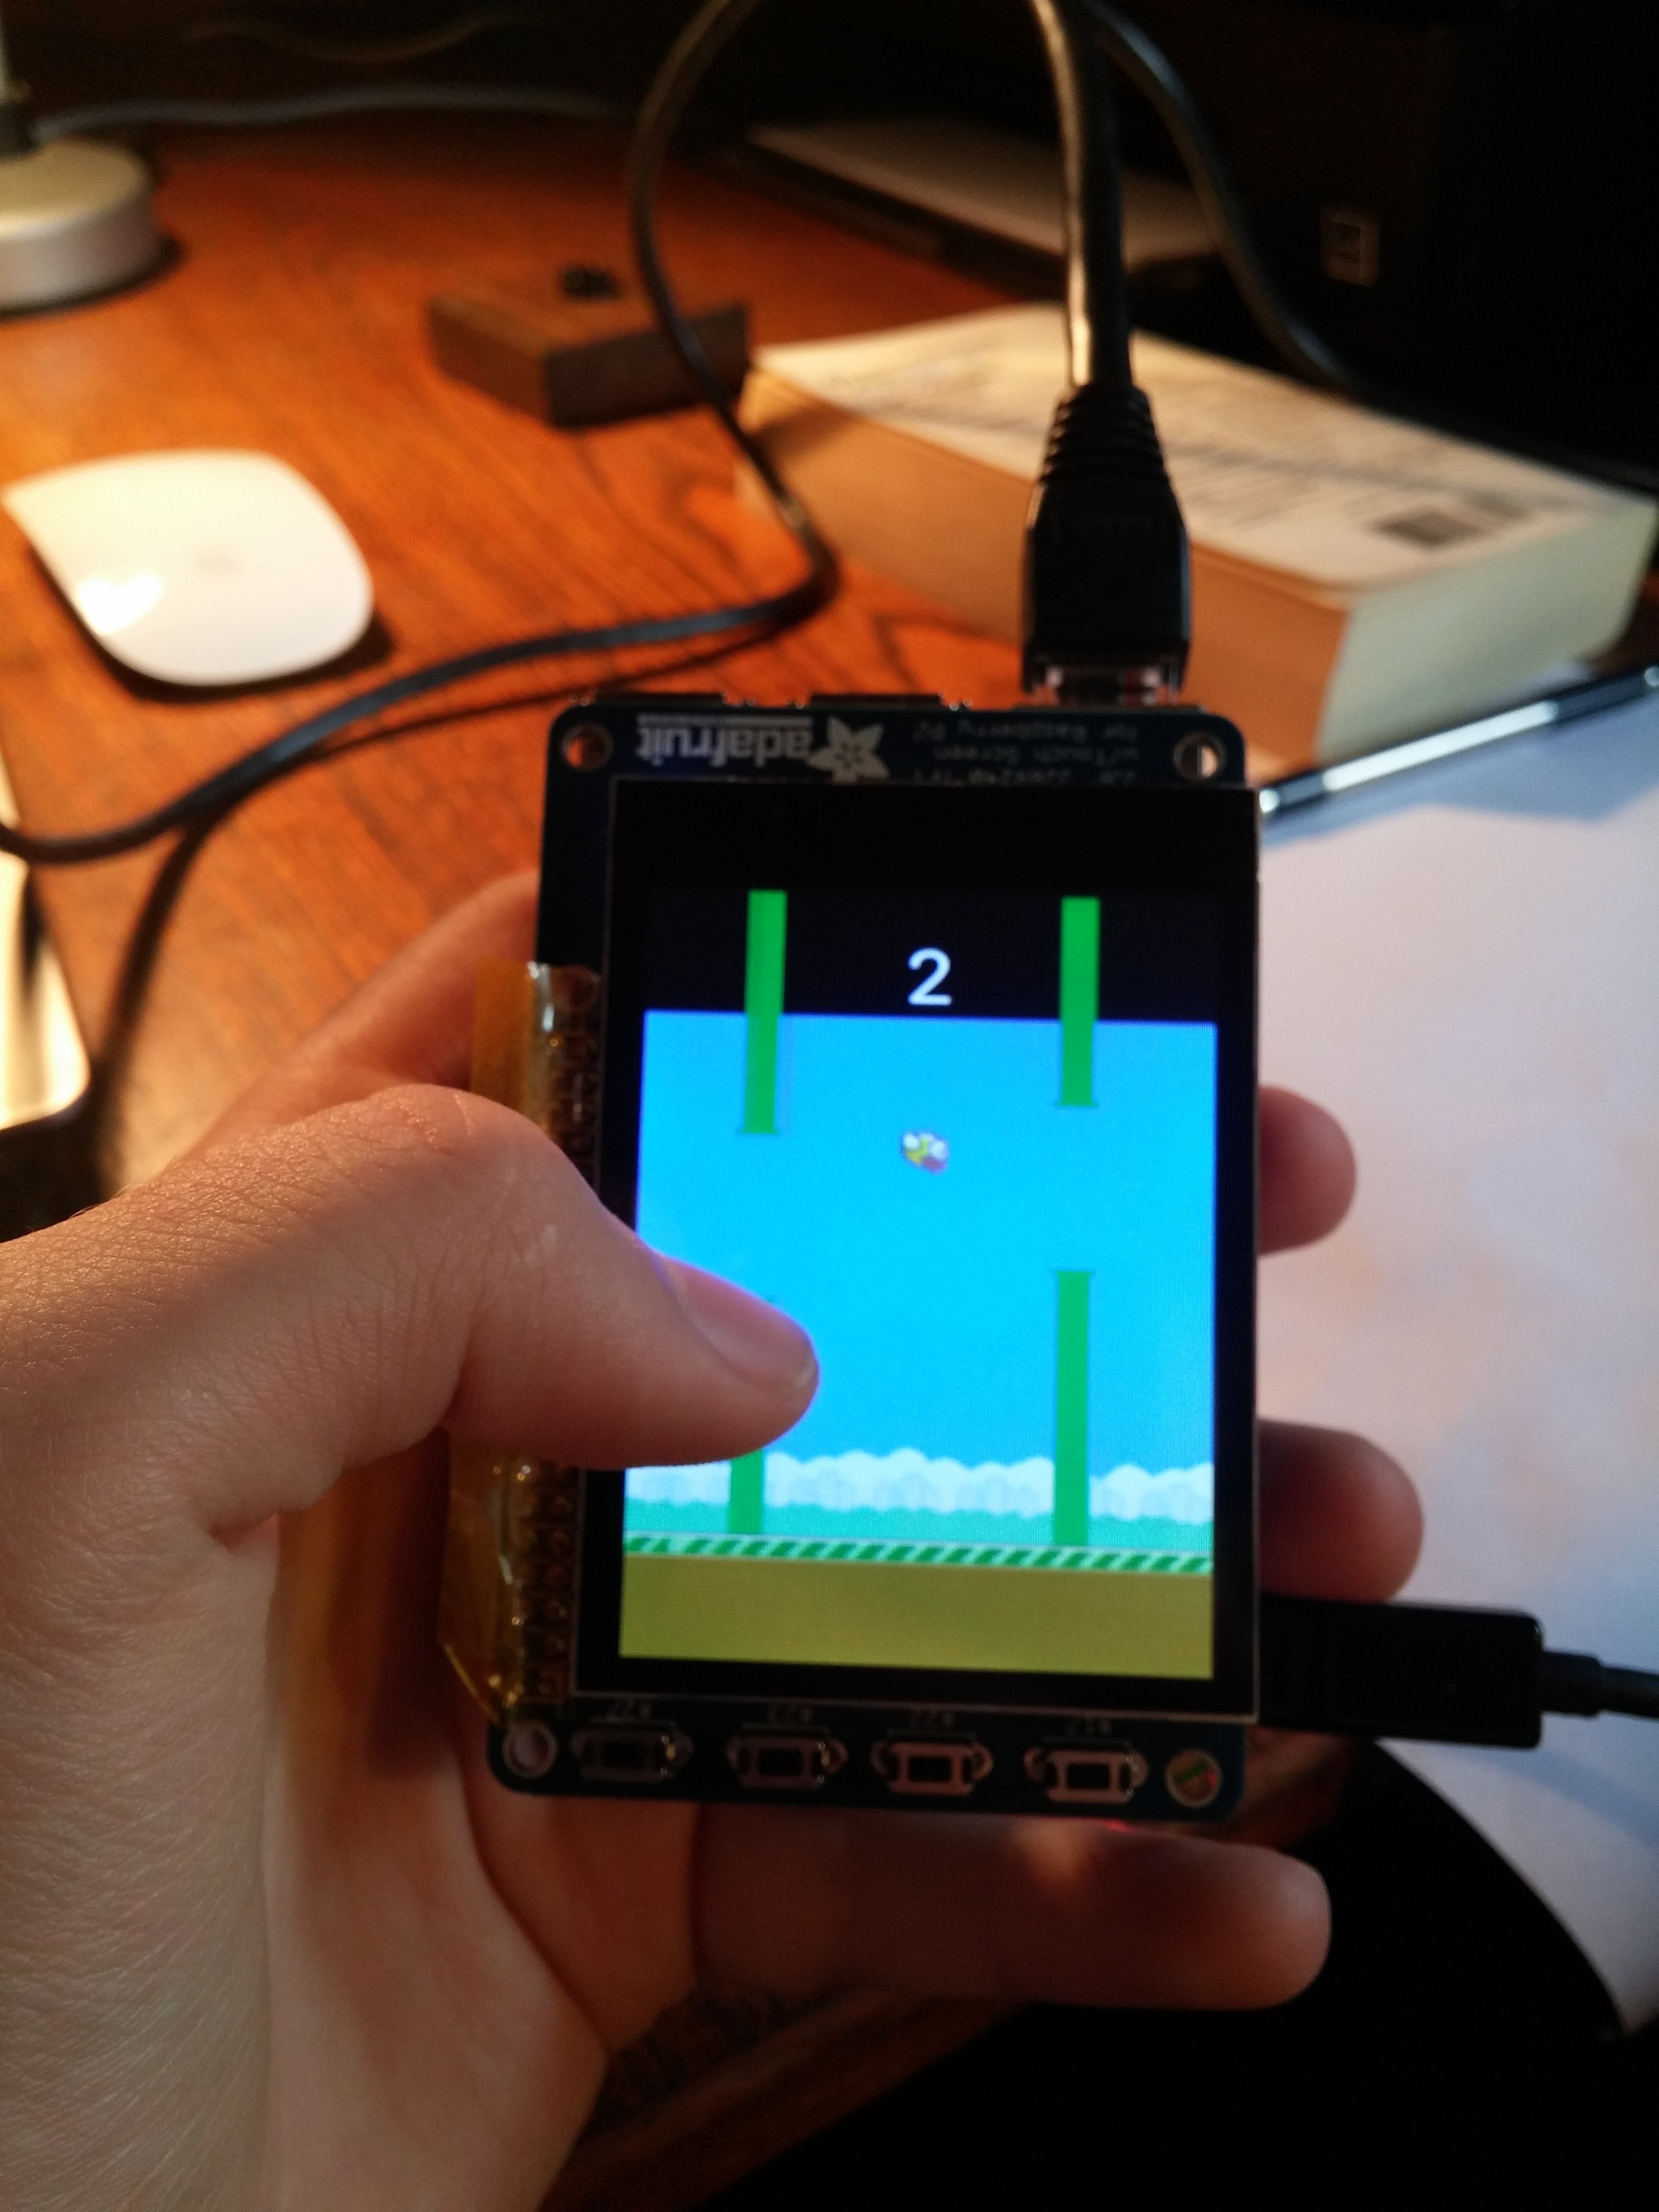
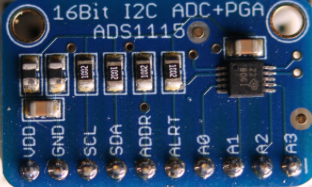
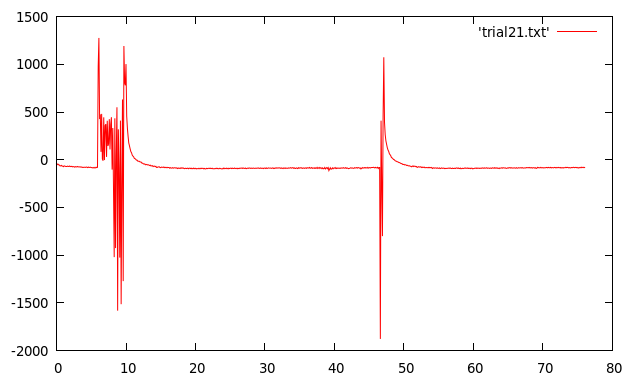
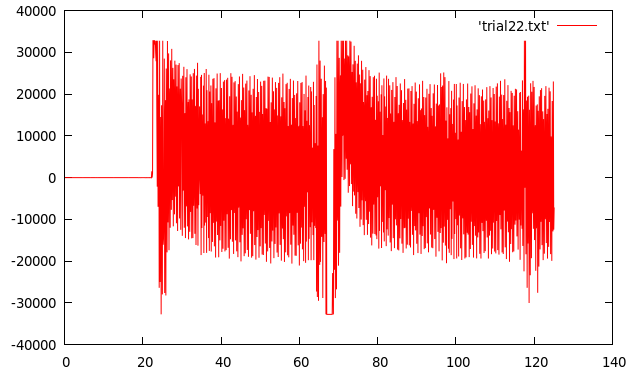
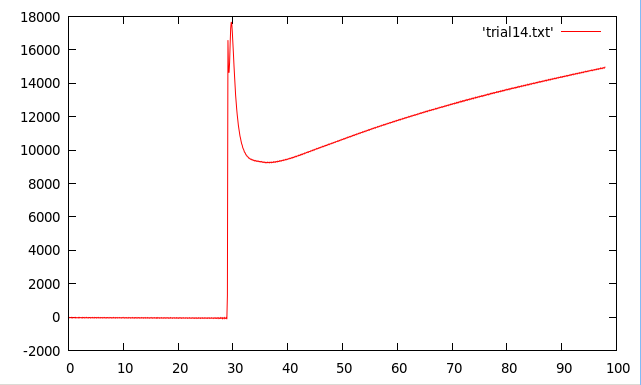
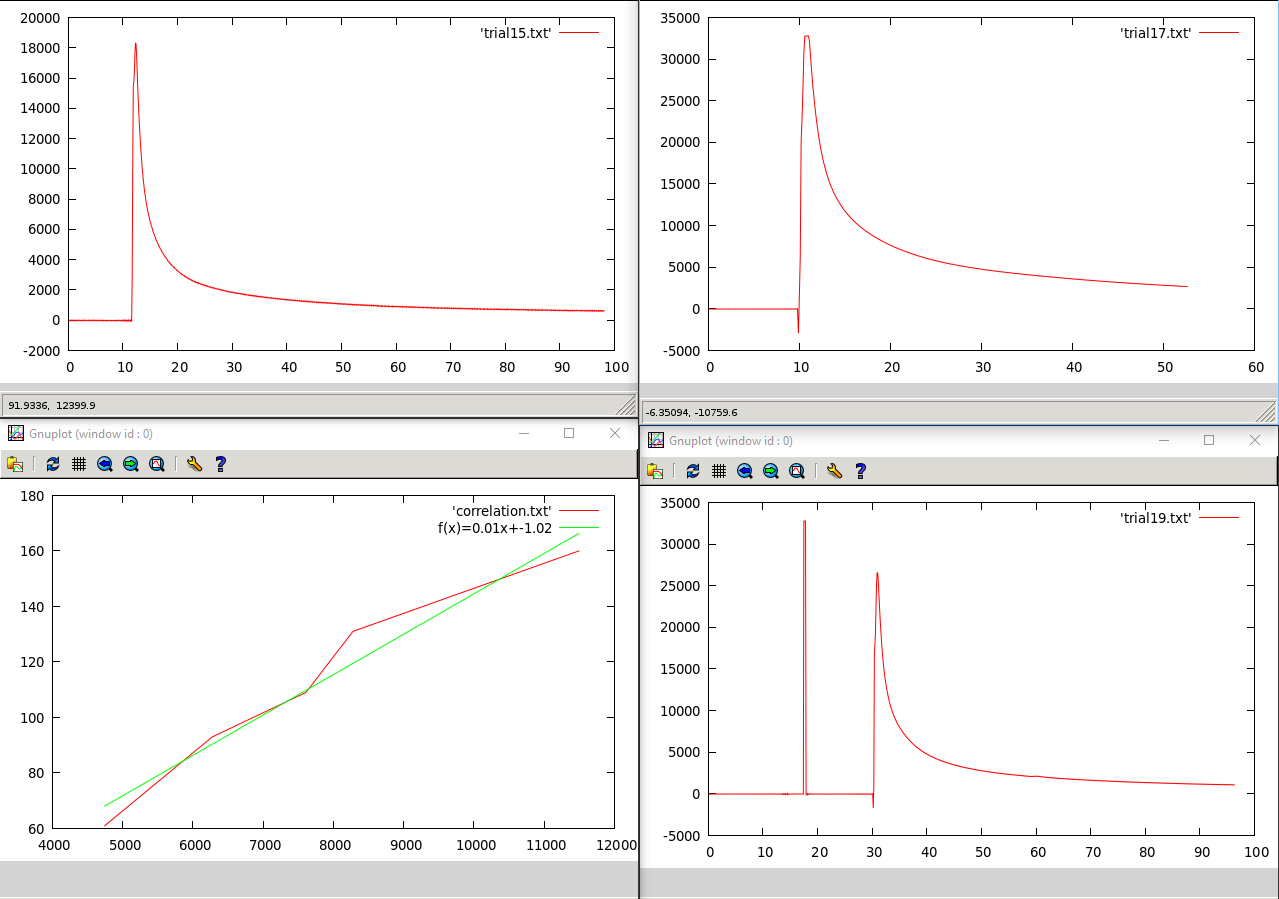
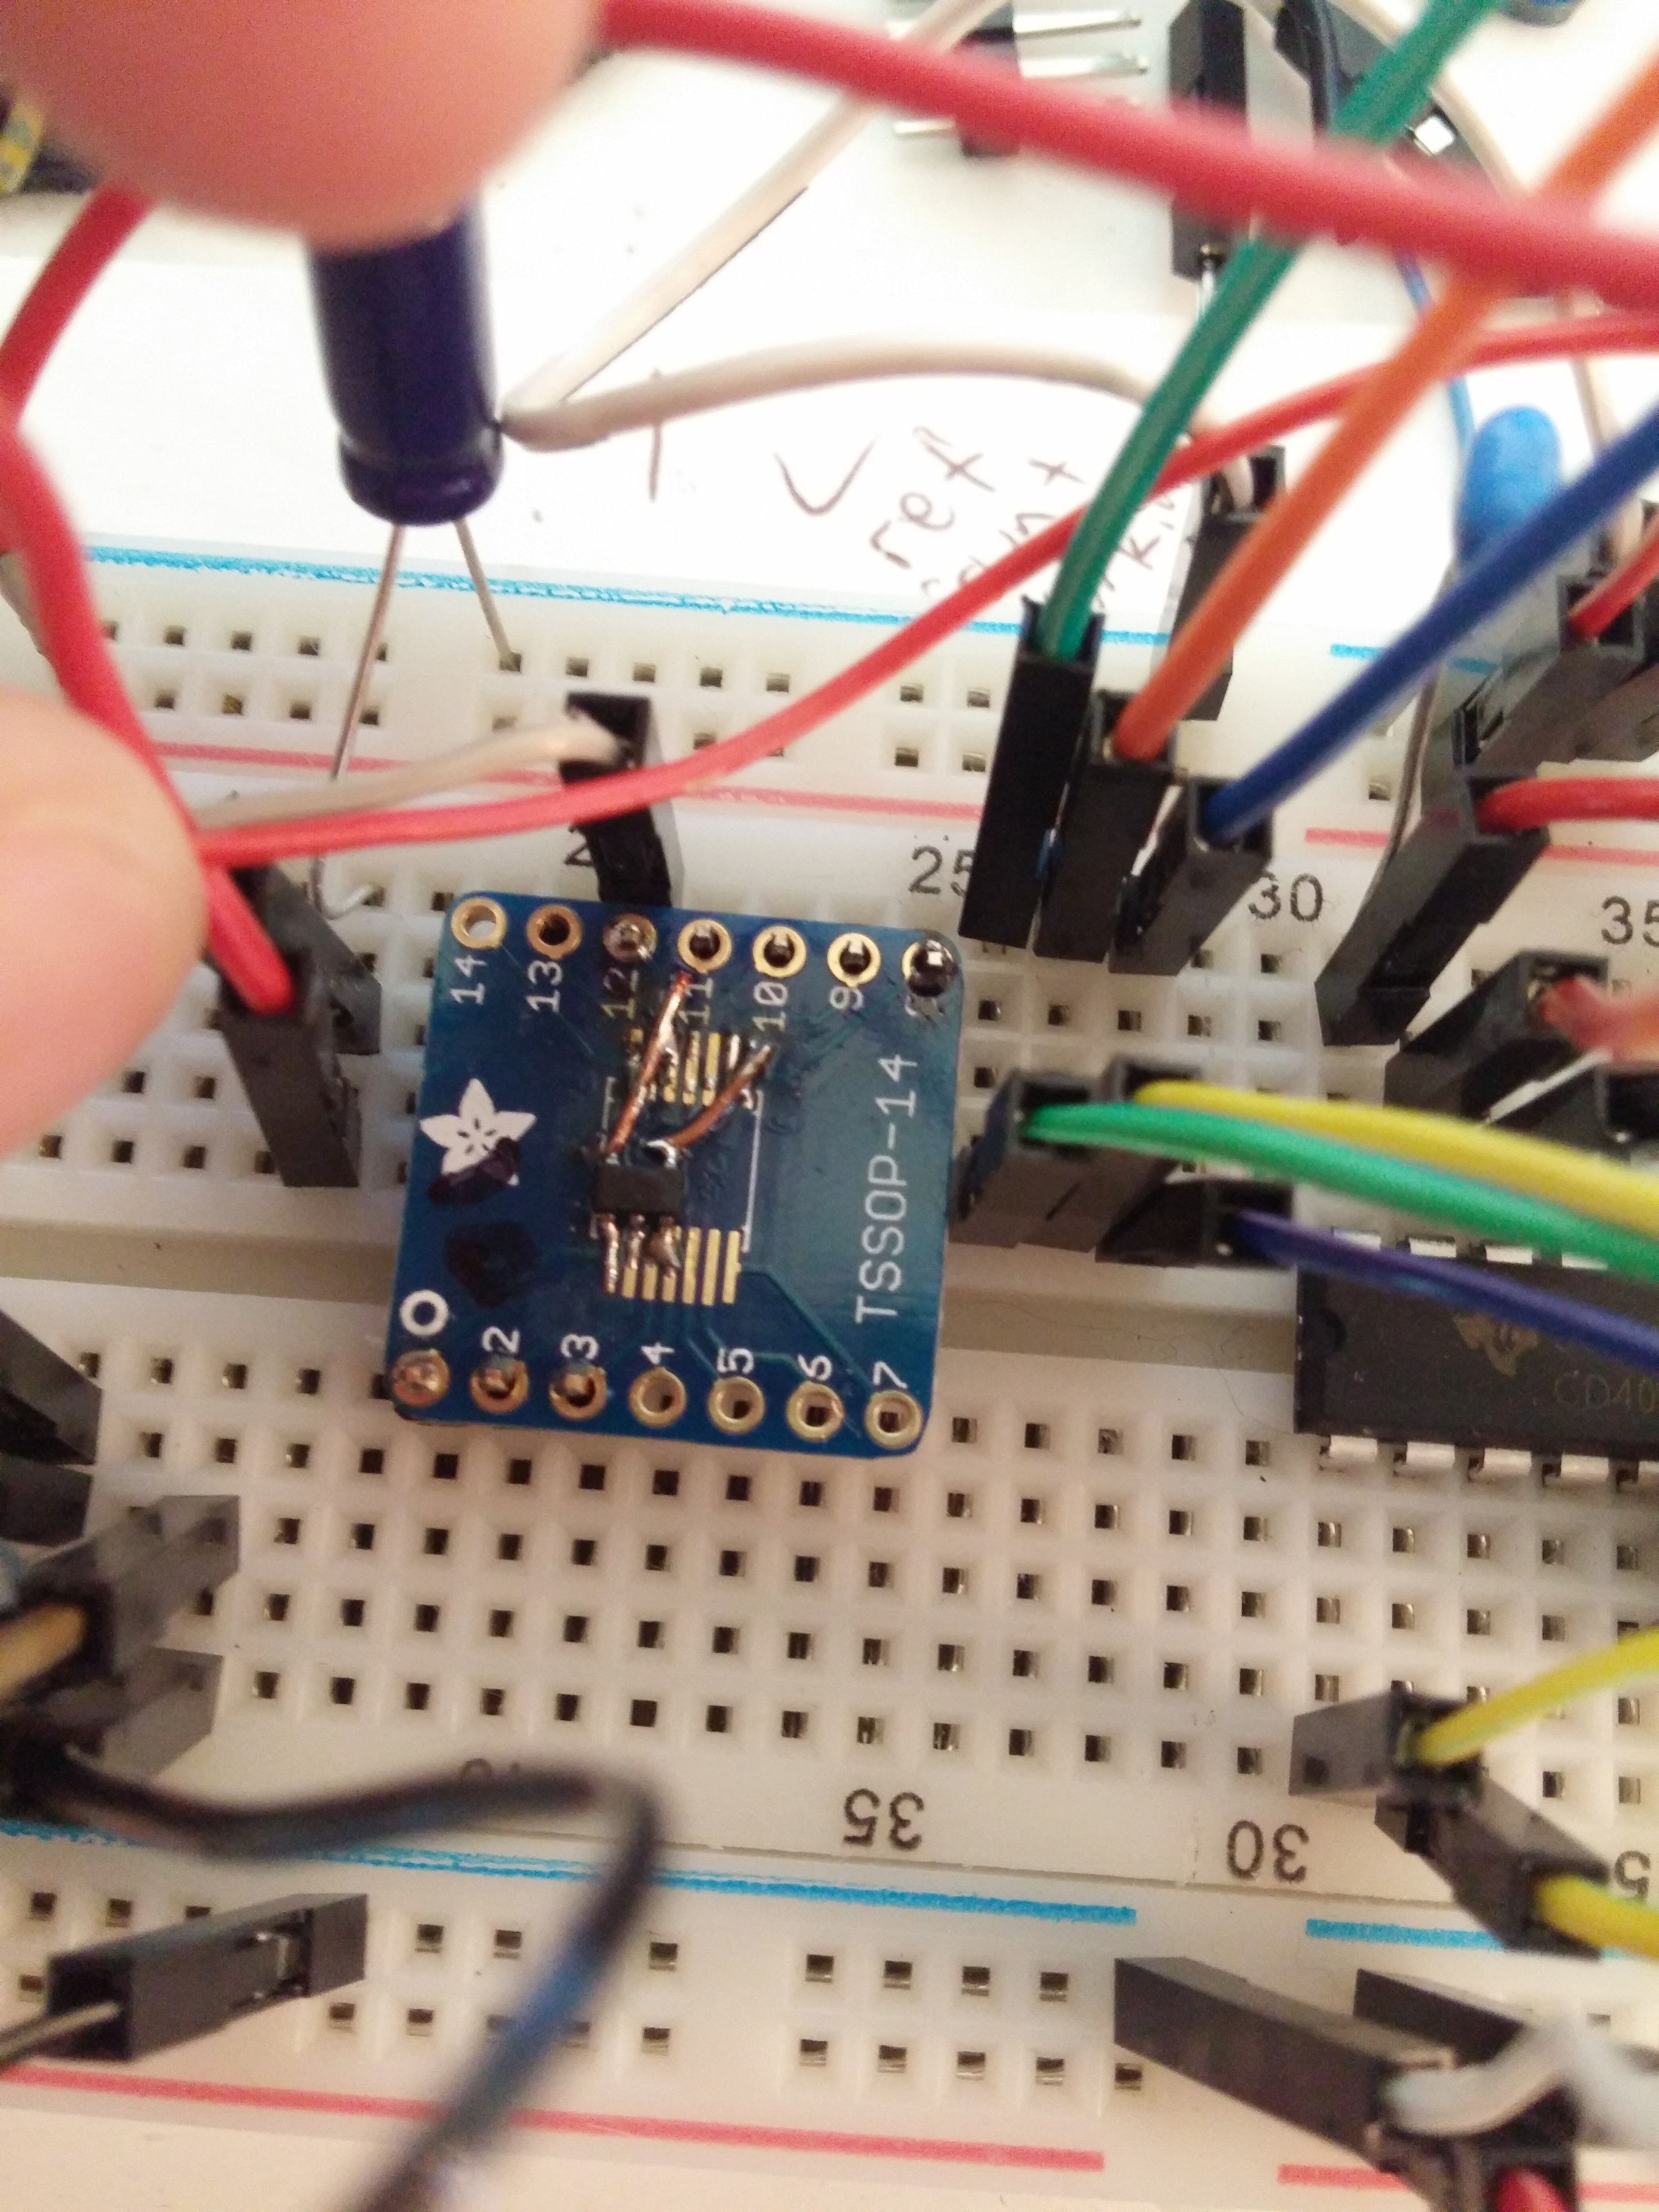
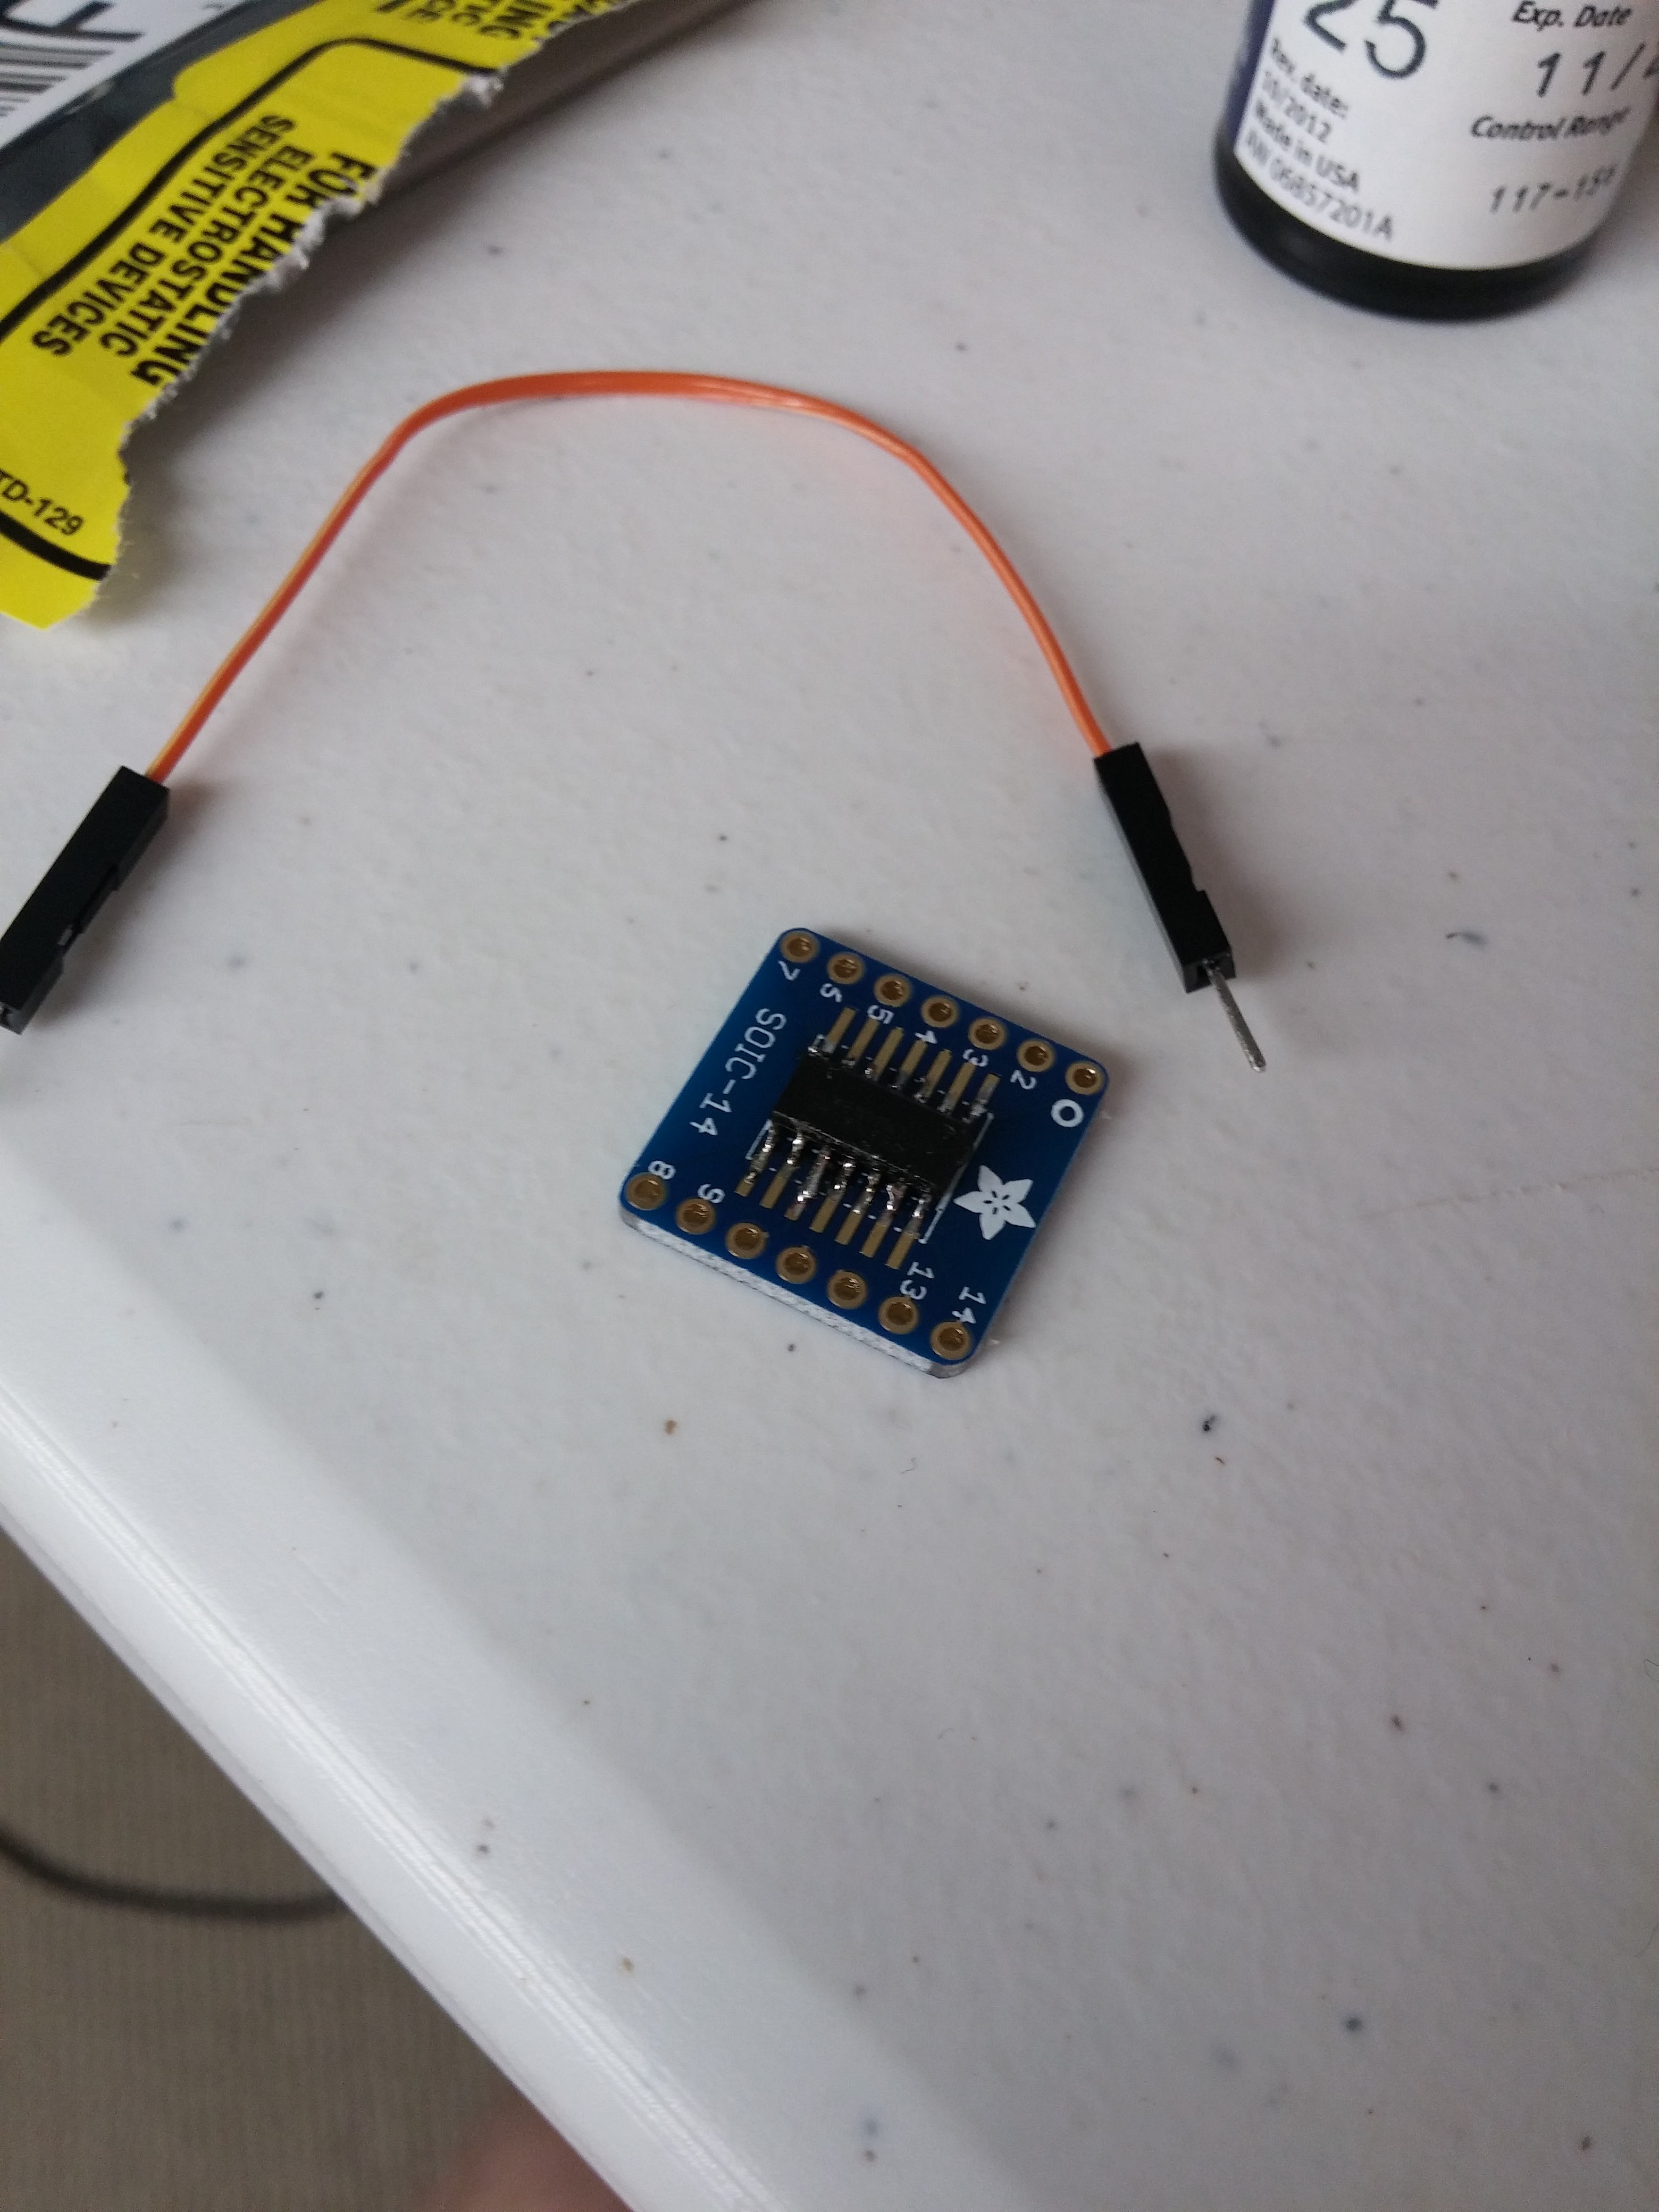
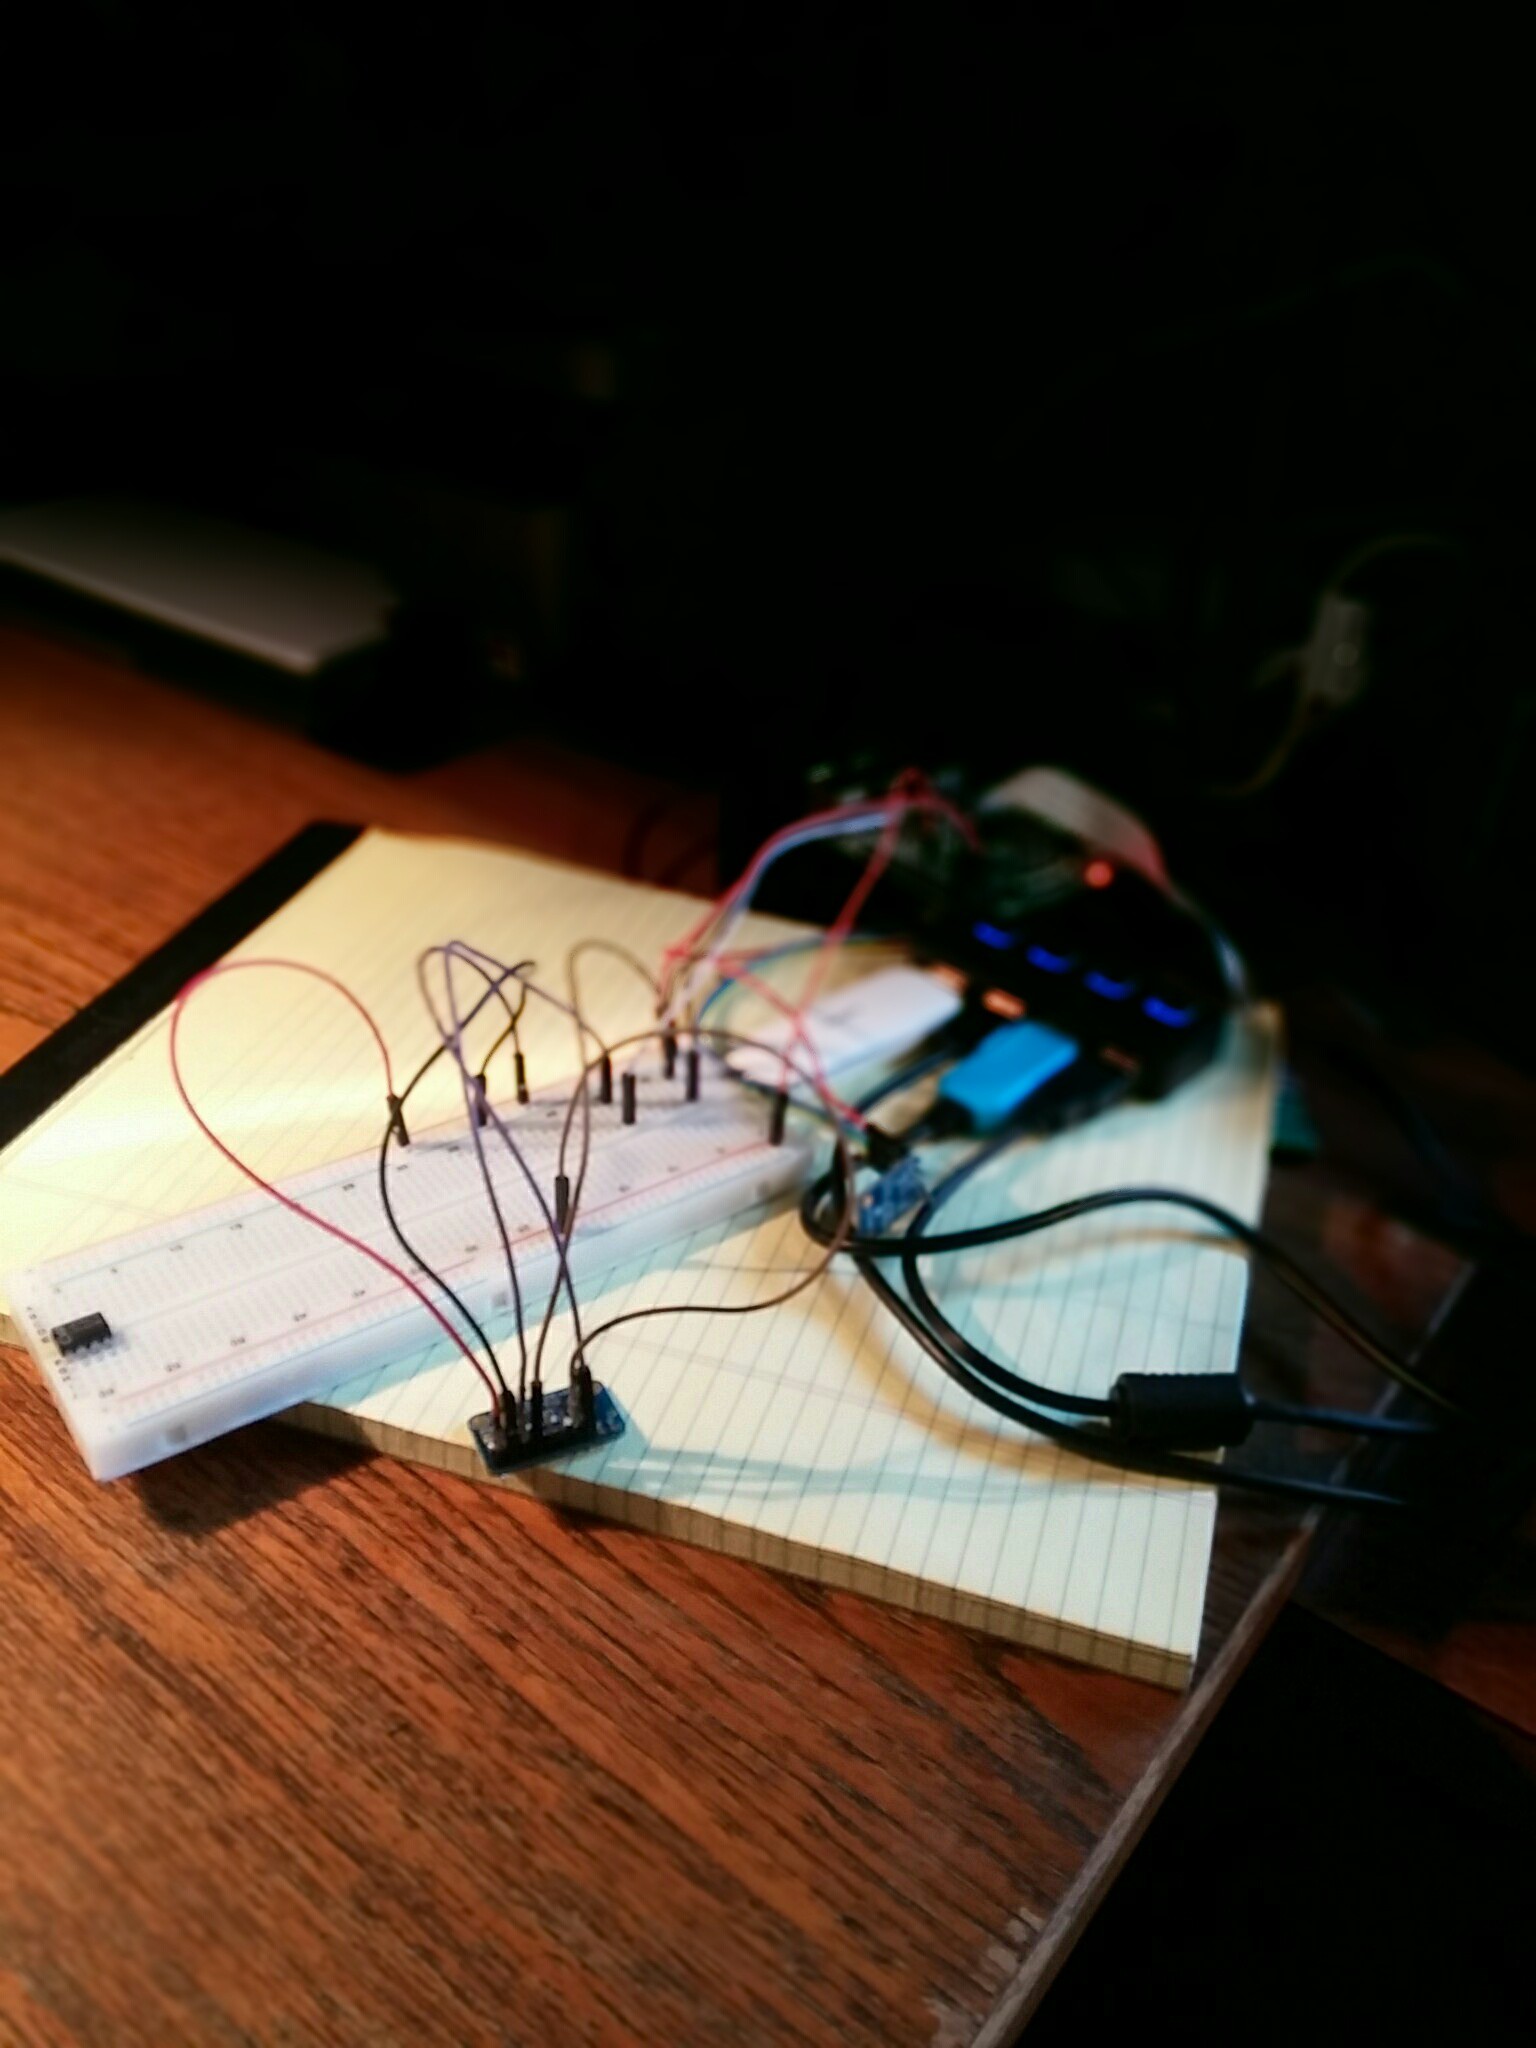 I then ran simpletest.py. The result was an string of numbers around 13000, give or take a few hundred. I disconnected the pin and they all went to 0, so something was definitely happening.
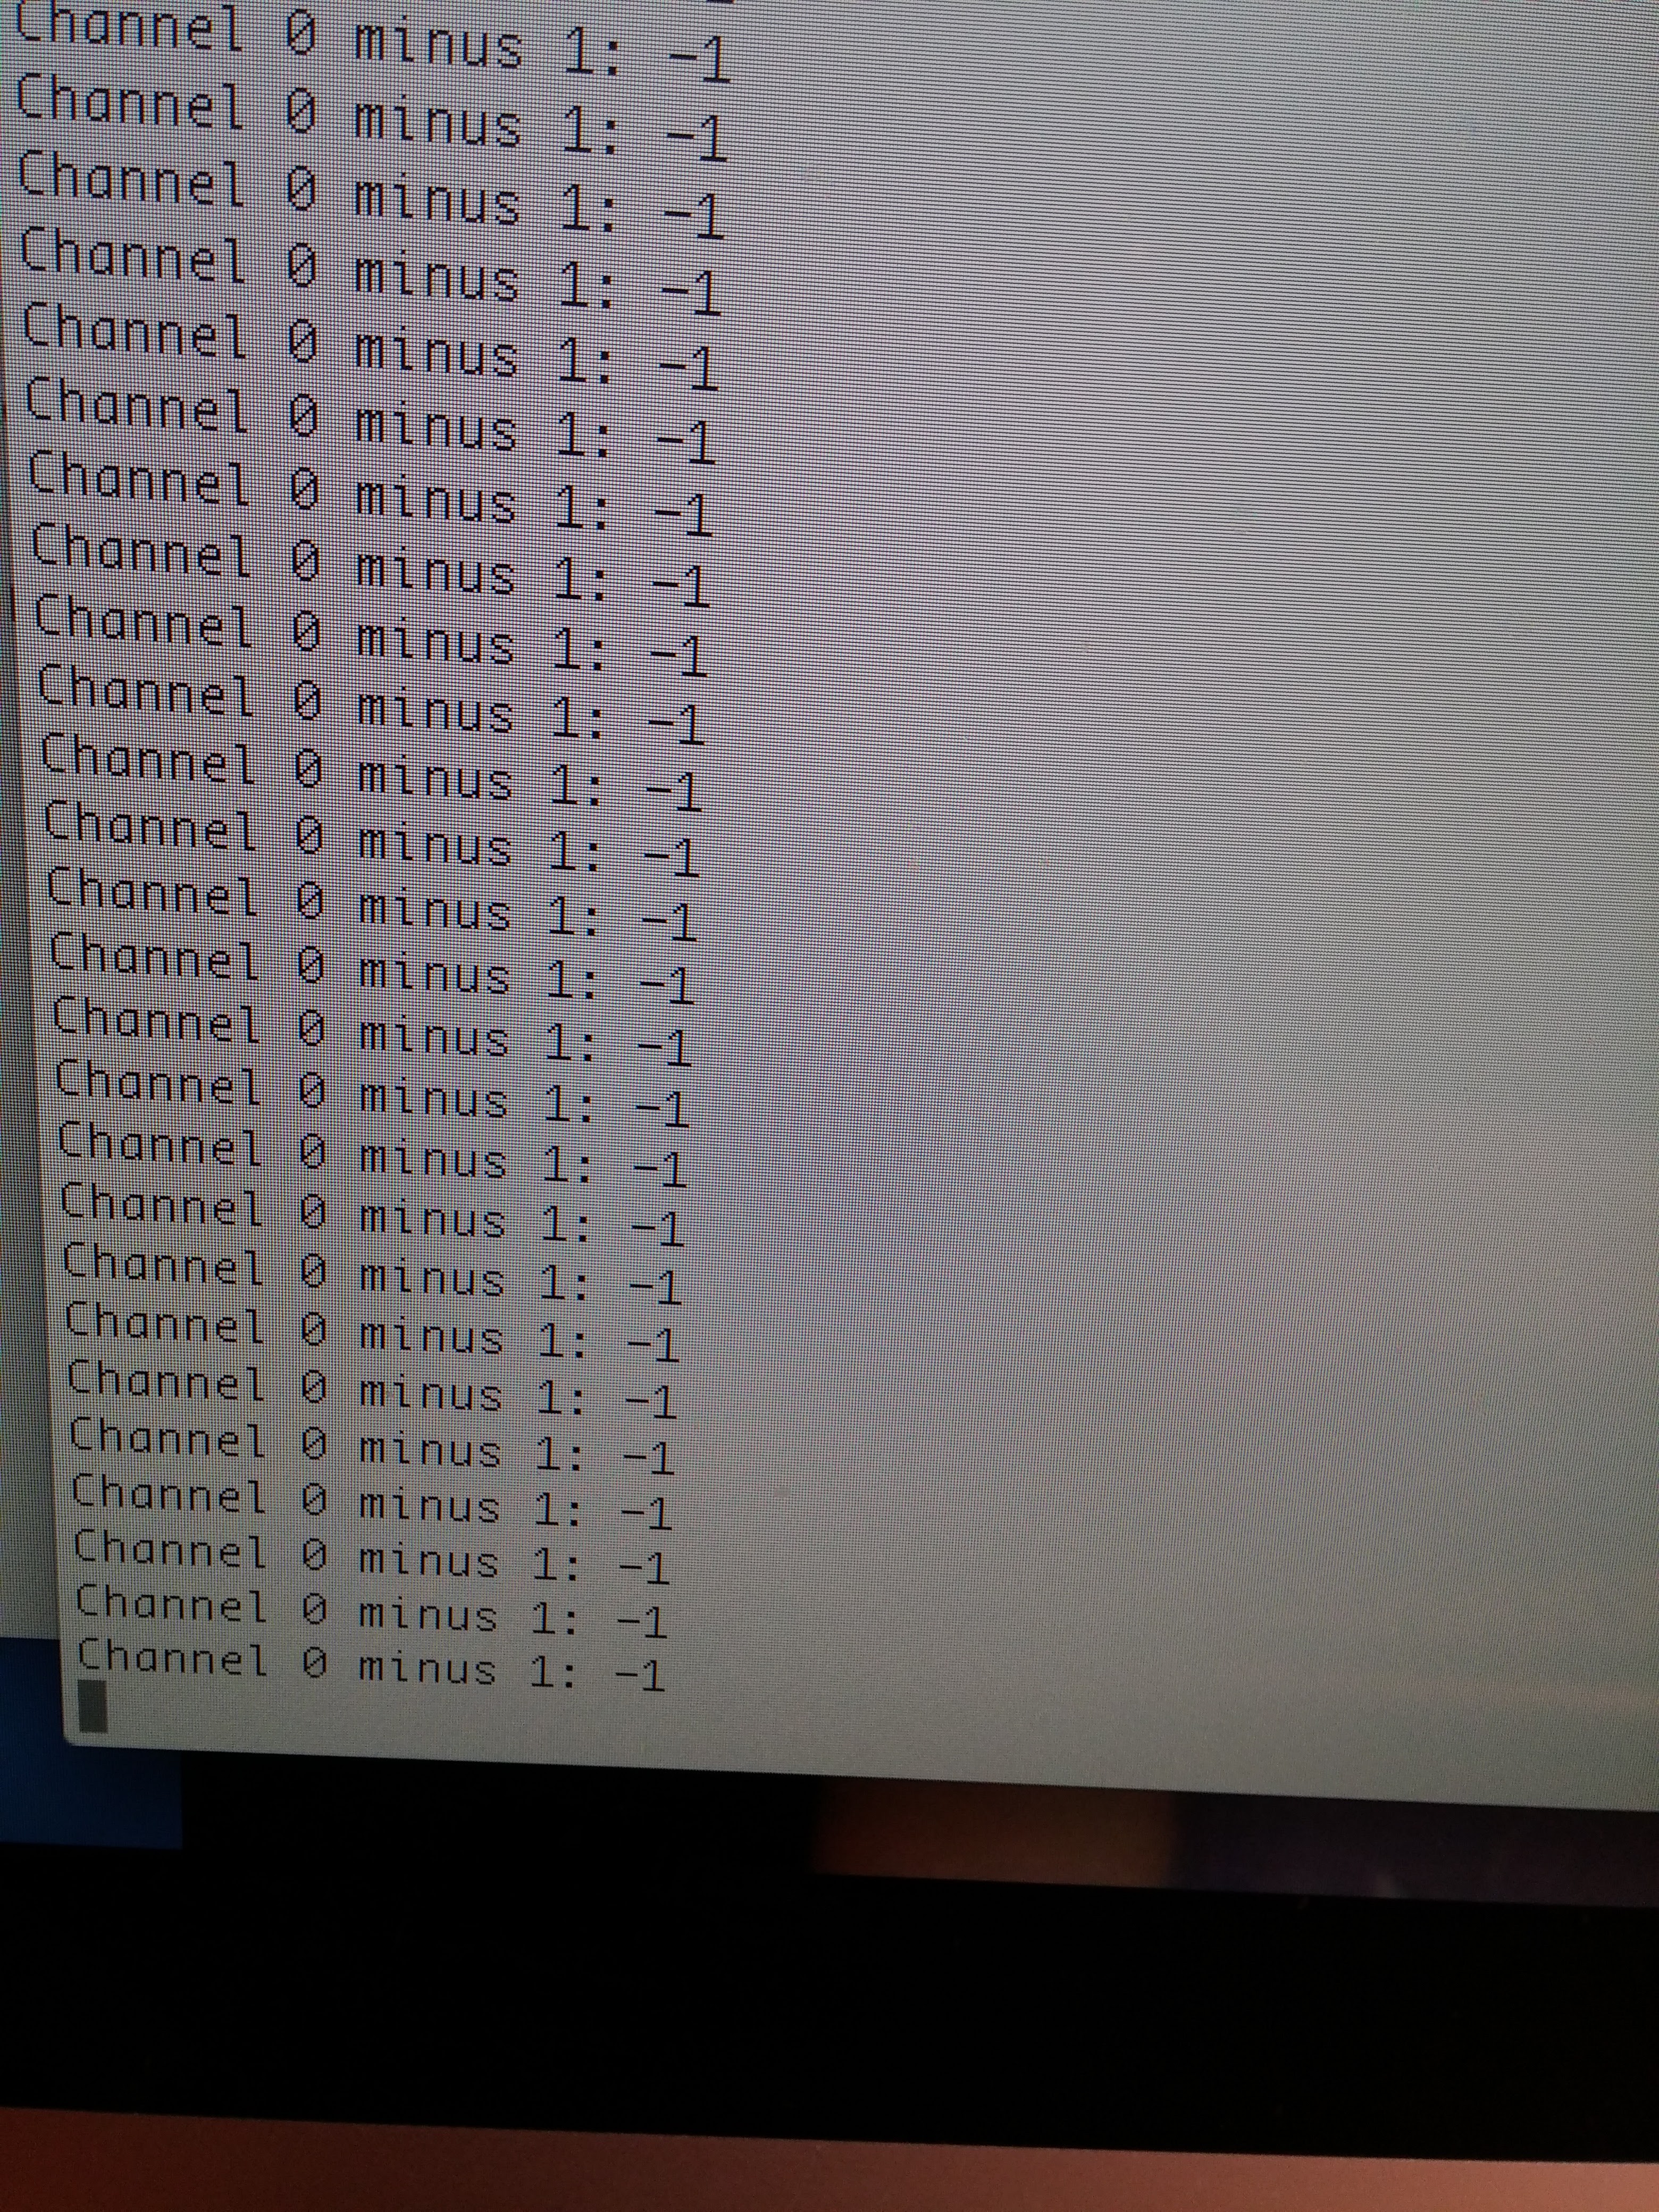


 Lars Knudsen
 Thatcher Chamberlin
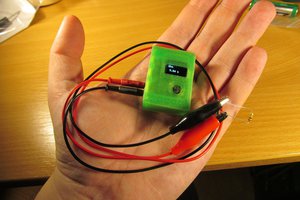
 jaromir.sukuba
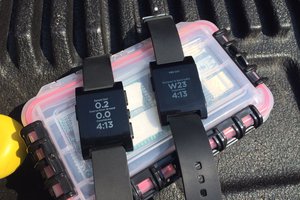
 Brook Patten
openAPS?