Although the work to decode the NASA Wind Sensor was already completed as part of the original pyboard based system, I think that it is of interest and a key part of the project so it is probably worth discussing as one of the key technical challenges that had to be overcome.
The most recent iterations of the NASA Wind system have a NMEA0183 output stream from the main display unit which outputs the data stream over RS232. This would be easy to intercept and pass into the RPi to be fed over WiFi. However, older units such as the one installed on my boat do not have this functionality, although they do have an output for a display repeater.
My first inclination was to attempt to find a new display unit which I could swop into the boat. However, despite monitoring ebay and other sources for a while now suitable units became available at a price that I wanted to pay. The alternative was to decode the signals from the existing system. There were two opportunities/possibilities for this:
- Intercept the raw data from the masthead unit and decode
- Intercept the data sent for a display repeater and decode at this point
Whilst the first option is the more direct and straightforward solution, I opted against this as I wanted my system to sit on top of the existing boat systems and not to interfere or compromise them in any way, and teeing off of the signal between the masthead unit and its display head was in my mind an unnecessary risk to the integrity of the system.
From research on the web I had identified that the repeater output data from the NASA Depth unit had previously been decoded.
This basically identified the output from the NASA repeater socket as being an I2C stream which contained a burst of data which a standard set of command bytes and data bytes which consisted of a single bit of data for each LCD segment on the display. It seemed reasonable to me that the NASA Marine wind instrument would transfer the data in a similar manner and I attempted to capture the data as a proof of concept.
Initial data capture with a logic analyser showed two main differences between the data reported from a depth repeater socket and the data captured from the wind repeater socket. These were firstly that the logic data suggested that the SCL and SDA pins of the repeater socket were reversed in the wind unit relative to the depth unit and that the data length was longer (17 bytes vs 11 bytes) in the wind unit. The increase in data length was not unexpected as the display of the wind unit had more LCD segments to allow a complete wind rose to be displayed. However, the switching of SDA and SCL lines was a little bit of a surprise and seemed to have little justification. Perhaps the only sensible reason for this was to ensure that if a depth repeater was plugged into a wind unit or vice versa the data stream would be so invalid that the repeater unit would reject the input rather than display any spurious output.
Following these investigations a further proof of concept was conducted capturing the I2C data using a pyboard running as a I2C slave device on the appropriate address. This was successful and the next task was to decode and understand encoding on the I2C stream.
In order to practically decode the I2C stream of data it was necessary to effectively decode the raw masthead data so that I could spoof the data and fool the display into displaying LCD segments of my choice in a controlled manner.
Once again I was fortunate that someone else had previously decoded the raw output from the masthead unit:
http://theshipcomputer.blogspot.co.uk/2014/01/the-wind-sensor.html
This identified that the direction was indicated by two varying analogue values, at any one time, one of these two analogue outputs was at an extreme high or low value, indicating the quadrant and the second varied linearly across tat quadrant. The speed was indicated by a square pulse per revolution of the wind cup, a further source identified this as a 10 millisecond pulse.
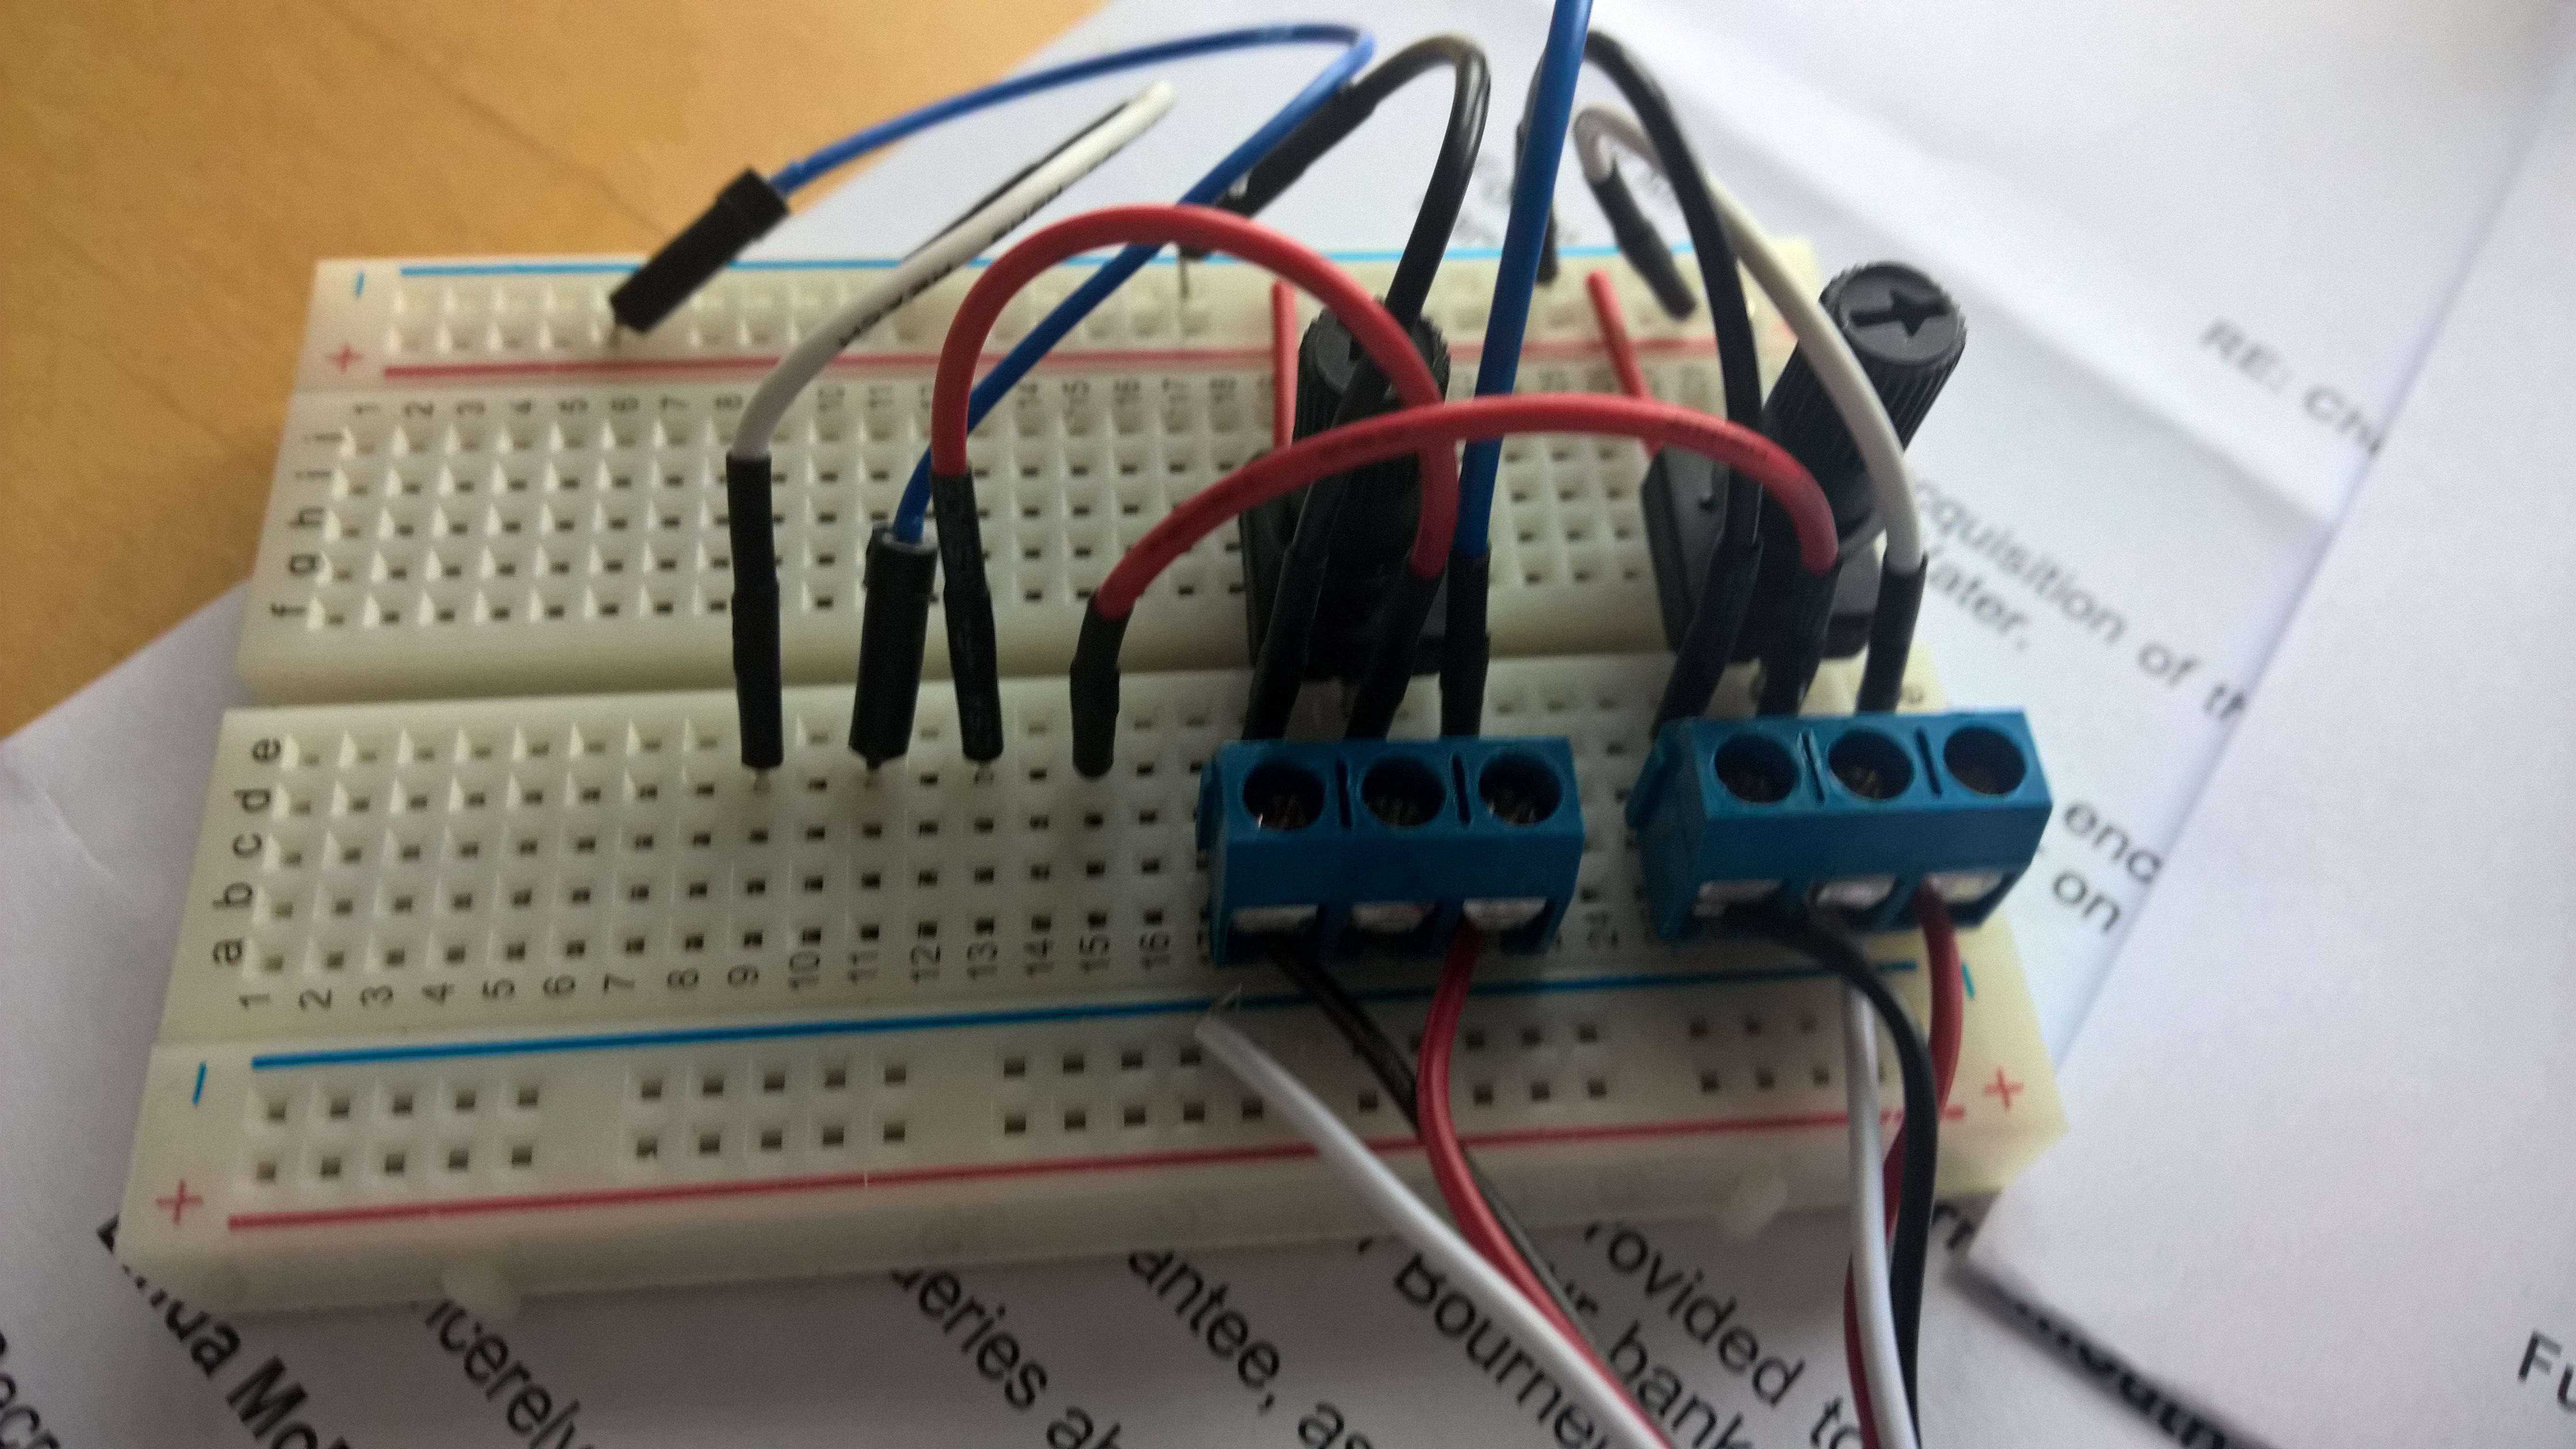
Armed with this information I was able to decode the wind sensor relatively straightforwardly. In order to decode the direction, I created a simple circuit with two potentiometers connected to the two analogue input lines of the display unit. By adjusting the potentiometers, I was able to cycle through each direction in turn capturing the I2C data for each position.
With the speed line disconnected the display speed was 0 throughout, thus the only bit that changed in the each iteration was the data bit for the direction LCD segment. By analysing the resultant I2C output I was able to create a map of data bit verses wind direction. This is somewhat limited in that it only gives a 3° resolution, but given the quality of my sailing and variation of the wind I think this is more than sufficient for my purposes. To decode the speed I created a simple pyboard routine to generate a 10ms square pulse at a selected input frequency. After introducing a calibration factor to relate revolutions to windspeed I was able to cycle through the following speeds (1.0, 2.0, 3.0, 4.0, 5.0, 6.0, 7.0, 8.0, 9.0, 10, 11, 12, 13, 14, 15, 16, 17, 18, 19) this allowed the bit patterns for each digit and the decimal point to be isolated.
Discussions
Become a Hackaday.io Member
Create an account to leave a comment. Already have an account? Log In.