 Bruce Land
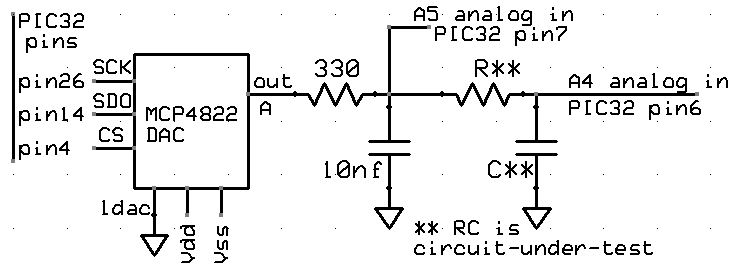
It is useful to get the phase and magnitude of response of a circuit as a
function of frequency. A DDS unit is used to synthesize a cosine wave,
which is then played through a SPI attached DAC.
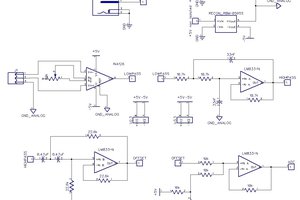
The output of the DAC is attached to the circuit under test. For
starts, I am just testing on an RC lowpass with a nominal cutoff
frequency of 10000 radians/sec (1590 Hz) and a resistance of 10 kohm.
The voltage across the capacitor feeds back to the AN4 analog input (pin
6). An ISR does the DDS sine synthesis, records the voltage, and
computes the quadrature values by multiplying the analog input voltage with the DDS value (I-signal) and a sine wave in quadrature
with the DDS value (Q-signal). The quadrature signals, which have zero
average frequency (product of two equal frequencies) are lowpass
filtered in the ISR, then the main thread computes the phase and
magnitude. Test code.
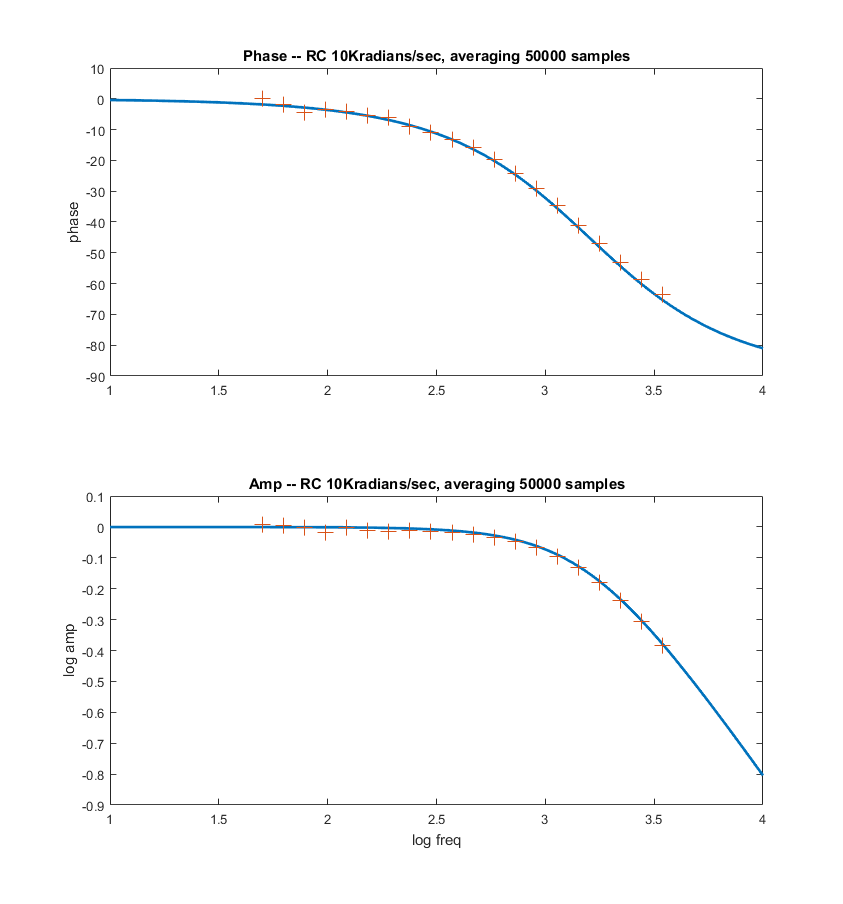
-- A modification of the low pass algorithm allows for much better
averaging by adding together up to 200,000 of the quadrature signals,
representing an average of the measurements
for up to one second. More points means accuracy at lower
frequency. Averaging 50,000 points works down to about 100 Hz, 200,000
works down to lower than 5 Hz. There is a systematic phase error which
can be calibrated out. The SPI transaction is ends in the ISR following
the ISR where it started. That implies a 5 microsecond delay in the DAC
update, and thus a frequency-dependent phase-shift. Also, as the
frequency increases, the sine approximation gets worse using DDS. The
phase correction is linear in frequency and corresponds to 5
degrees/KHz. Code.
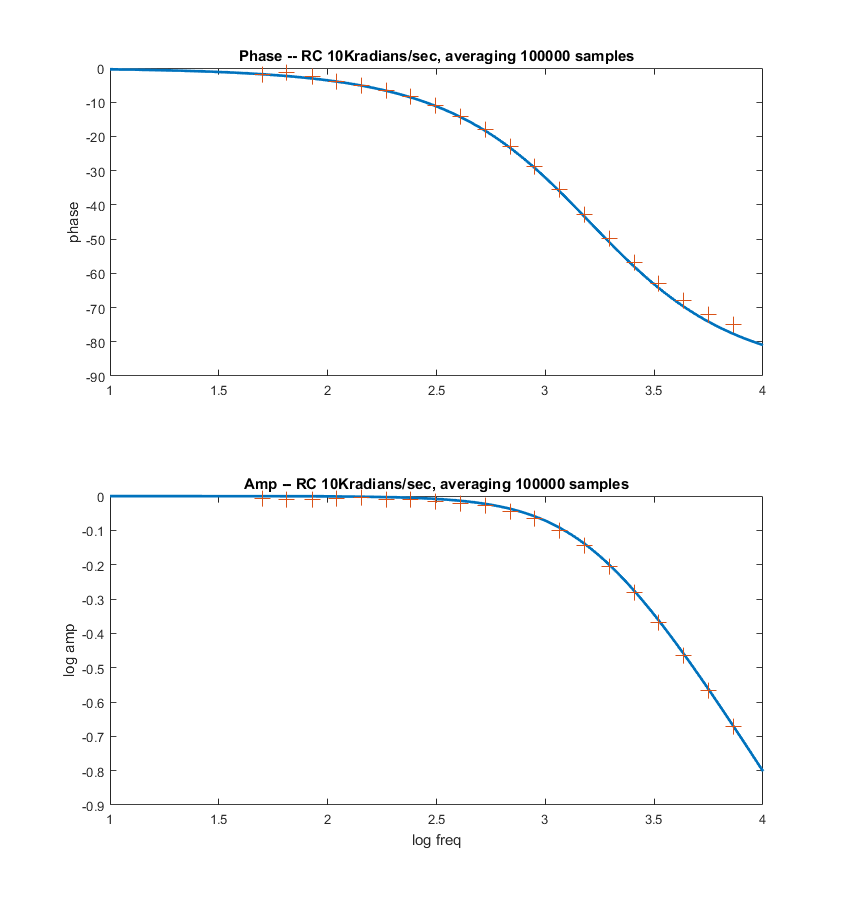
The first two plots below compare the theoratical curves (in Matlab)
with the data generated by the program, shown as '+' symbols. Modifying
the frequency-dependent phase correction from f_main*0.005 to f_main*0.0048 makes the phase fit better in the third image. Addition of a scan command (code) produces a table of frequencies, phases, and amplitudes to feed to matlab.
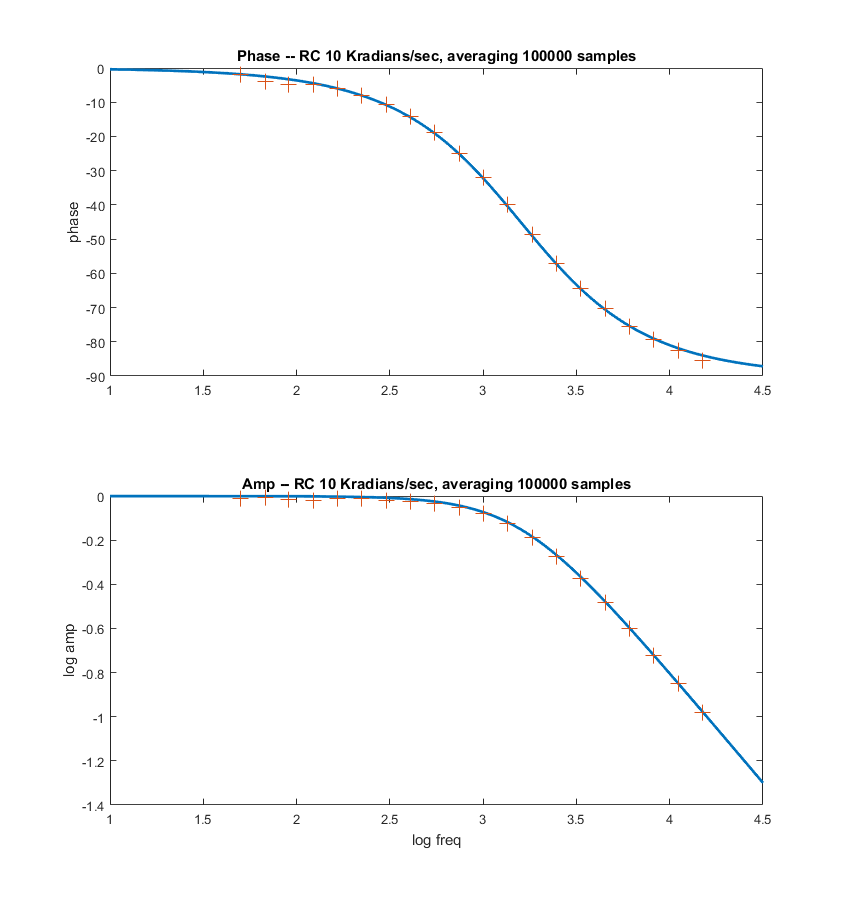
-- Adding a lowpass filter with a time constant of 3 microseconds to
the sinewave output (200 KHz sample rate implies 5 microsecond sample
time), and recording both the input and output of the
circuit-under-test (CUT) drops the error to below 0.25 degrees/KHz. The
phase of the CUT is then output phase minus input phase, and the gain is
the ratio of output/input amplitudes. This extends the range of correct
phase above 10 KHz, as shown in the 4th plot below. Code

 Jesse
Jesse
 Manuel Tosone
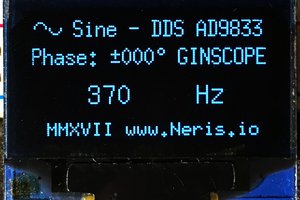
 Gintaras Valatka
 agp.cooper