 fereshteh
Project Description - Challenges and Our Solution
Wearable computing has developed from a niche to a sizable consumer market that has seen substantial uptake in most recent years. With such popularity comes the opportunity for streamlining input to wearable and mobile computing devices. The traditional means of interaction, such as mouse and keyboard, are typically not very well suited for miniaturized mobile and wearable devices due to the small size. Hence more effective input means need to be developed that are both convenient for the user and reliable to process automatically. Our research focuses on developing such new input technologies using Serpentine.
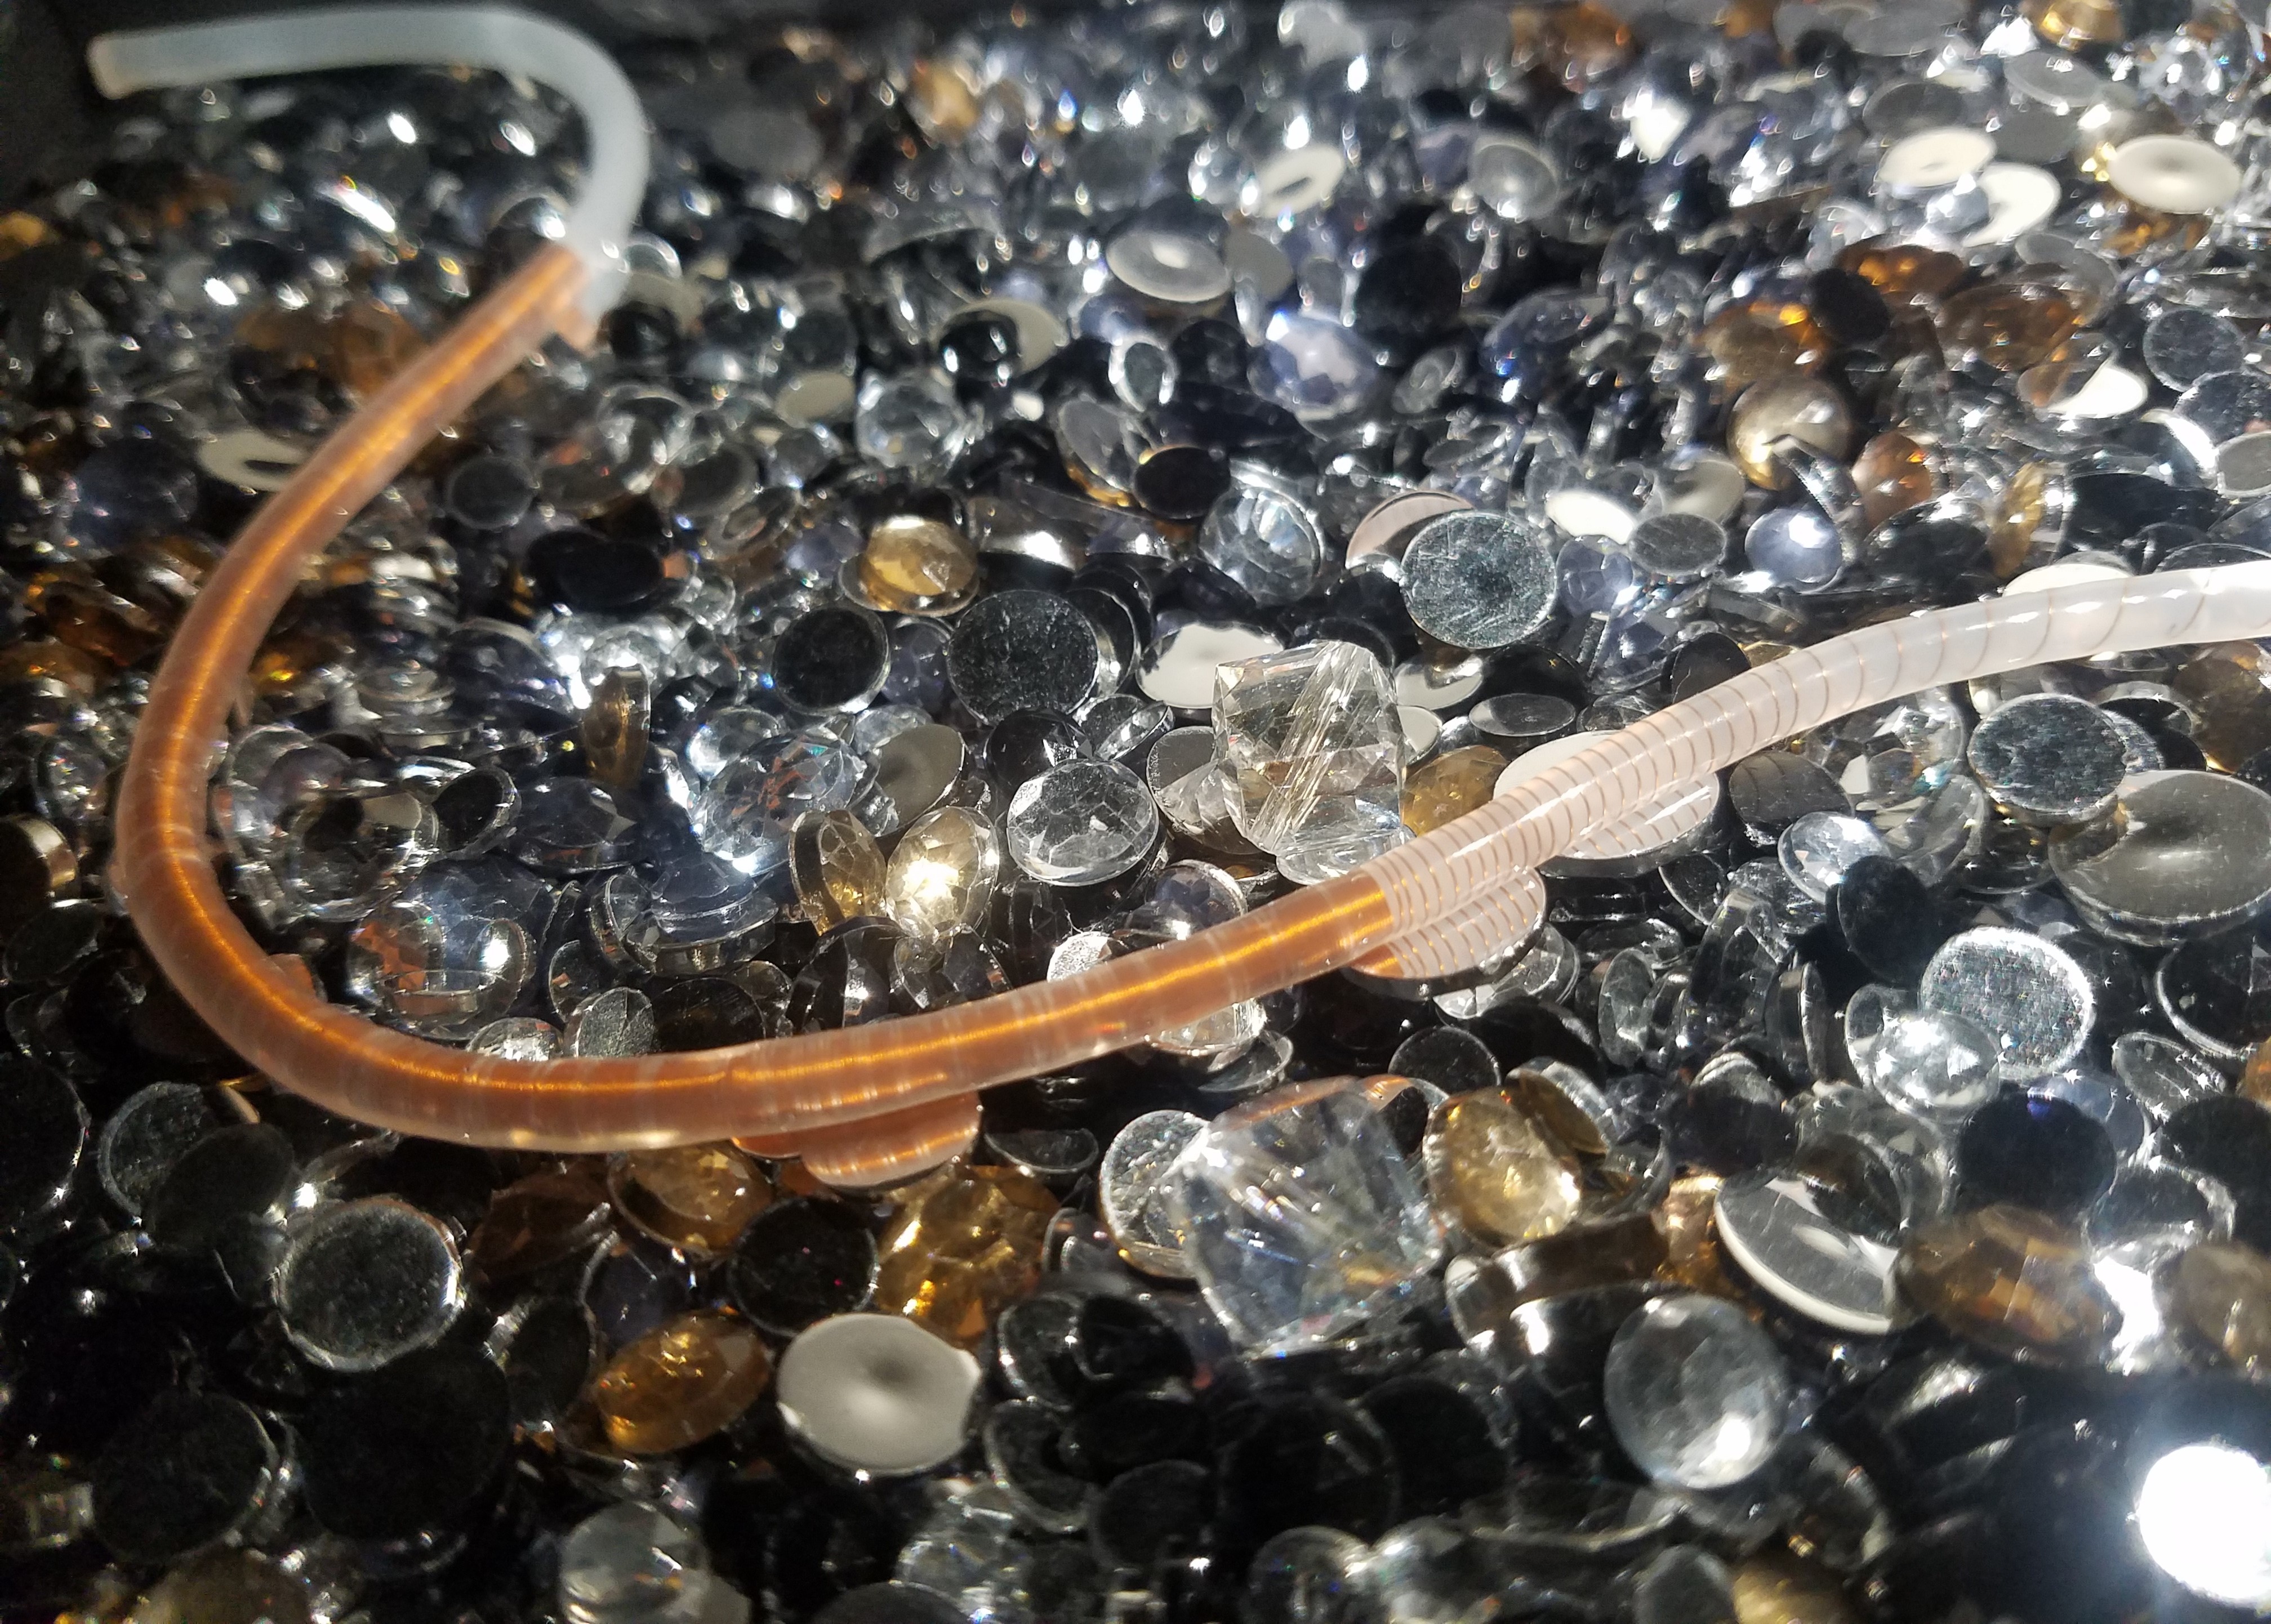
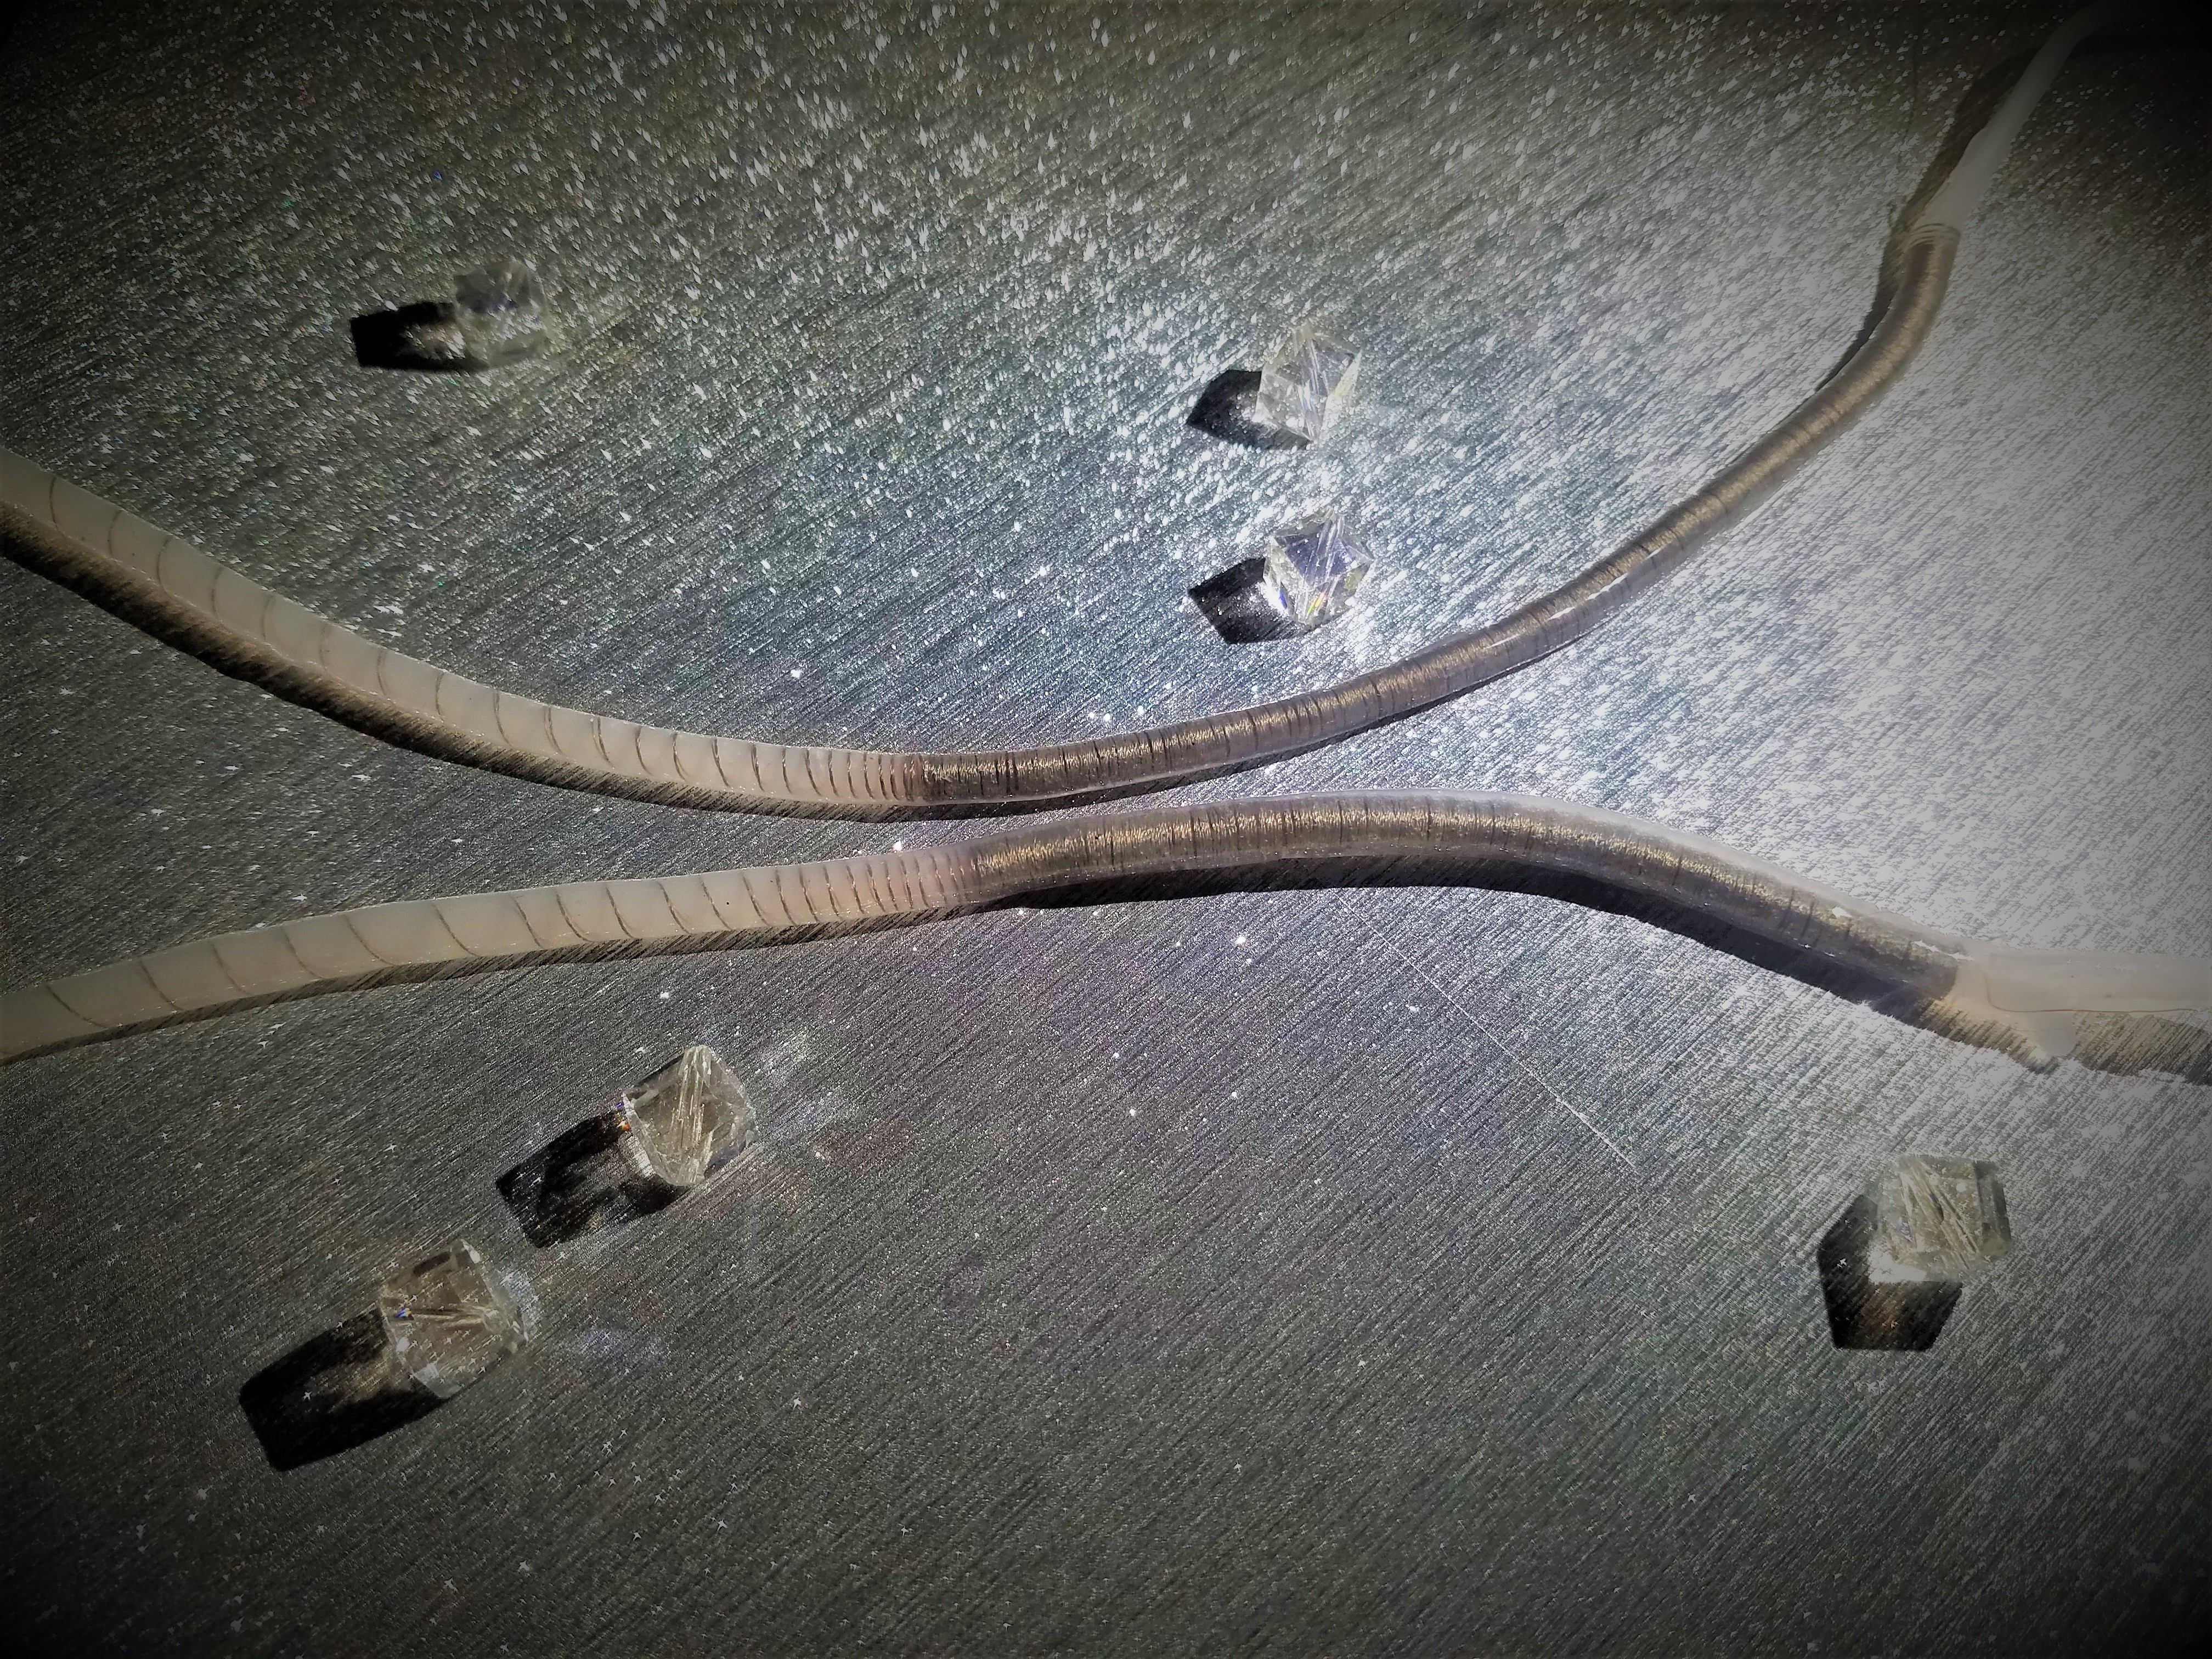
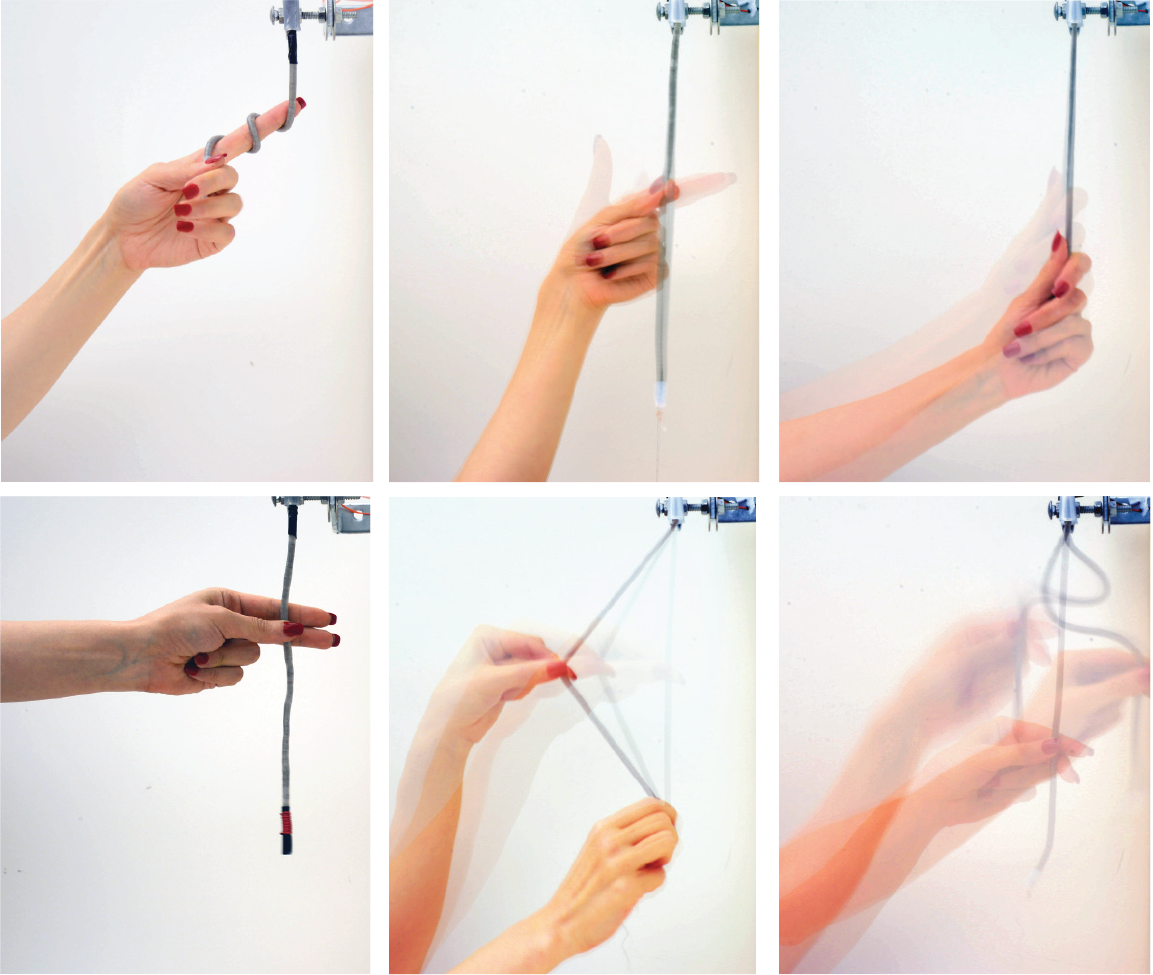
Serpentine, a self-powered sensor that is a reversibly deformable cord capable of sensing a variety of natural human input. The material properties and structural design of Serpentine allow it to be flexible, twistable, stretchable and squeezable, enabling a broad variety of expressive input modalities.
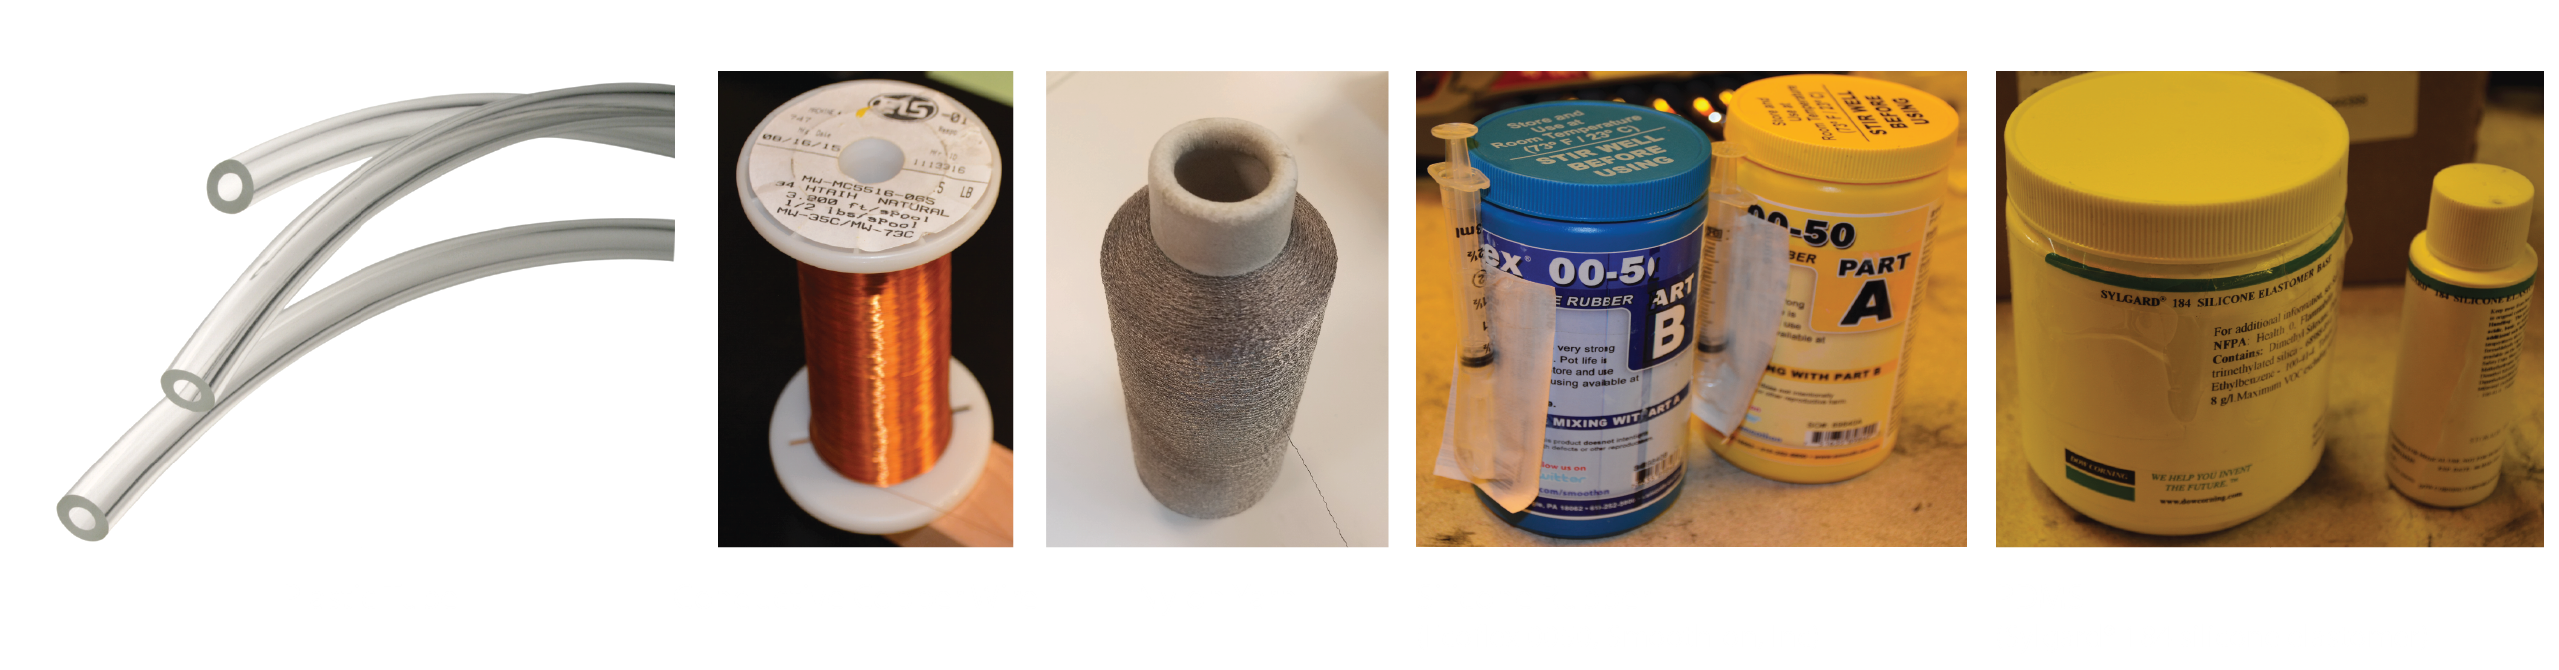
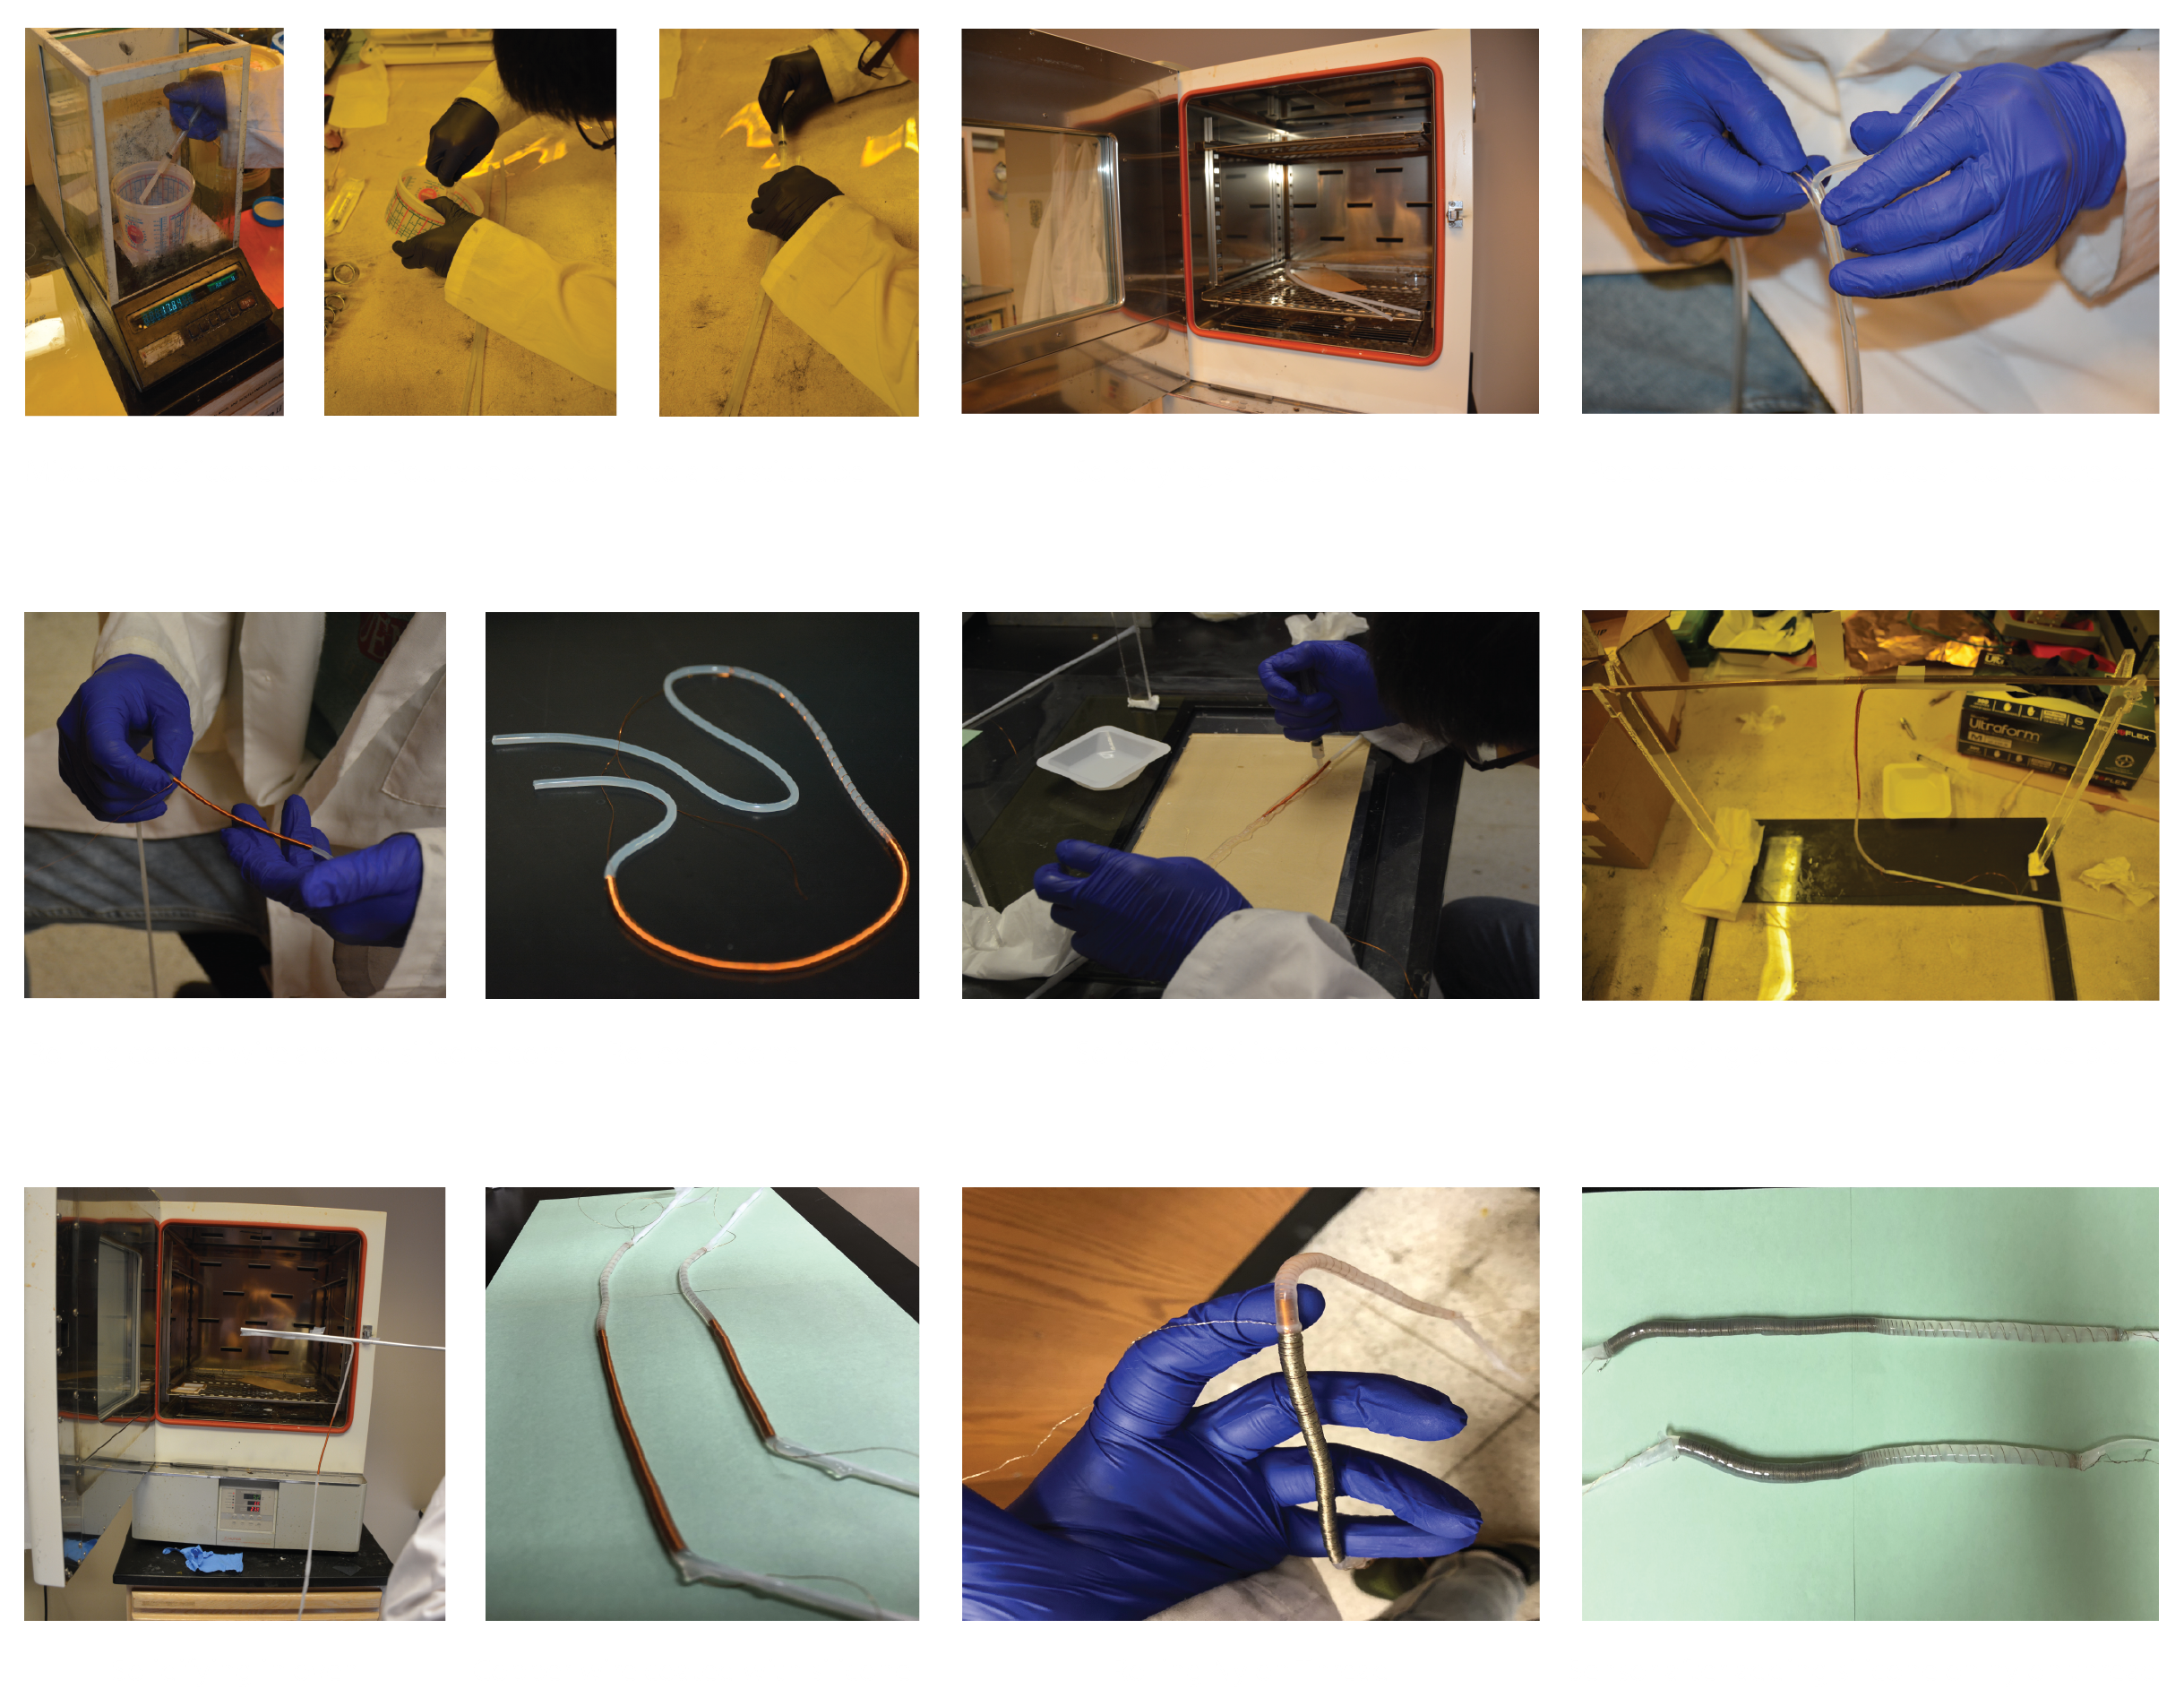
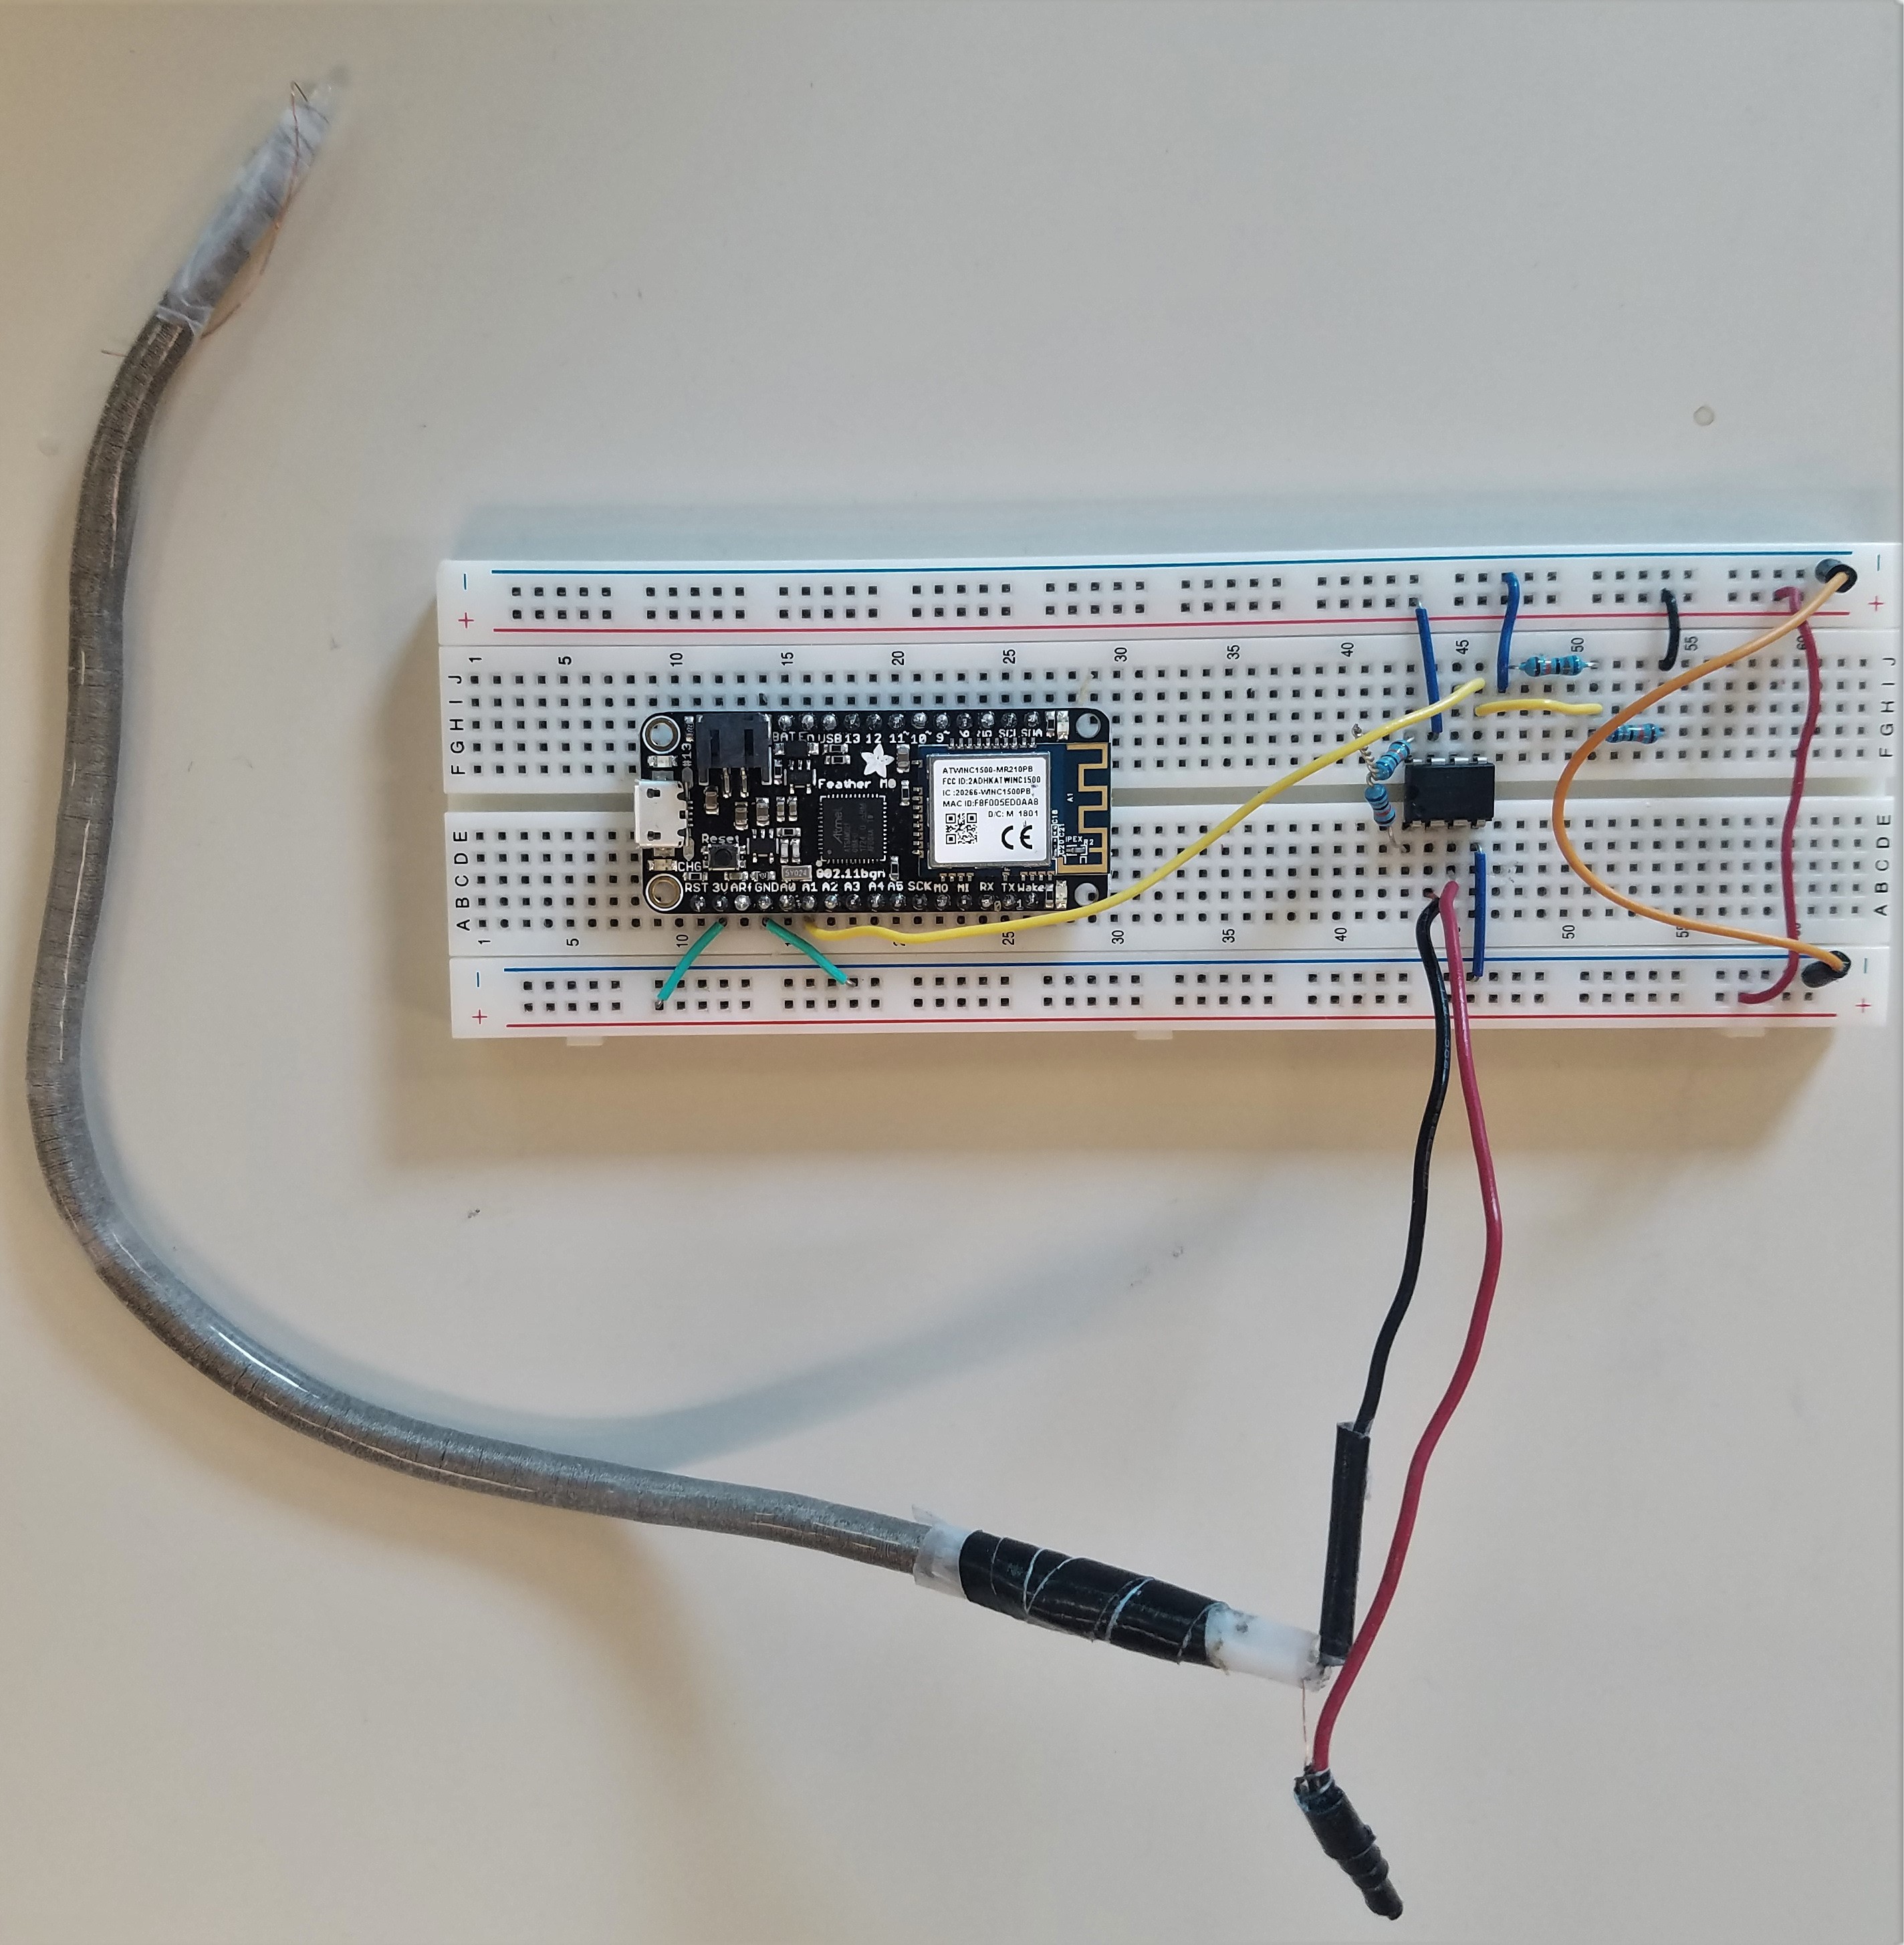
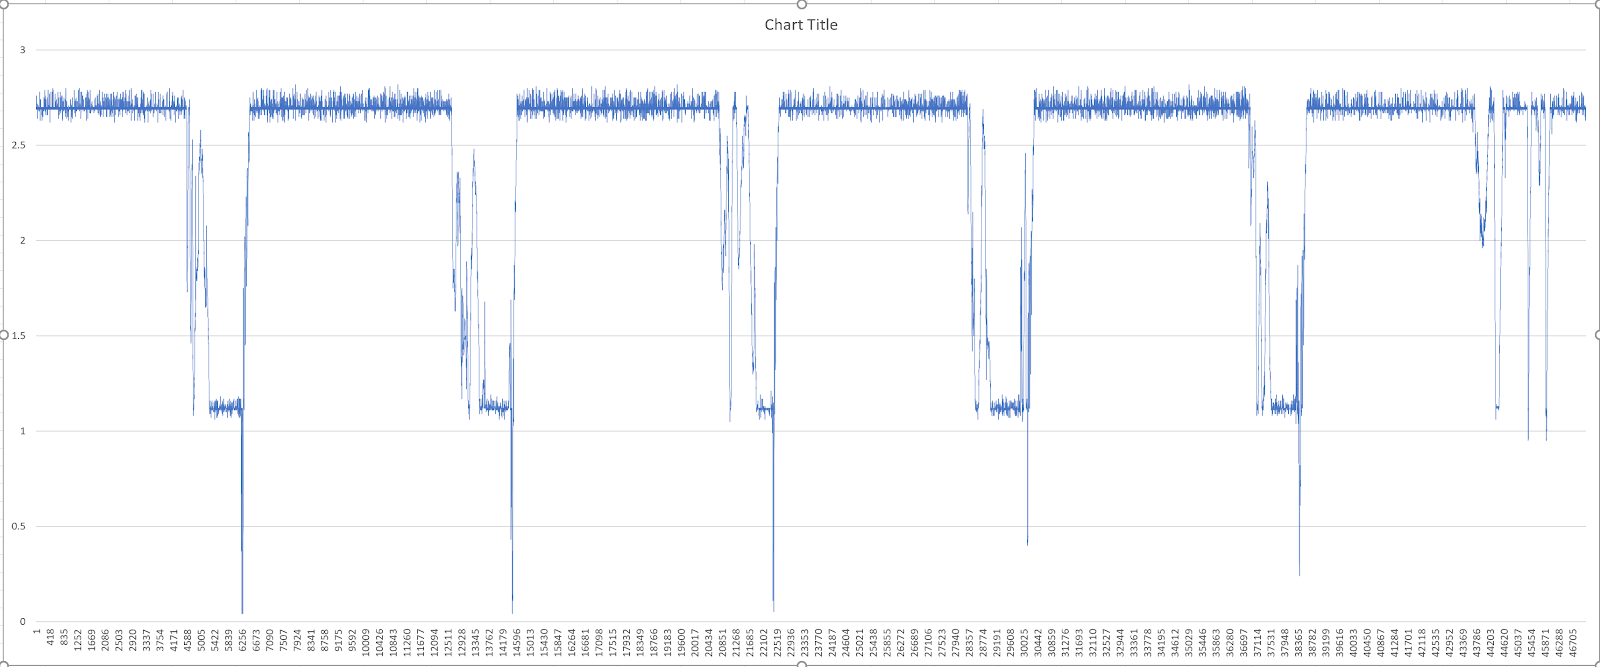
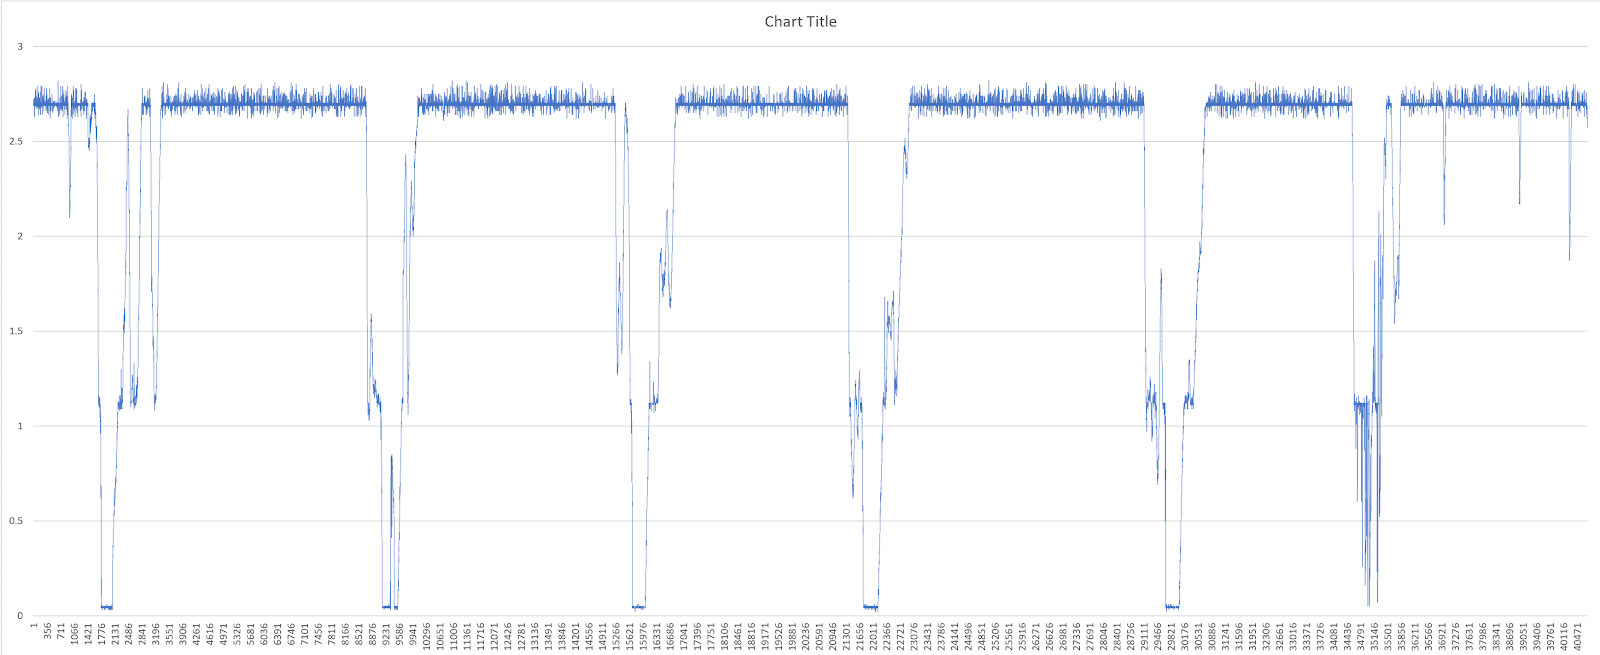
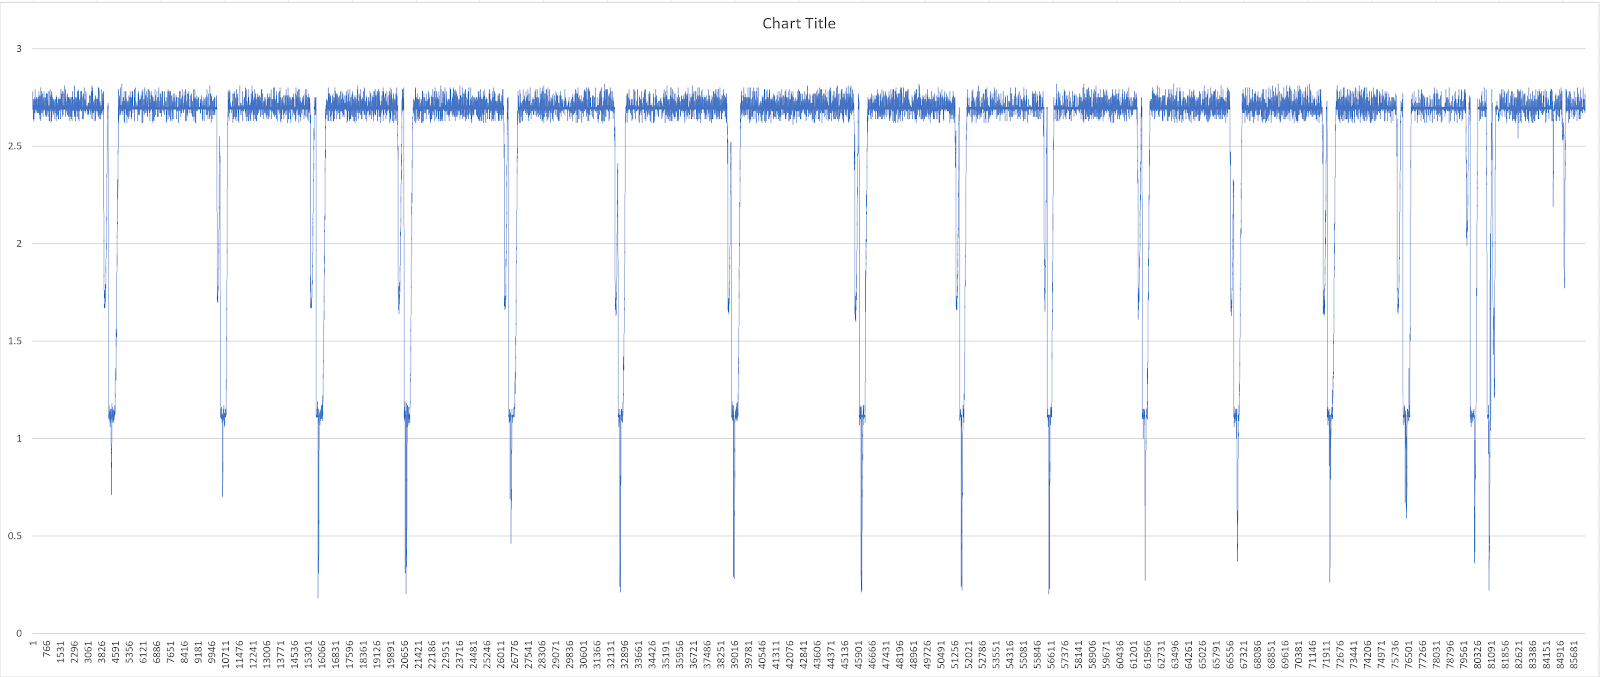
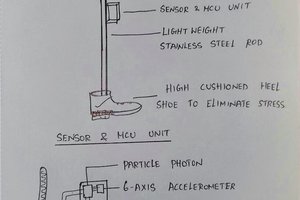
Serpentine is fabricated in a coil-shaped structure with multiple coaxial layers of silicone, copper and conductive nylon thread. Its structural design and specific choice of materials allow mechanical deformations of the interface that create time-varying charge distributions between the conductive nylon and PVA coated copper thread, which generate electrical signals. Such signal generation happens based on triboelectric nanogenerator (TENG) phenomenon that works on the conjunction of electrostatic induction and triboelectrification. Since, the deformations and consequently, charge distributions lead to power generation, the working principle itself eliminates the need of external power to sense deformations caused by gestural interactions. Self-generated signals are then processed through an implemented system including signal processing pipeline that uniquely maps them to actions that created the deformations. Our system enables us fulfill our vision to create an interface that is not only self powered but also sensitive to a wide range of expressive input modalities.
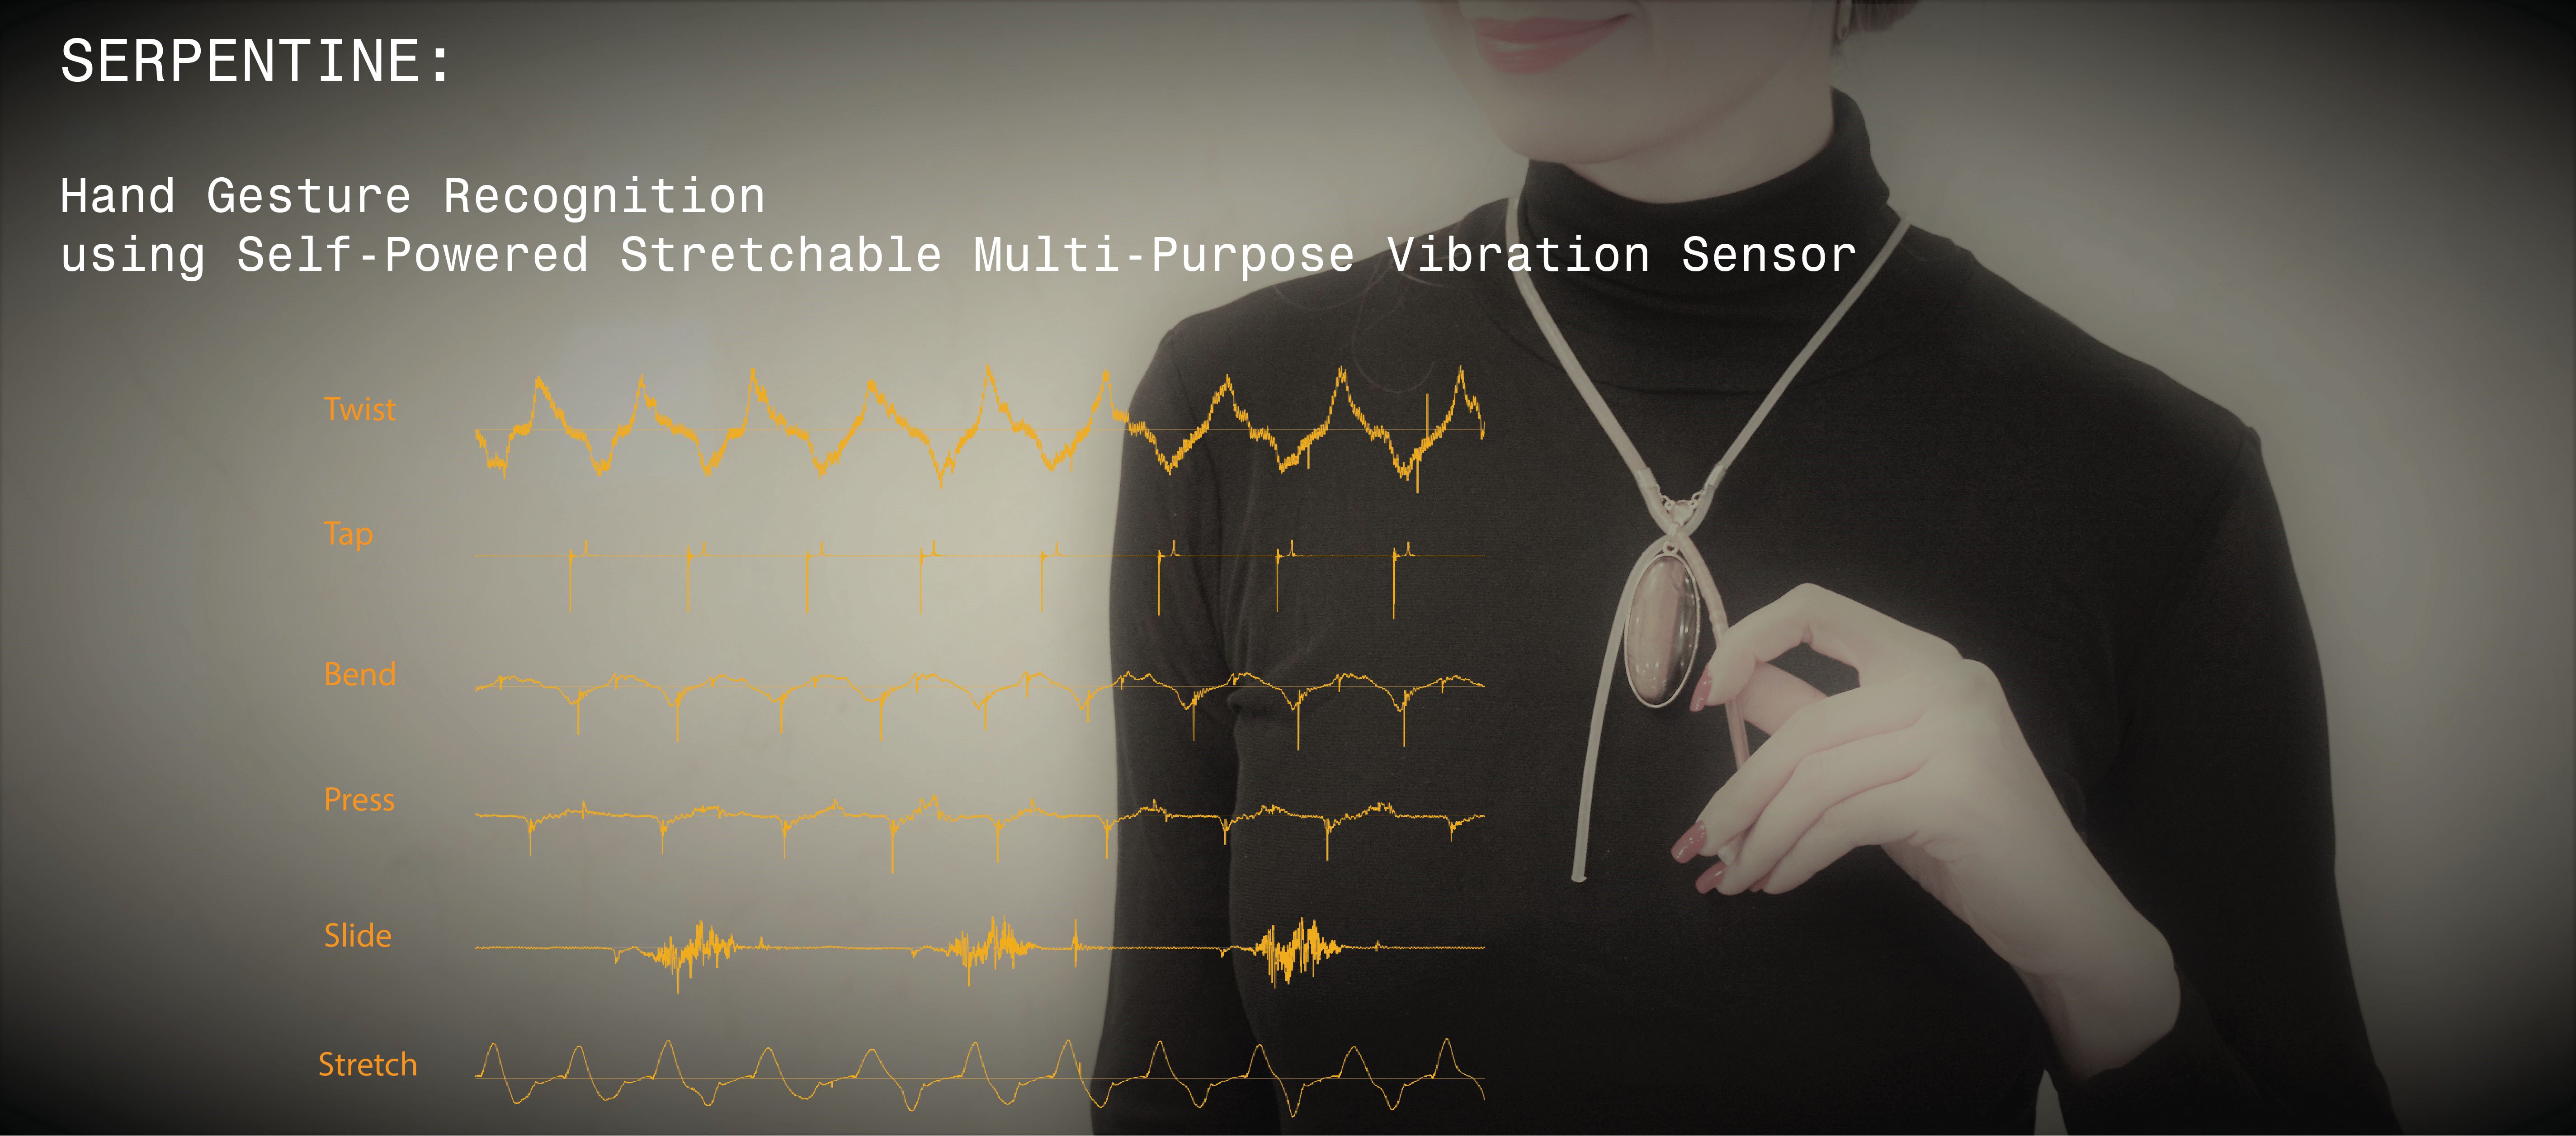
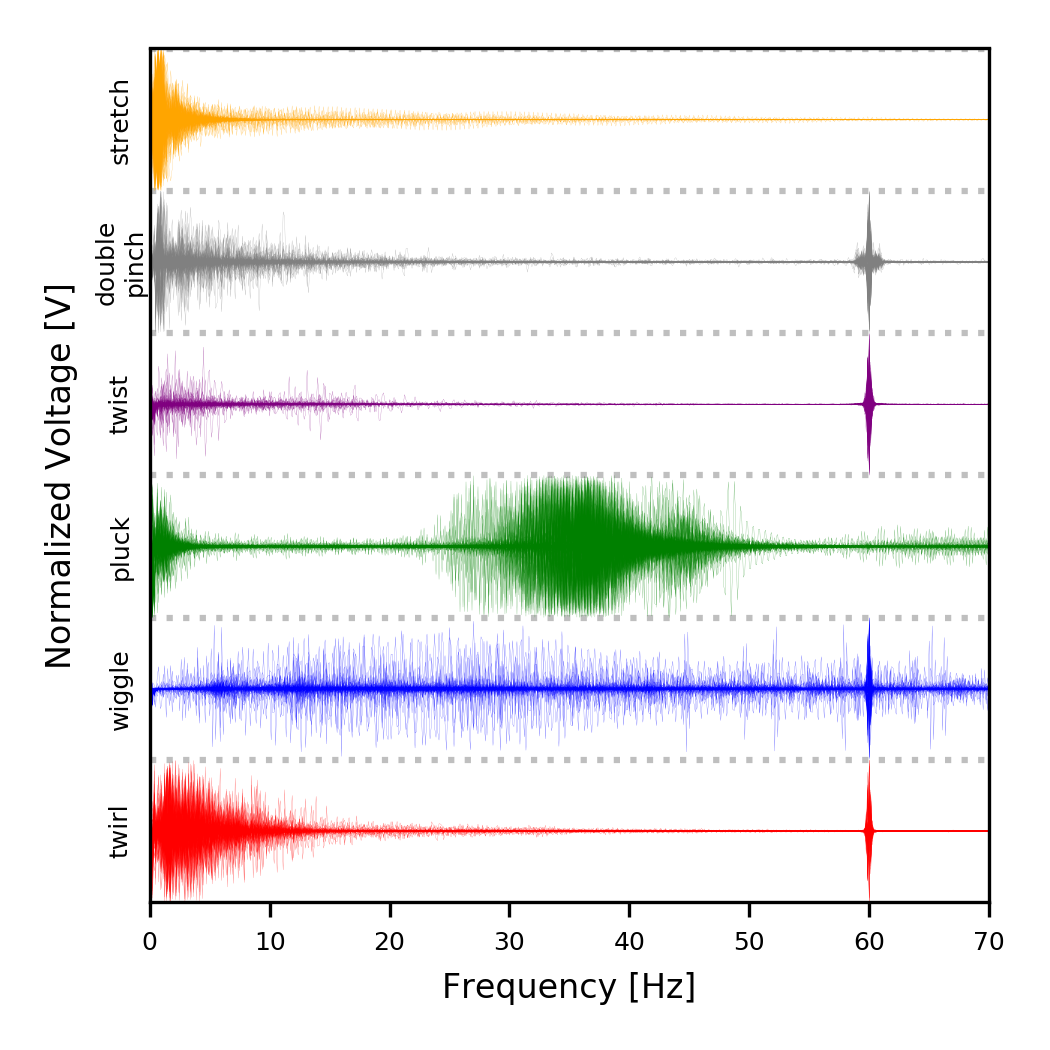
The simplicity of the physical structure of the sensor, universal availability of tribo-materials (all materials available in our daily life like paper, fabric, PDFE, PDMS and many more) and DIY approach for its constructions allow such a sensing interface to be scaled for variety of applications. Serpentine eliminates the need of bulky or rigid sensing instruments worn on different parts of the body. It’s specific material properties, form-factor and physical structure affords six natural gestures - pluck, twirl, stretch, pinch, wiggle and twist. Serpentine demonstrates the novel ability to simultaneously recognize these inputs through a single physical interface.
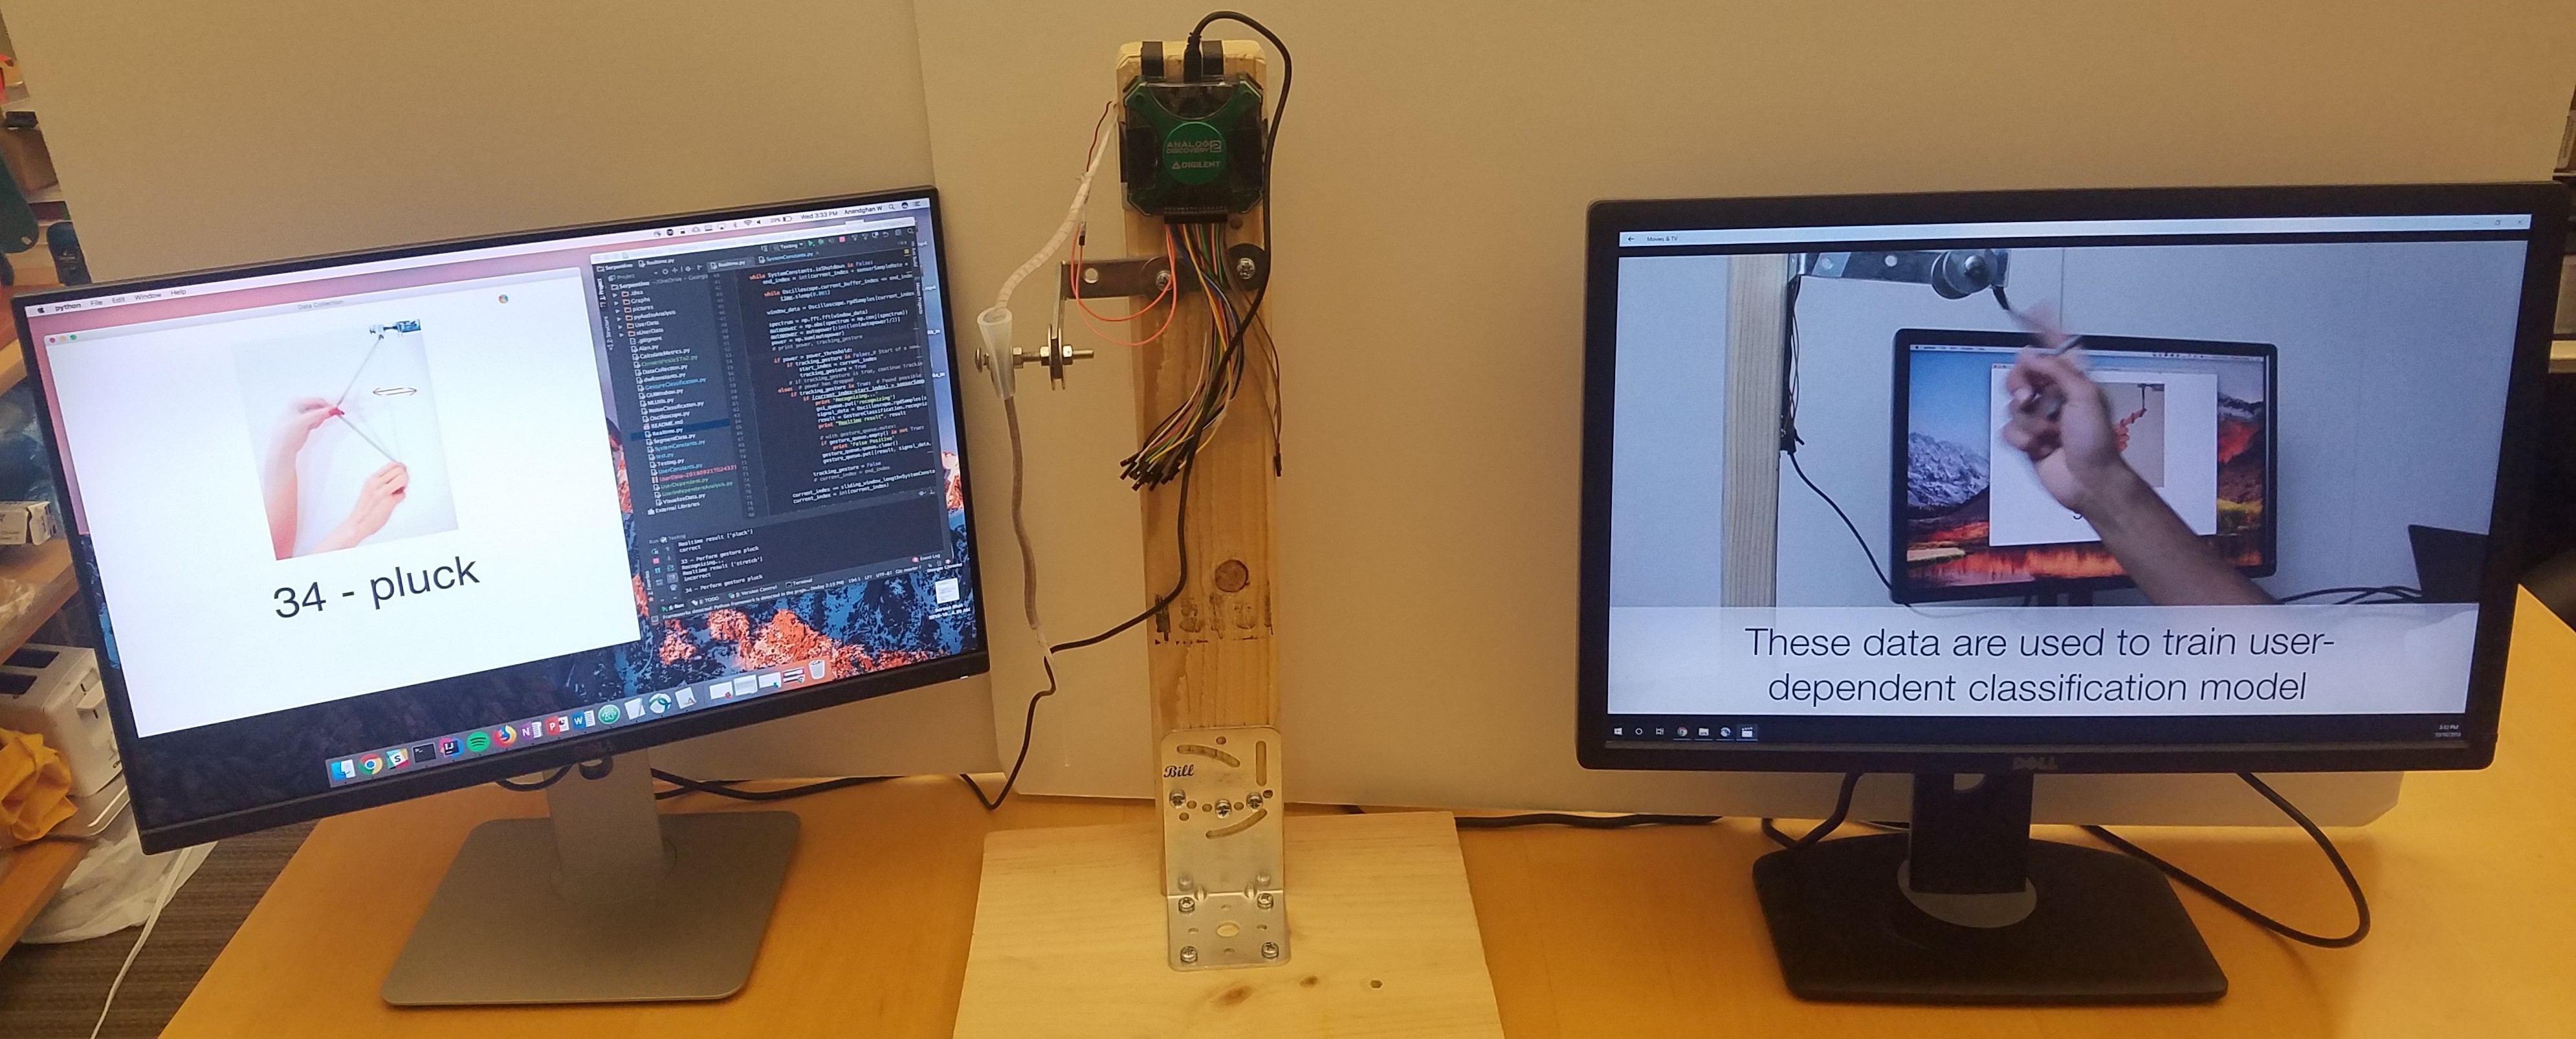
Our system is capable of accurate real-time gesture detection, which works well for both user-dependent and user-independent models. We cannot disclose the final experimental results, quantitative or qualitative results, obtained for Serpentine, as they are under review by the honorable scientific community presiding at the CHI Conference 2019. Upon acceptance, all results will be added to Hackaday 2018 project web page.
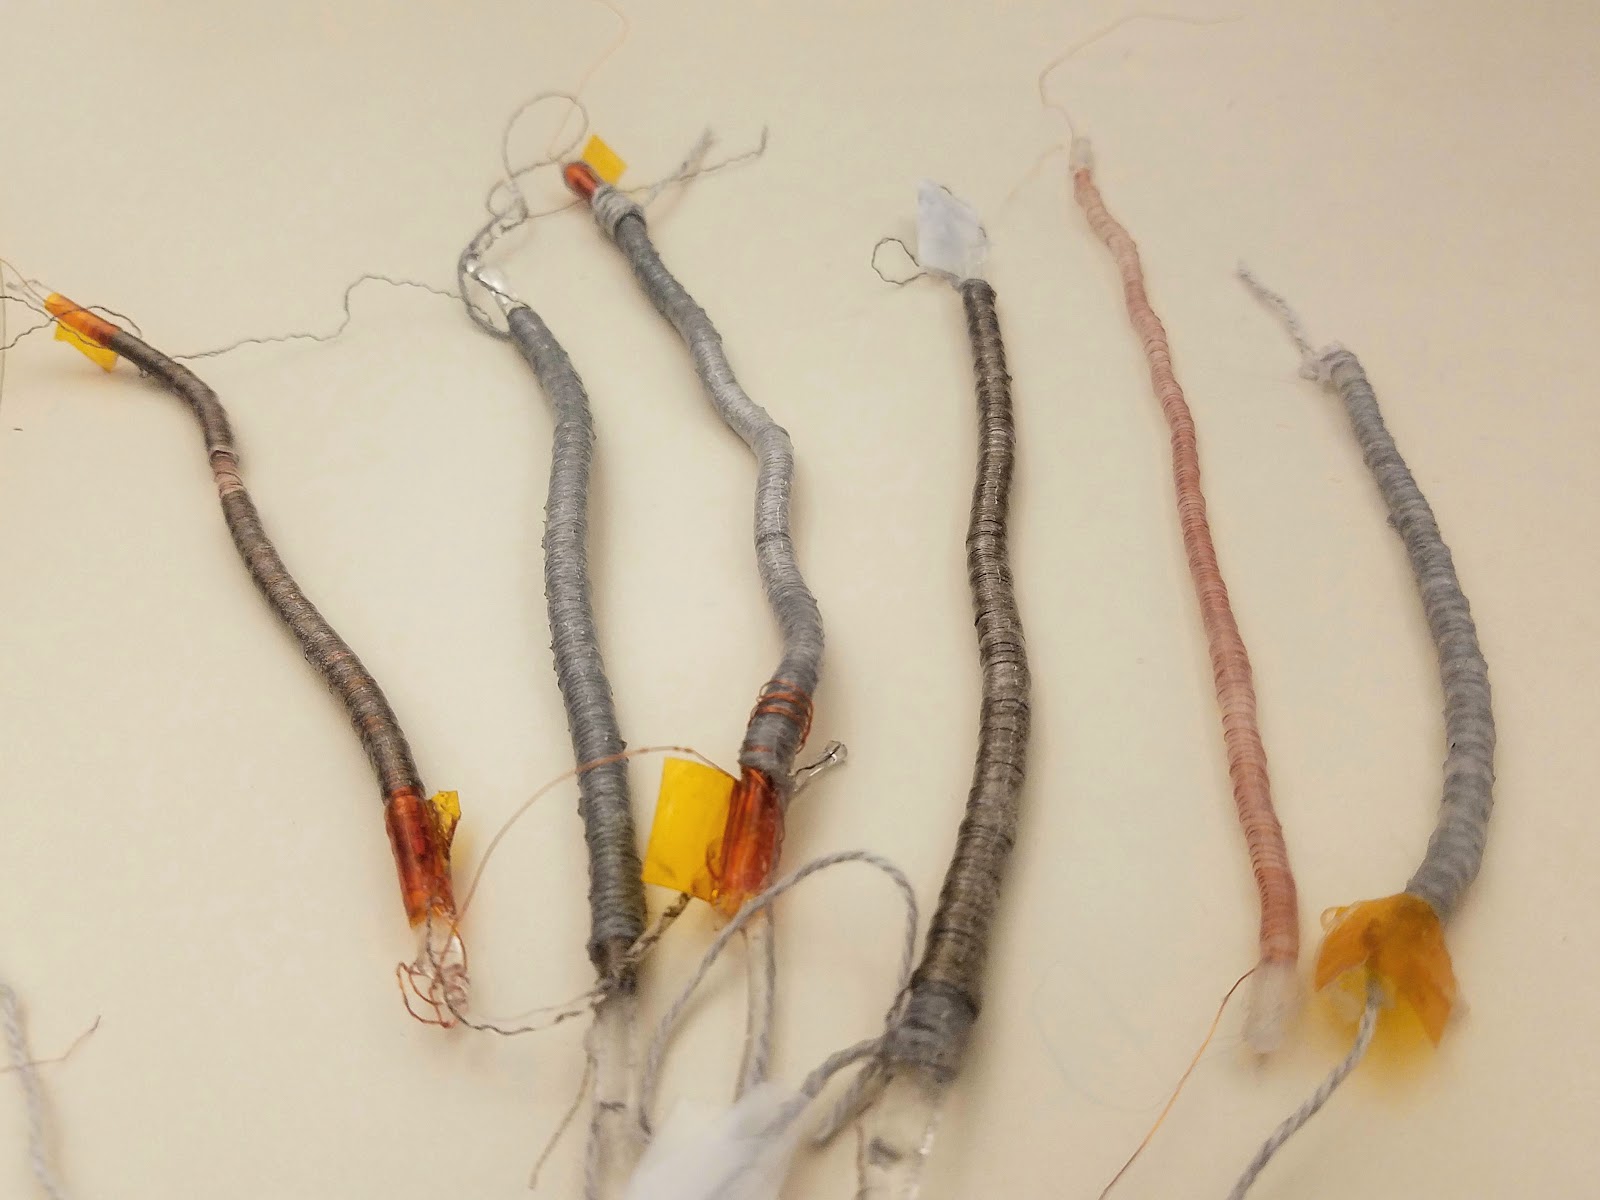
SERPENTINE - Working Prototype, Fabrication Process Sensing Mechanism and Gesture Recognition
Final Appearance of the Sensor


")


 PremJ20
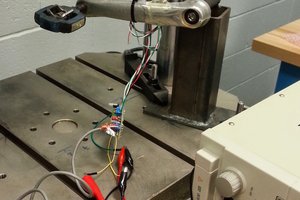

 Vignesh Ravichandran
 Facundo Noya