In this project log I will describe how I got my distance sensor assembly to work with ROS and how I displayed the scan data using RViz. In addition to this project log I prepared a short video showing the distance sensor assembly performing a 360° distance scan.
Test setup
The test setup consists of:
- a PC running Ubuntu 18.04 with ROS Melodic Morenia installed
- the Sharp IR distance sensor assembly connected to the PC via USB
- an „arena“ made from card board for the side walls and black paper for the floor
ROS
The ROS framework / middleware provides a rich toolset to develop, debug and analyse robotic applications of which my example uses just a small subset. The primary target is to learn how to prepare the distance scan data for use in ROS and once available on the PC how to display the data with the tool RViz. My setup consists of a sensor (IR distance sensor), an actor (stepper motor) and a debug tool (RViz). Data exchange within ROS is done using messages which are sent by publishing to topics and received by subscribing to topics. These messages can either be taken from a predefined set or newly defined if none of the existing are appropriate. Same is valid for topics while the typical use case is to define application specific topics. Thus the distance sensor assembly publishes its gathered data on one topic and subscribes to another topic over which it receives commands to control its behavior. These commands are generated on the PC. Instead of creating a ROS package I chose to use the program rostopic to publish the command messages. For ease of use I wrote a small GUI in python which encapsulates the calls to rostopic for the different commands. The package rosserial provides the interface between both systems and enables the embedded system to publish and/or subscribe to topics. It is integrated as a library into the software of the sensor assembly and used as an executable on the PC.
Embedded System
For the integration of rosserial into my embedded software I took inspiration and source code from the github repository of Itamar Eliakim. Accordingly I converted my MCU project from C to C++ as rosserial is written in C++. Furthermore I am using FreeRTOS to organize the program flow. Like described in a previous project log a distance scan value is obtained by sampling the analog sensor output 100 times at a sample rate of 1 kHz. This is now achieved by timer triggered A/D conversions with DMA transfer of the results to an array in memory. Currently these samples are averaged to provide one distance scan value. A further use could be to calculate statistics in order to evaluate the reliability of the sensor output, which is not the scope of this project. The averaged A/D conversion is transformed to a distance value in meters by using linear interpolation. A look-up table with values from my previous sensor qualification measurements provides in total 40 supporting points for the calculation.
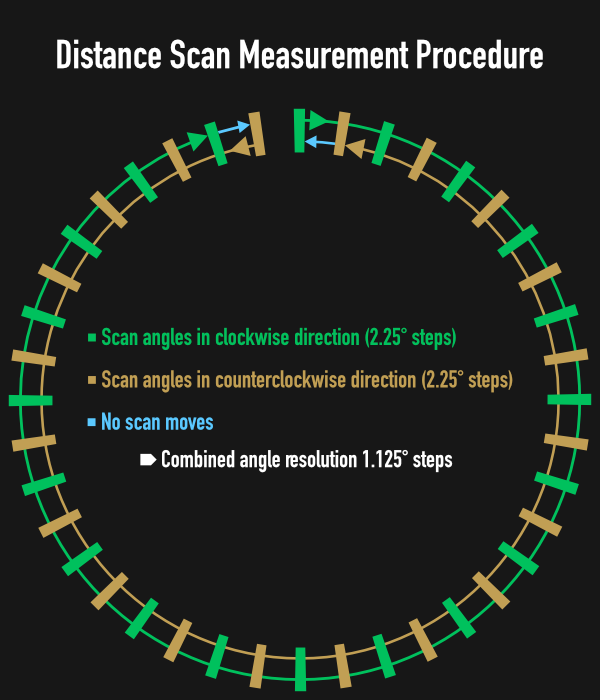
Performing one distance scan takes approximately 450 ms in the current implementation, mainly due to positioning and A/D conversion, which is quite slow. This lead me to design the following measurement procedure as a compromise between angle resolution and 360° full scan duration. In general the stepper motor turns the sensor by 2.25° between each distance scan. The total angle resolution is enhanced to 1.125° by interleaving the scan positions in clock- and counterclockwise direction. Turning the sensor in clockwise direction covers the angles 0°:2.25°:357.75° while the angles 358.875°:-2.25°:1.125° are scanned in counterclockwise direction. Using this procedure it takes 72 seconds to get a coarse overview of the environment which is improved after another 72 seconds.

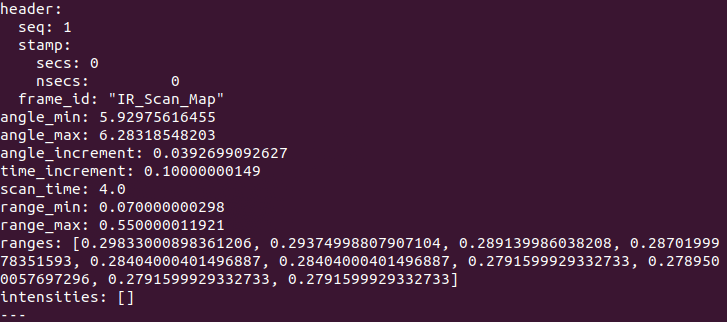
Measurement results are provided to ROS using the LaserScan message out of the predefined sensor_msgs message set. Its content can be divided into three portions. The first is the header to declare the message for ROS in terms of time stamp, sequence number and most important the frame ID which will be necessary later on for the visualization in RViz. In the second portion the capabilities of the system like scan range (min/max) and time between scans are specified. The last section is where the measurement data goes. An array of float values stores the scanned distances and the variables angle_min, angle_max and angle_increment define between which angles the distance values were taken. I limited the array to 10 scans in order to save memory ressources on the microcontroller as well as to have the scan data quickly available within ROS. Once filled the LaserScan message is published on the topic IR_Scan which is registered in ROS on startup via rosserial.
Finally the embedded system registers a subscriber to the topic start_ir_scan to receive command strings published on the PC using a String message out of the std_msgs messages set.
PC
Several programs need to be started on the PC to get everything working under ROS.
The first step is to start ROS by running:
roscore
Next rosserial needs to be activated by running:
rosrun rosserial_python serial_node.py /dev/ttyACM0
Once started the proper functioning can be verified by listing the available topics:
rostopic list -v
The output of this command shown below contains IR_SCAN in the list of published topics with one publisher and start_ir_scan in the list of subscribed topics with one subscriber meaning everything is started correctly.

Controlling the sensor assembly out of ROS is fairly straight forward as the command rostopic can also be used to publish messages. For example the following command initiates a 360° scan:
rostopic pub start_ir_scan std_msgs/String „CSCAN 1“ --once
A small python program wraps rostopic with different string messages. It offers performing a homing cycle, running a complete 360° scan or aborting the current action.

Shortly after starting a scan, distance data is published on the IR_Scan topic. This can be checked by running:
rostopic echo -n1 /IR_Scan
Which results in the following output:

Visualization
Now that the distance scan data is available within ROS the next step is to start and configure the tool RViz which starts with the following command:
rosrun rviz rviz
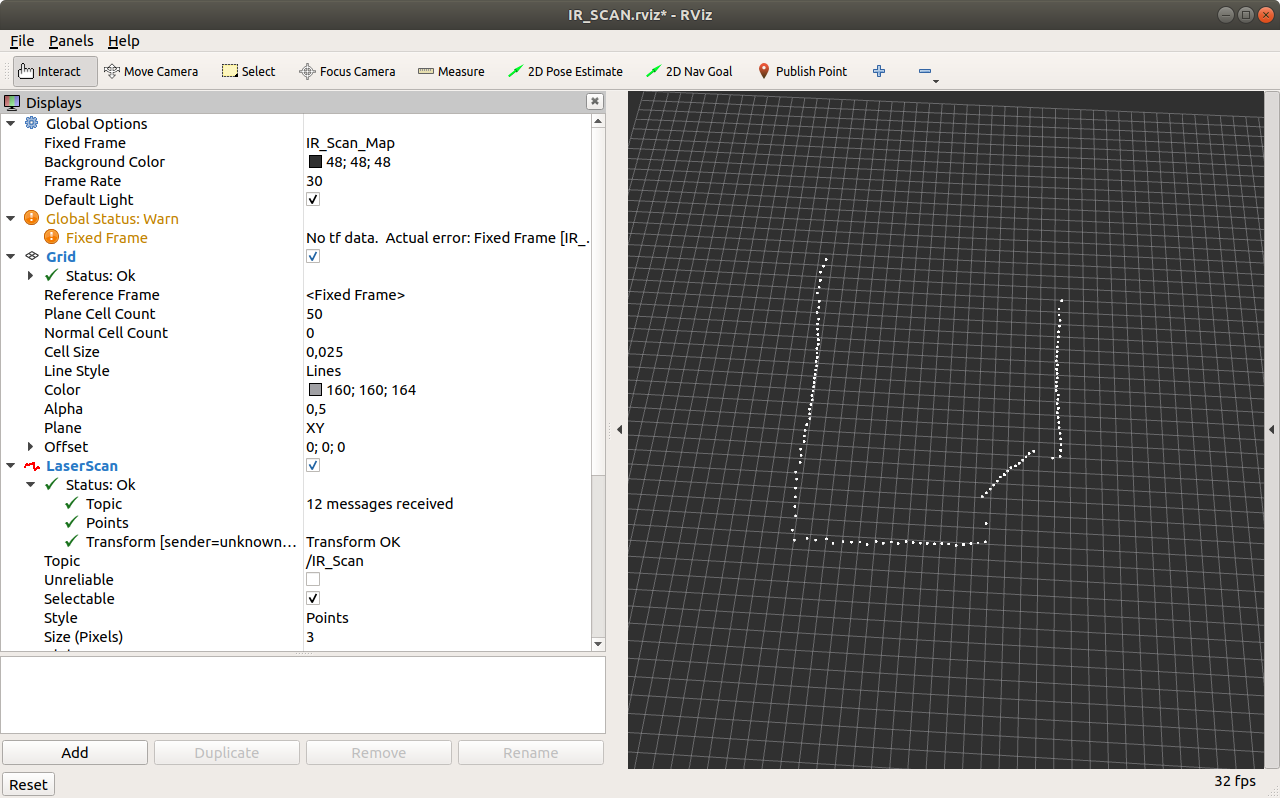
Several parameters need to be changed or added to display the measurement data in RViz. First the grid needs to be adapted in terms of cell size and cell count to fully display the measurement data. Next a visualization for the LaserScan message has to be added by clicking on Add at the bottom of the window which will open a list of visualizations. After adding a new entry named LaserScan appears in the list on the left in which several parameters need to be adapted. The Topic has to be changed to IR_Scan, which can be chosen from a dropdown list. Furthermore I chose Points for the parameter Style with a Size of 3 pixels and 180 seconds for the Decay Time to keep the measurement points visible on the screen for more than one complete scan. The final step is to rename the Fixed Frame under Global Options to the frame ID IR_Scan_Map of the LaserScan message provided by the embedded system.

With these settings applied, distance scan data appears on the screen building up a representation of the surroundings of the distance sensor.
Finally if you want to see everything in action you can follow the link to see a small video of my sensor assembly in the „arena“ performing a complete distance scan.
Discussions
Become a Hackaday.io Member
Create an account to leave a comment. Already have an account? Log In.