 Lex Kravitz
Goal: To create a simple and intuitive visualization for viewing neural states over time.
Method: We extract the first 2 principal components (PCs) from the dataset and plot them against each other in an XY scatterplot. We then plot the density of the scatterplot as height on the z-axis. This results in a contour plot that describes the population activity of these neurons across a given time window. We also animate a point that demonstrates where the population is at any given point. We further plot a continuous variable (ie: speed of a mouse) as a different hue on top of the plot, which allows for comparisons between the neural state and this variable.
Interpretation: The interpretation of these plots is currently open to... interpretation. Some ideas that we are exploring include:
- The number of peaks reflects the number of "attractor points" in a given network of neurons. These are states that the neurons will gravitate towards.
- The "compactness" of the peaks relates to the variance in brain state - low variance will create compact peaks, high variance will create diffuse peaks.
- The frequency that the system switches states may reflect attention or focus (or lack thereof)
- Changes in the landscape shape may reflect learning
This is an in-progress visualization, and will be updated as we continue devleopment. However, we encourage downloading and playing with the current code.
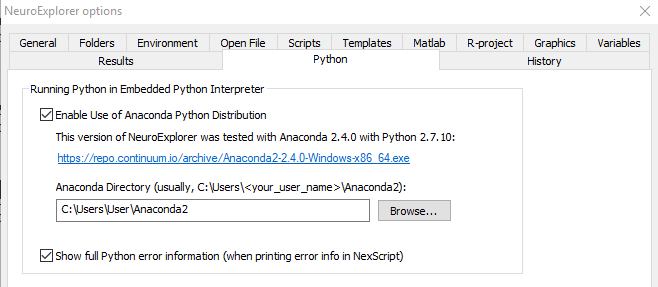
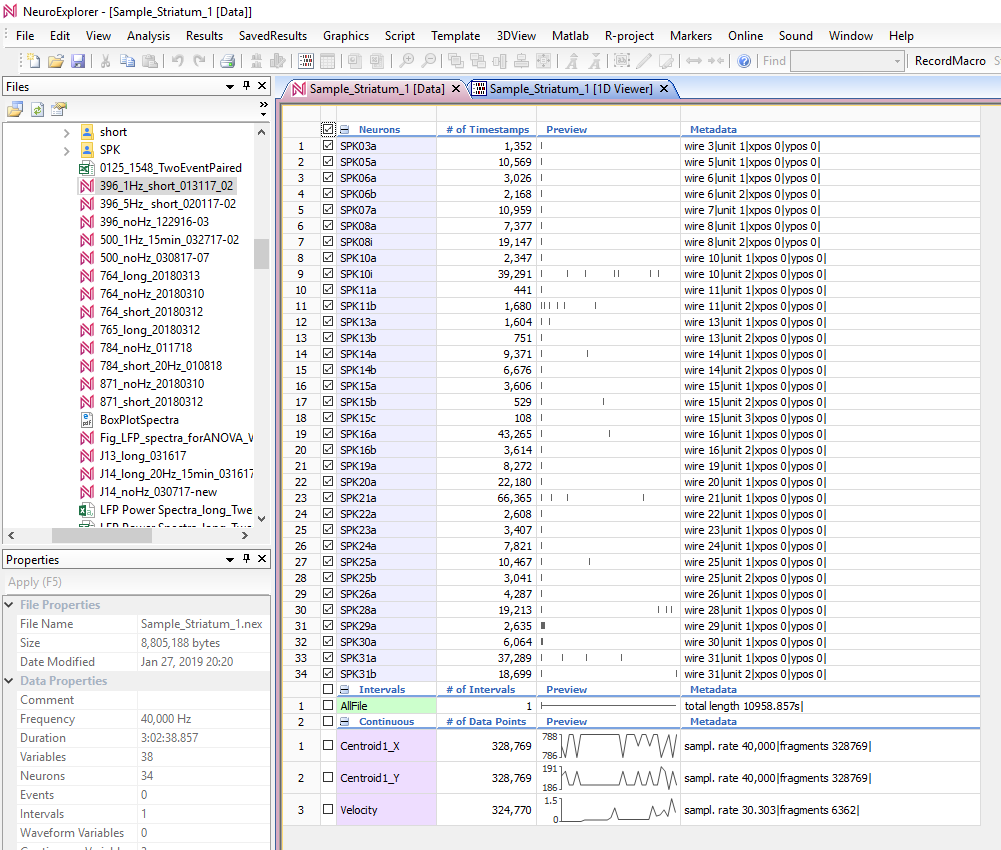
Limitation: The current implementation requires a commercial piece of software, Neuroexplorer. Future iterations will hopefully remove that dependency, but this depends on how much time I have to make this happen. if anyone wants to help speed this development up please get in touch!


 Daphne
 suikale
 Bruce Land