 Capt. Flatus O'Flaherty ☠
Features:
- Wind speed
- Wind direction
- Humidity
- Pressure
- Temperature
- Battery volts
- Soil moisture and temperature
- Rain (even in deep sleep)
- LoRa connectivity
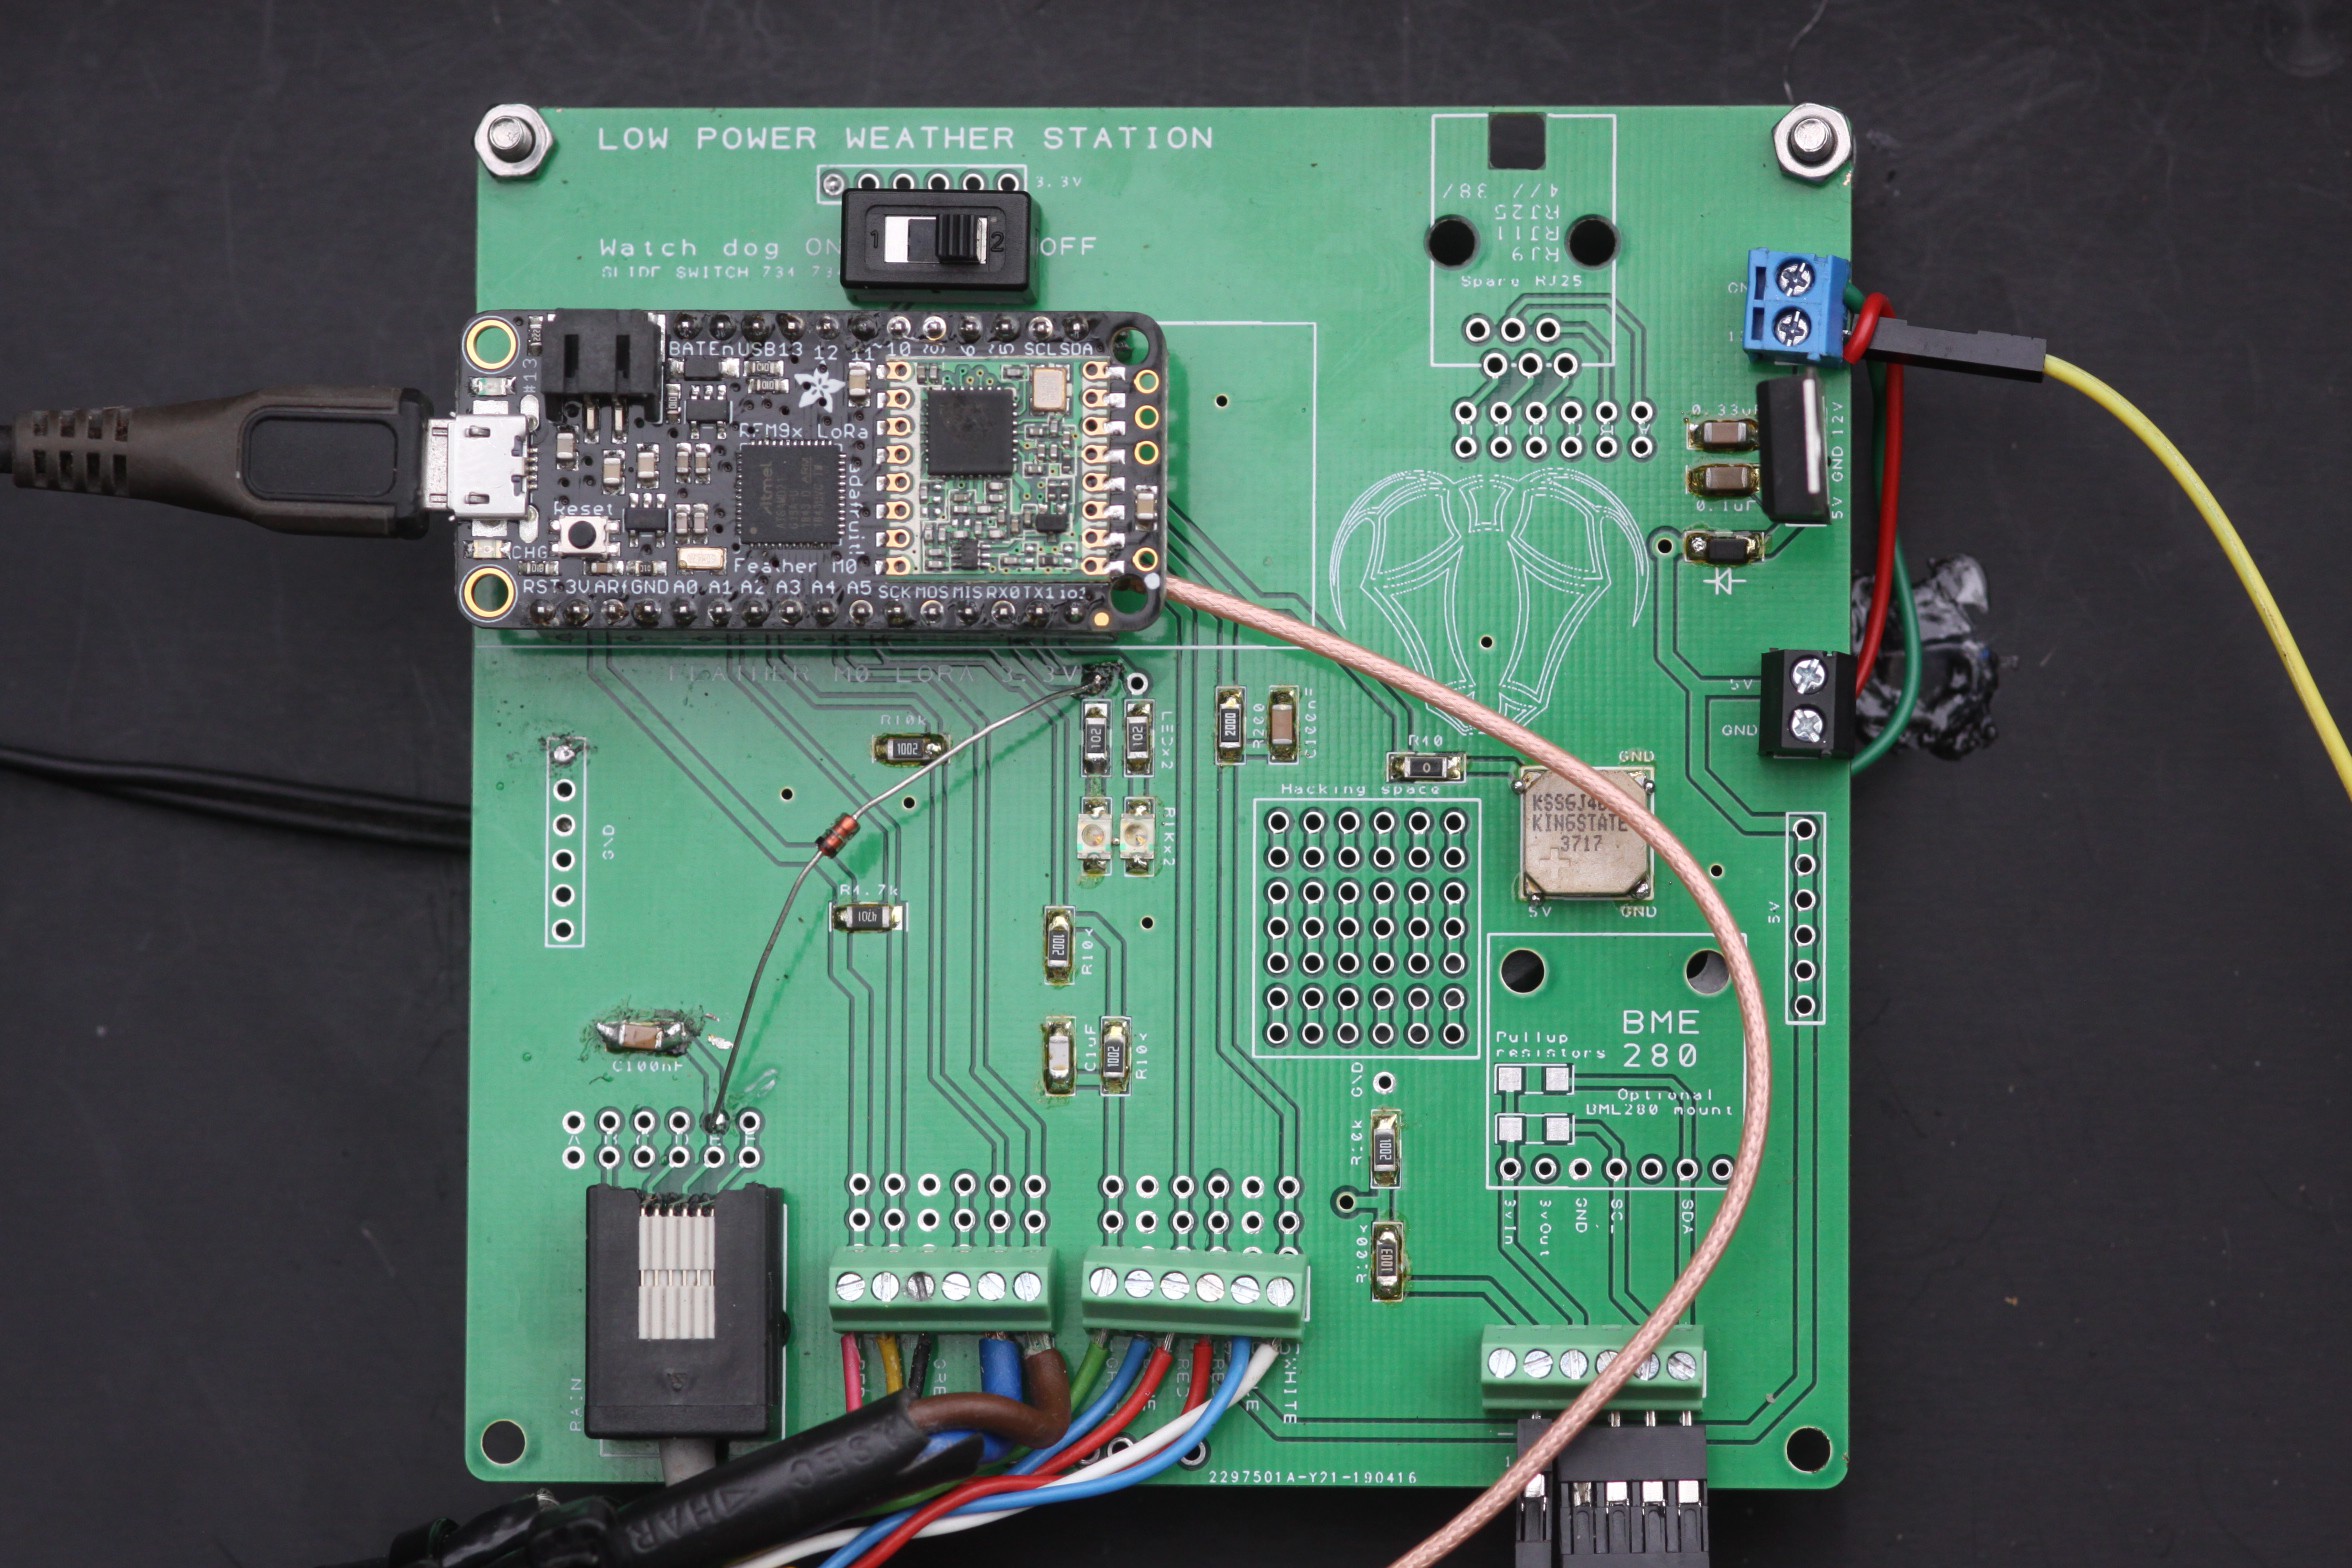
- Adafruit Feather M0 MCU and radio module
- MCU watch dog (auto reset if MCU crashes)
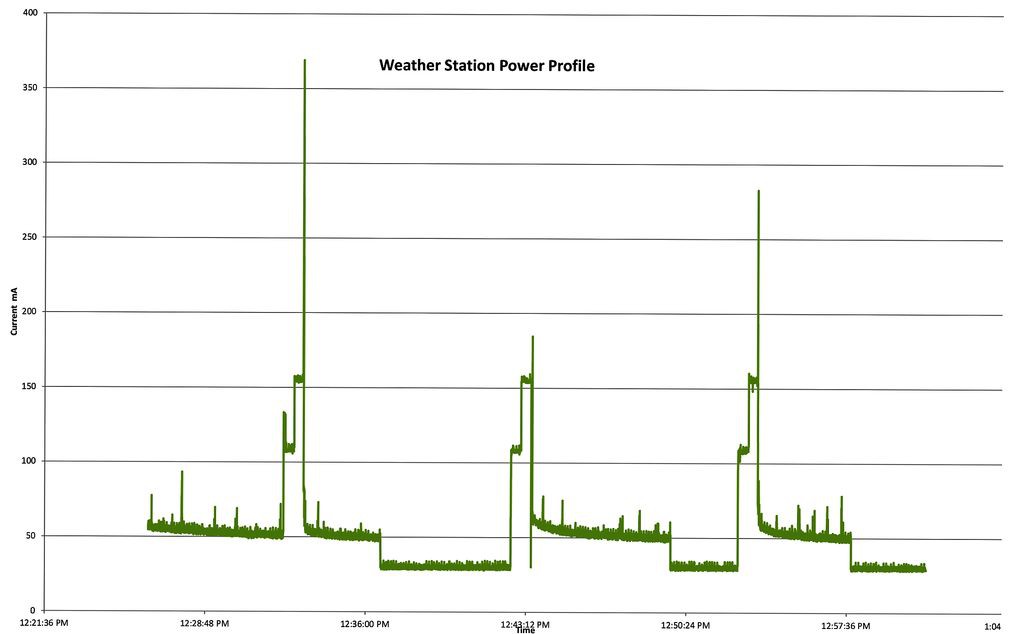
- Full Deep Sleep (everything is turned off between taking readings)
- Arduino IDE (easy to program)
- Hacking zone for extra circuits
- Spare RJ25 slot for cheapo wind instruments (if you really must).
- Server based PHP driven GUI
My previous version of a weather station used 2G GPRS for the data transmission which proved to be very power hungry and, even with a 40 watt solar panel, went dead during the dark months of December and January. The other problem was that, every now and again, the GPRS server would decide to kick the sim card off the network which sometimes required the card to be removed, inserted into a normal phone and an 'upgrade' downloaded. Moving to 3G or 4G would not solve these problems, even though 4G is far less power hungry.
I decided to create a new version of the control system based on LoRa technology which could potentially send data straight to a LoRa gateway if one existed. Unfortunately, I live on an island in the middle of nowhere so there's no chance of a gateway in the foreseeable future so I had to build a LoRa receiver as well.
Other than power requirements and data transmission, the main focus of this project is getting accurate wind measurements using high grade instruments and sensible positioning of those instruments up the top of a pole.
So why use these expensive wind instruments?
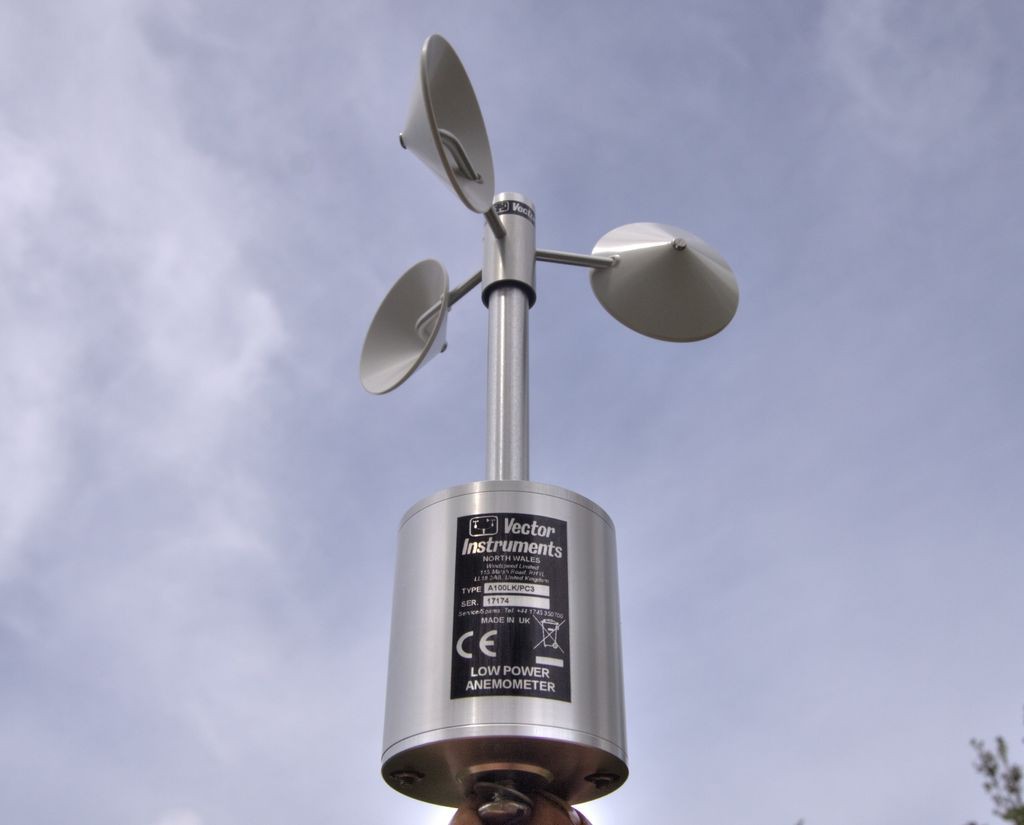
The generic wind vanes use eight sets of resistors to give a basic resolution of 45 degrees which can be further refined by using averaging, but wouldn't it be great to have 360 degrees (or better) resolution? The generic wind anemometers are 'ok', but don't last very long before the bearings need changing and are not calibrated so we have no idea how accurate they are.
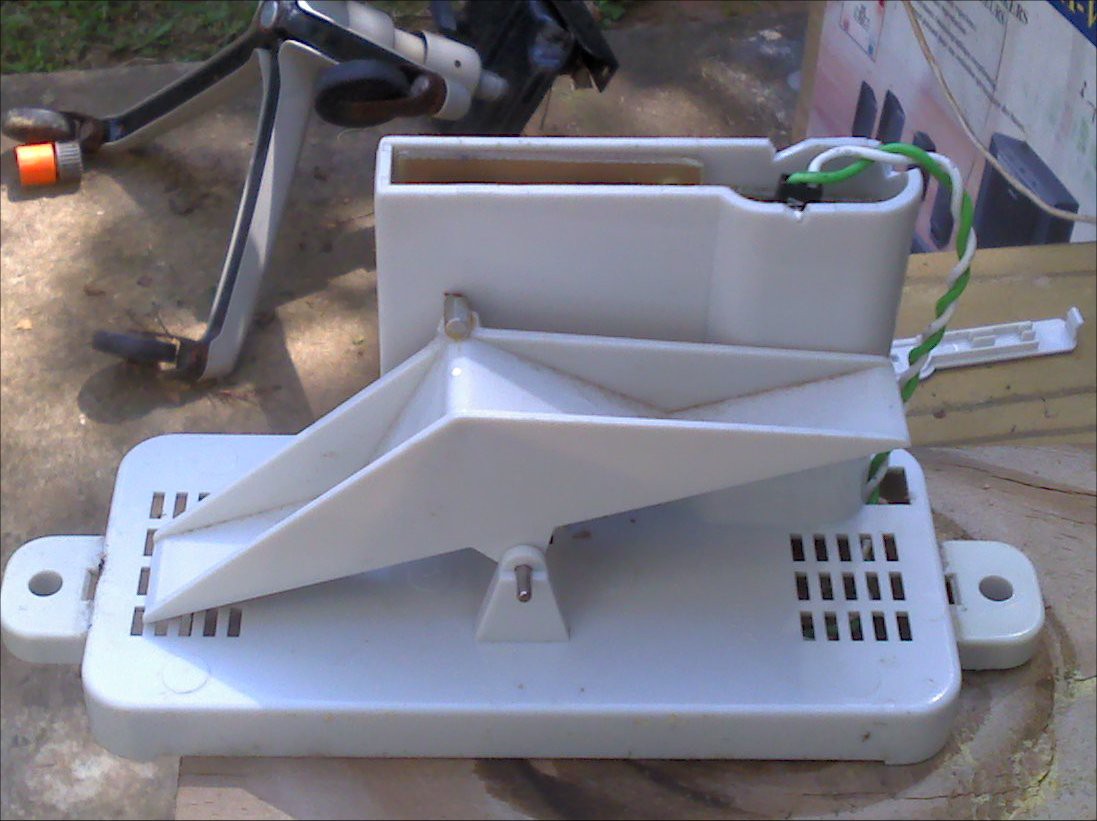
On a positive note, the cheap generic rain gauges are actually very good and having tested them for over 3 years, the only problem was spiders running up and down the rocker arm playing some kind of game of chase and then getting bored and creating a web to seize everything up. They just needed a quick clean every six months or so.
One of the things that worked really well in the previous version of this weather station was the code for the wind instruments. The anemometer was relatively simple to implement as I could use a simple 'pulsein' command although, technically, this is 'blocking' and will introduce an unwanted delay in the code speed. Also, the rain gauge could theoretically interrupt the pulsein midway during the process causing an error so pulsein is wrapped in 'nointerrupts'. We could still miss rain readings, but this is helped by the fact that the gauge triggers twice per reading so we can filter for one or two interrupts in the code, dramatically decreasing the chances of missing a reading to 'almost' zero.
The wind vane is far more complicated to code as it relies on polar coordinates (0 to 360) which means that normal oversampling and averaging using the 'mean' is not possible. Think of the situation where the wind is blowing from the north ...... one moment we get a reading of say 2 degrees, the next a reading of 355 degrees which would give a mean value of approx:
(2+355)/2 = 180
To overcome this I had to use 'mode', which necessitates creating a large 1D matrix of possible values and then evaluating which ones were most common over a particular time period. This required a bit of tuning as if the resolution is too large and the number of samples too small, the mode value never gets bigger than zero. For convenience, I used a 1 x 360 matrix and filtered the sample rate until I got a mode value of about 5 in a steady wind. This means that, for example, a direction of 237 degrees was detected in a particular time frame 5 times.
Whilst this problem itself is relatively simple, it was compounded by the fact that the wind vane has a dead zone of about 2.5 degrees around north and trying to take readings in this zone can end up with 'spurious' results. Basically, the wind vane is a low torque potentiate but we get a 'cliff edge' phenomenon where the winding and wiper bridges from max to min. This is fixed by using a 'load' or 'pull down' resistor and then making calculations for the ensuing non-linearity. More details regarding non-linearity calculations are here: https://github.com/paddygoat/Weather-Station/tree/master/Wind_Instruments_Calculations
Finally, when we have got all the data trundling it's way into the interweb, we have to process it into something meaningful with pretty gauges and dials:
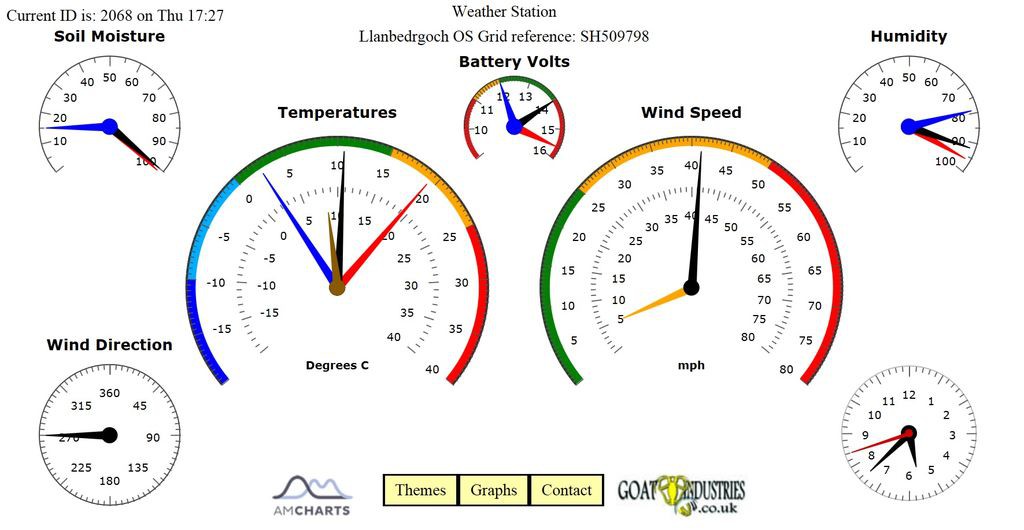
This part of the process uses various PHP and Java scripts and a database on a server hosted by United Hosting in London.
Apart from the more obvious challenges, there are other intricacies associated with data transmission such as filtering out other transmissions that might be received from elsewhere on the same frequency and using a call back routine to tell the weather station that the server has correctly received the latest batch of data so that it can move on to the next set. There are also filters used on the server side, just in case the server gets, for example, a whole set of zero values and tries to upload these to the database.