Introduction:
The MQ-4 gas sensor is a great sensor to use for methane/natural-gas (CH4) sensing applications. If you're buying from Sparkfun, the datasheet on the product page is from Winsen. However, if you're like me, you'll google "MQ-4 sensor datasheet" and look at a couple that pop up. Doing this, you'll find another datasheet for the MQ-4 sensor from a different manufacturer Hanwei. Upon initial inspection of both datasheets, you'll notice that the sensitivity curves from both manufacturers are completely different. But how different are they?
Side-By-Side:
Per both datasheets, the transfer curves show a somewhat linearized logarithmic relationship between PPM and Rs/Ro (check out the links above). Here they are on "standard" axes:
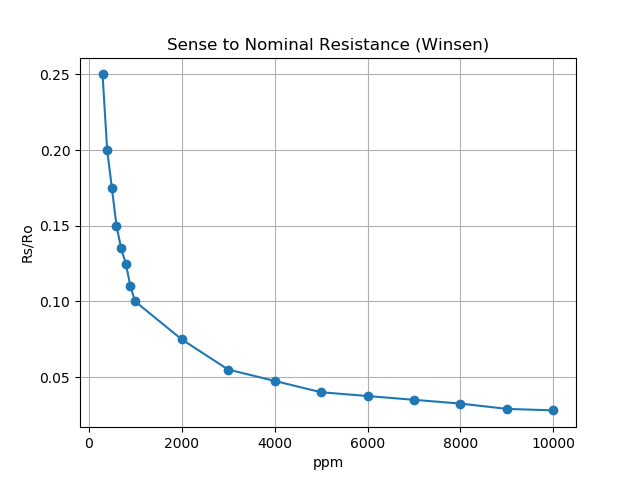
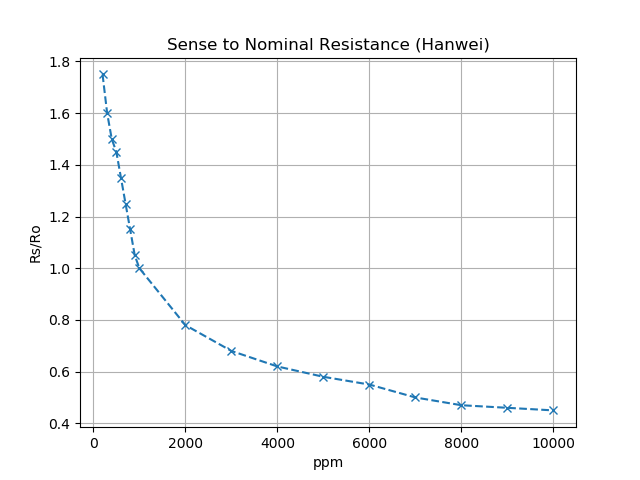
They are both decaying exponential curves by behavior and upon initial inspection looks like they may just be offset with respect to one another, but let's look closer.
Normalized Curves:
By taking the max value from its data set, and dividing each data point within that set by the max, we remove the impact of offset in data so we can focus purely on the behavior. It can be seen that both transfer curves differ significantly as PPM increases:
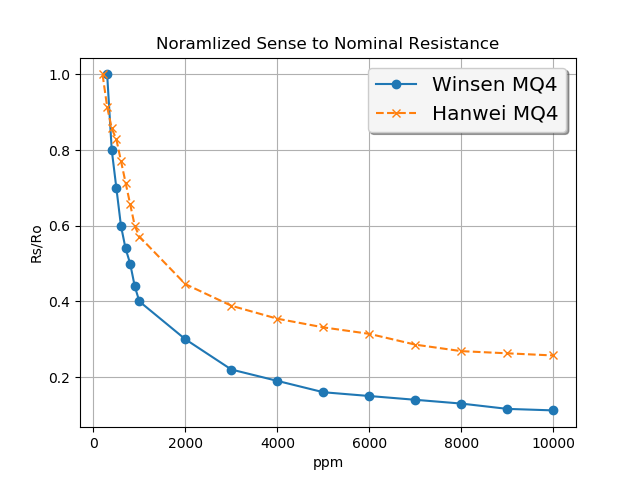
As higher concentrations are reached, the Winsen sensor differs from the Hanwei sensor by about 30-40%.
The Difference Explained:
The difference in data between manufacturers may just be due tolerance, and the sensors may be identical between manufacturers. The datasheets do not specify a tolerance at room temperature (among other things that would be nice to know ;)), so this may make sense. However, if we focus our application to use lower concentration values in the linear region (between 200 to 1000 ppm) the difference may be negligible enough so we don't need to spend money on expensive calibration gas.
Moving Forward:
I'm going to play around with this sensor a bit. As I stated before, I'm going to use this sensor in an another project, so stay tuned.
That's all for now folks! 'Til next time!
 Mario Frei
 Kacper
 staticdet5