Close
0%
0%

Mini Audio Equalizer

A graphic equalizer that fits in your pocket!

Similar projects worth following
This project connects between an audio source such as a laptop and a pair speakers. It lets the user adjust how the audio sounds using three instruments 1.) a three-band equalizer to amplify or attenuate low, mid, and high range tones 2.) a dynamic range compressor to level-out any abrupt changes in volume 3.) an amplifier to strengthen any quiet signal sources.This project originated from another 3-band equalizer I made about a year ago (https://hackaday.io/project/161227-graphic-equalizer). I've decided to revamp it here because it was received well by my friends and I want to see if I can improve the design. I've been cajoled into building a couple for friends when I'm finished and, depending on how well it turns out, I might even sell a few.

First - why it matters: Although most people probably don't care about countering sculpted frequency responses in speakers or compensating for abrupt changes in volume, those who do don't have a ton of options to address these issues unless they are willing to shell out plenty of cash. Commercial headphone amps, compressors, and equalizers don't come cheap. This provides a comprehensive and inexpensive solution.

The original plan was to redesign it pretty much from scratch and incorporate a dynamic range compressor to level any changes in volume. The general problem this product solves is one in which your audio source's volume is erratic, there is too much power in one region of the audio-frequency spectrum, or your speakers have a non-flat response you wish to correct. For the product to be convenient and easy to use while maintaining functionality, it must meet the following design specifications:

  • Battery powered
  • Reasonably inexpensive
  • Ability to mount inside a commonly available COTS enclosure
  • Small form factor
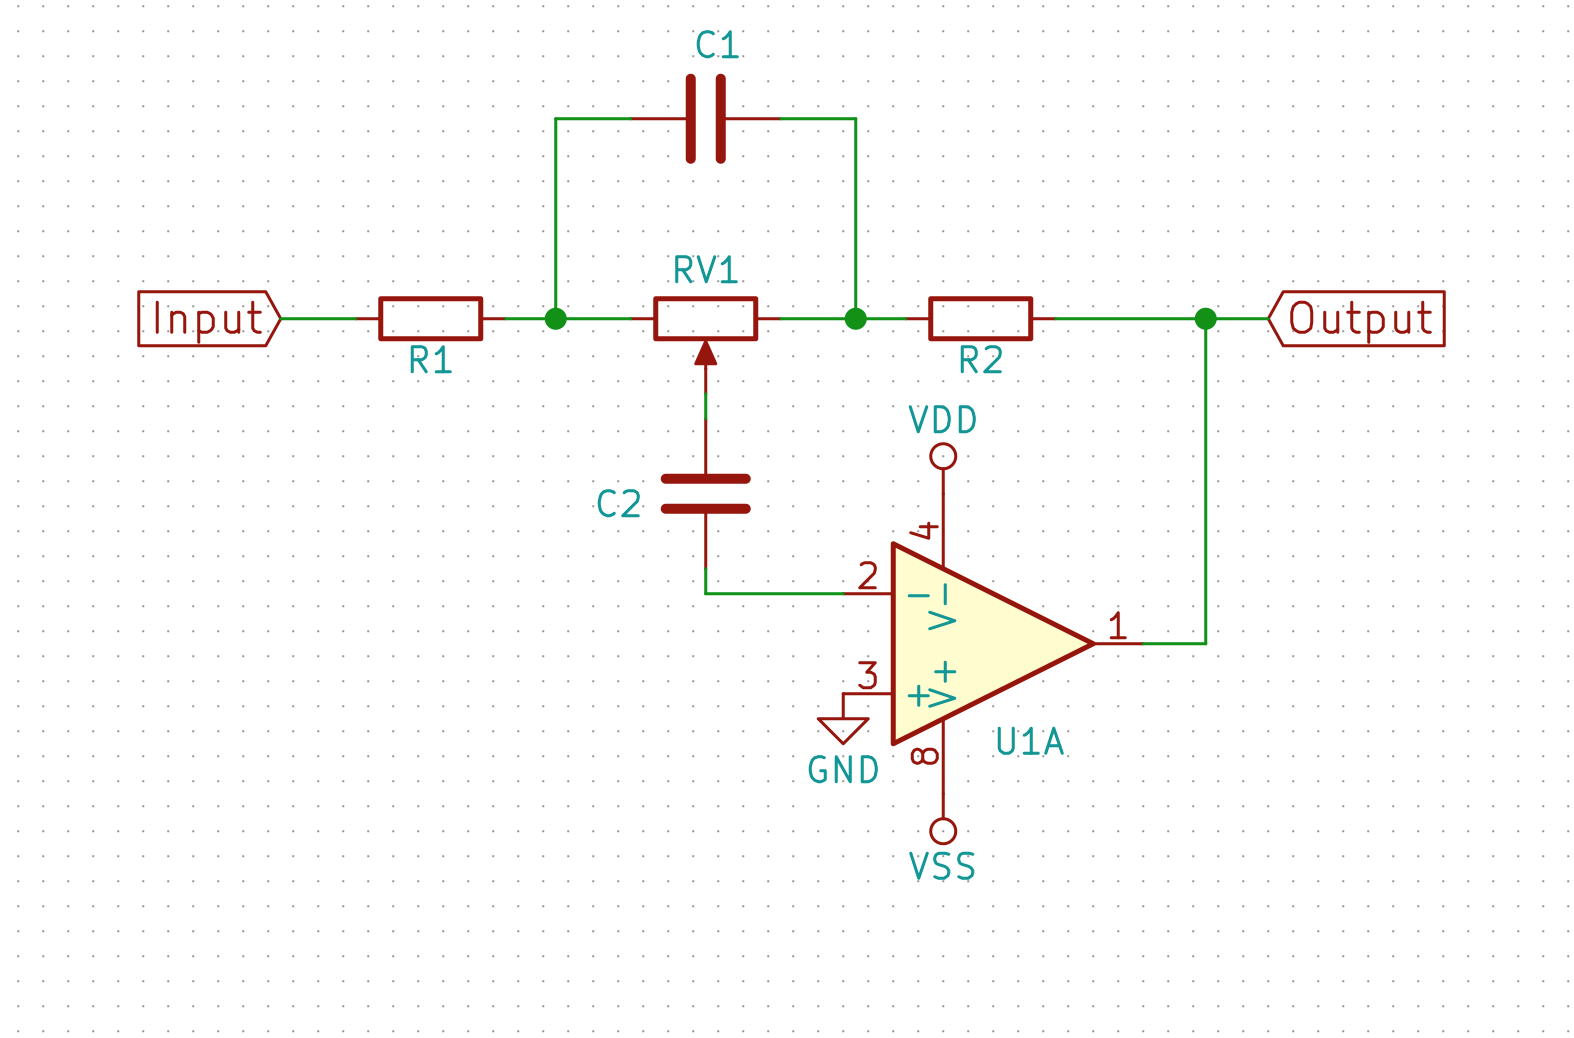
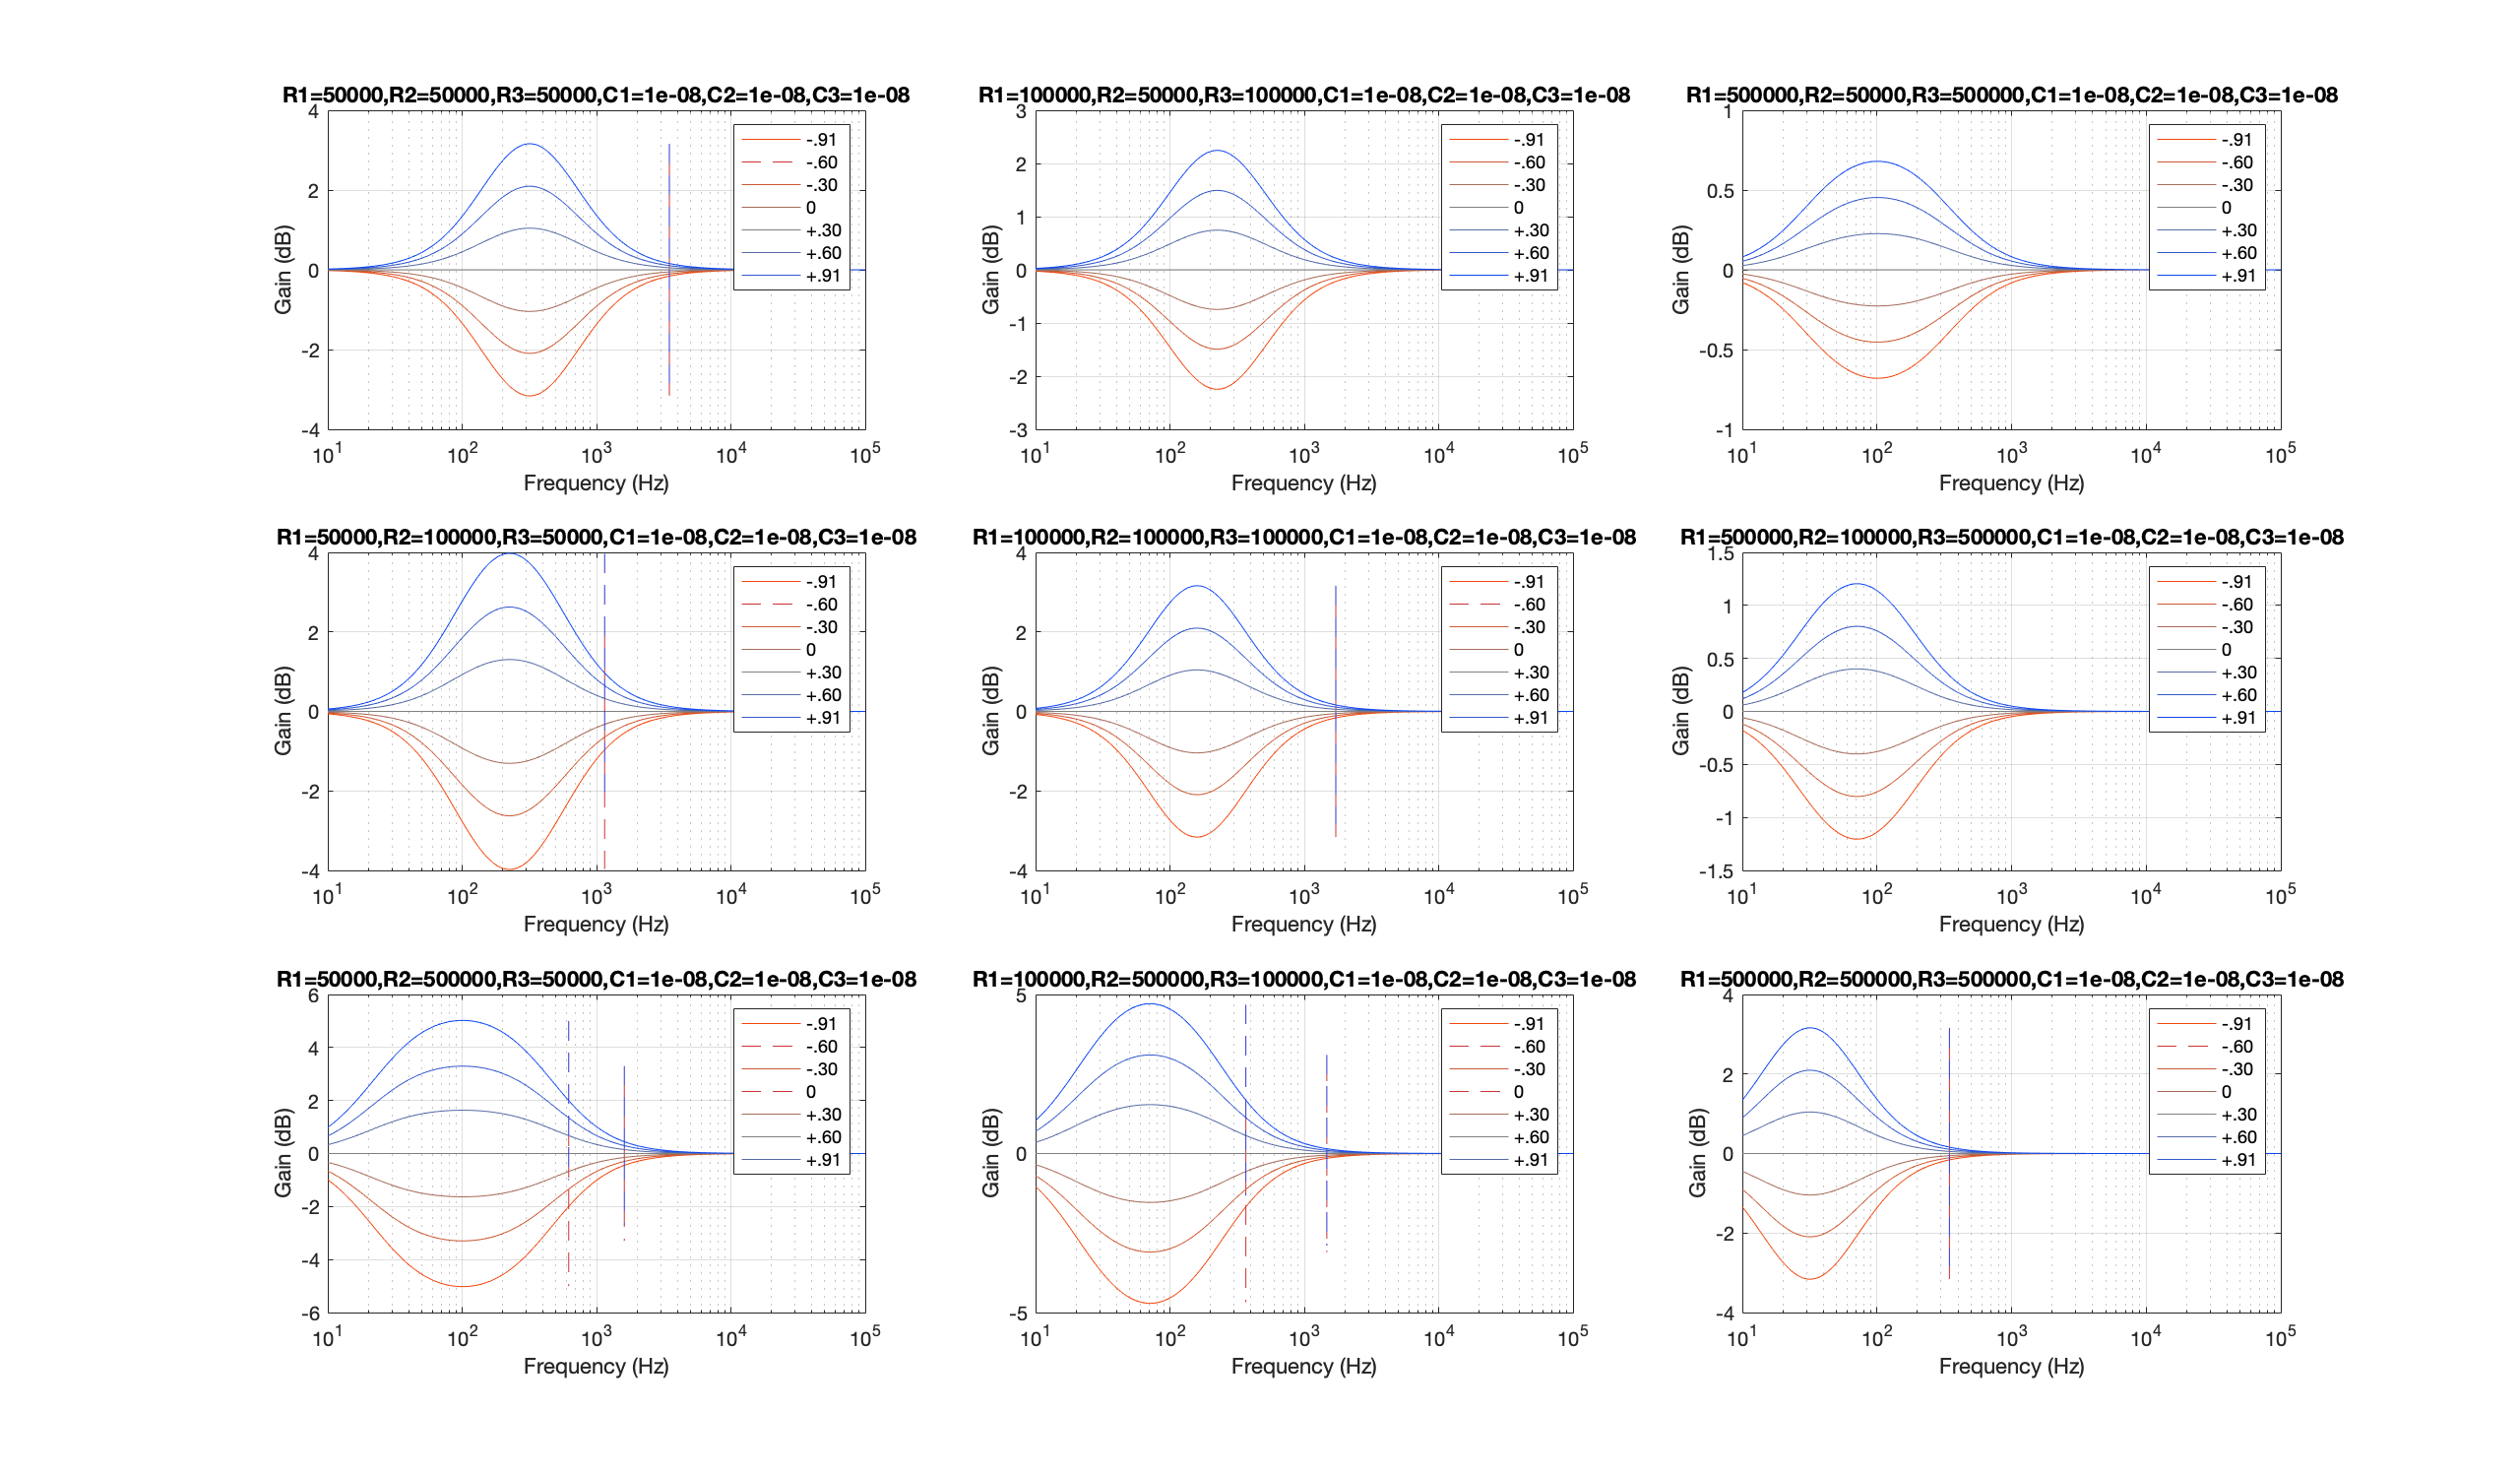
  • Equalizer with carefully-selected center frequencies and Q-factors to select frequencies commonly noticed in music
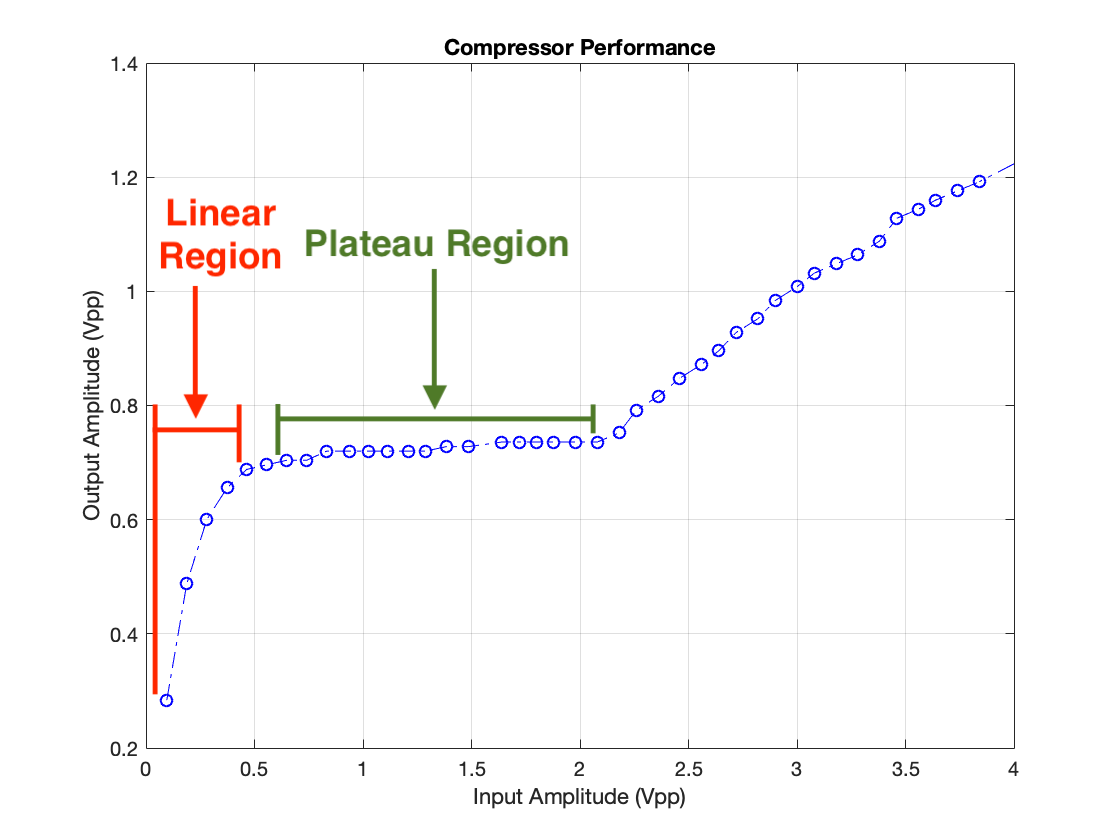
  • Compressor with a sufficiently high ratio to eliminate noise spikes from microphone scruffs or feedback, television ads, loud vs. soft radio channels, etc.
  • Master volume knob to conveniently set the output volume or boost quiet input signals.

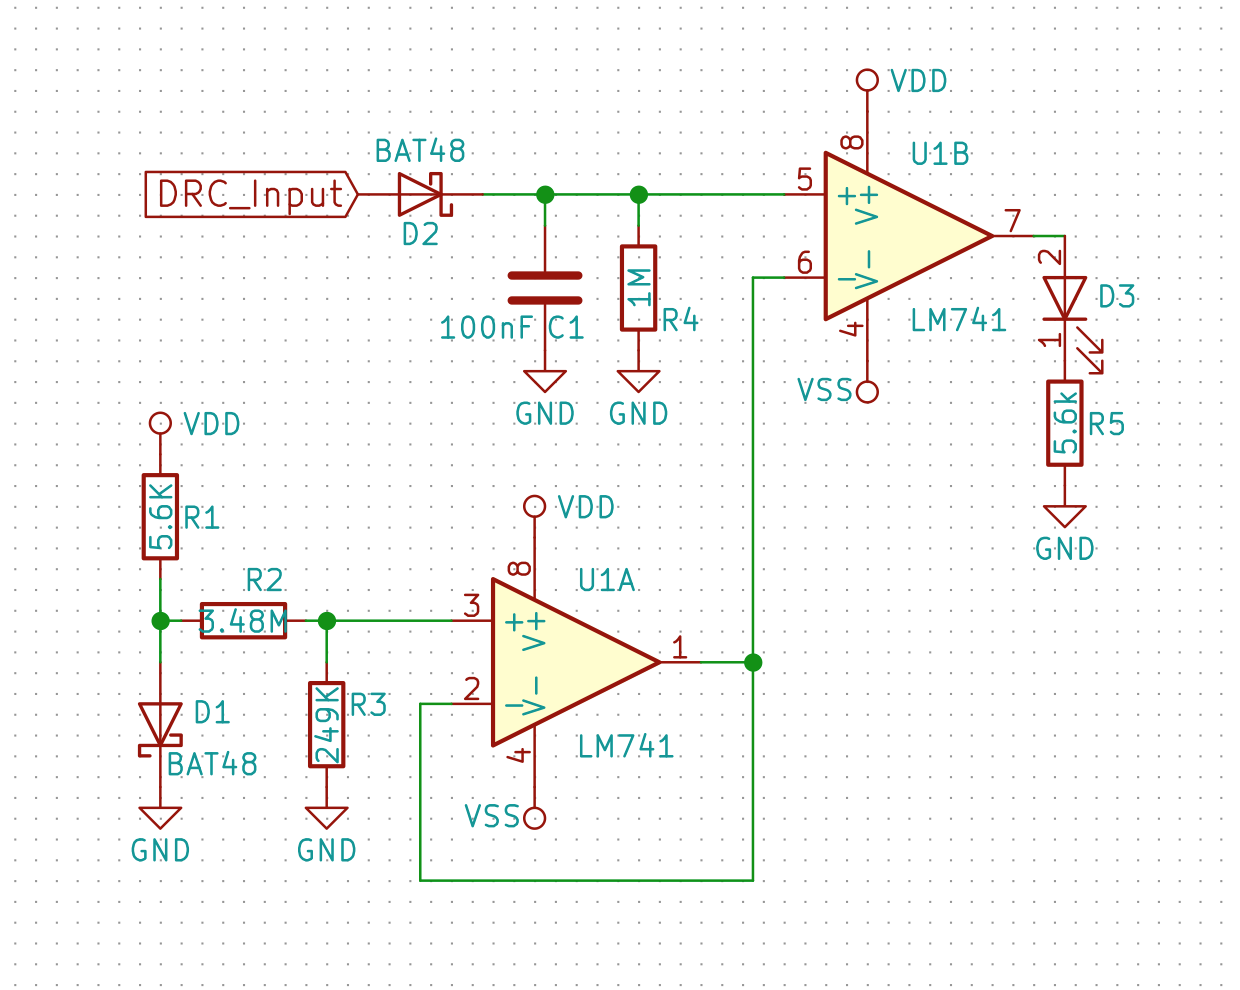
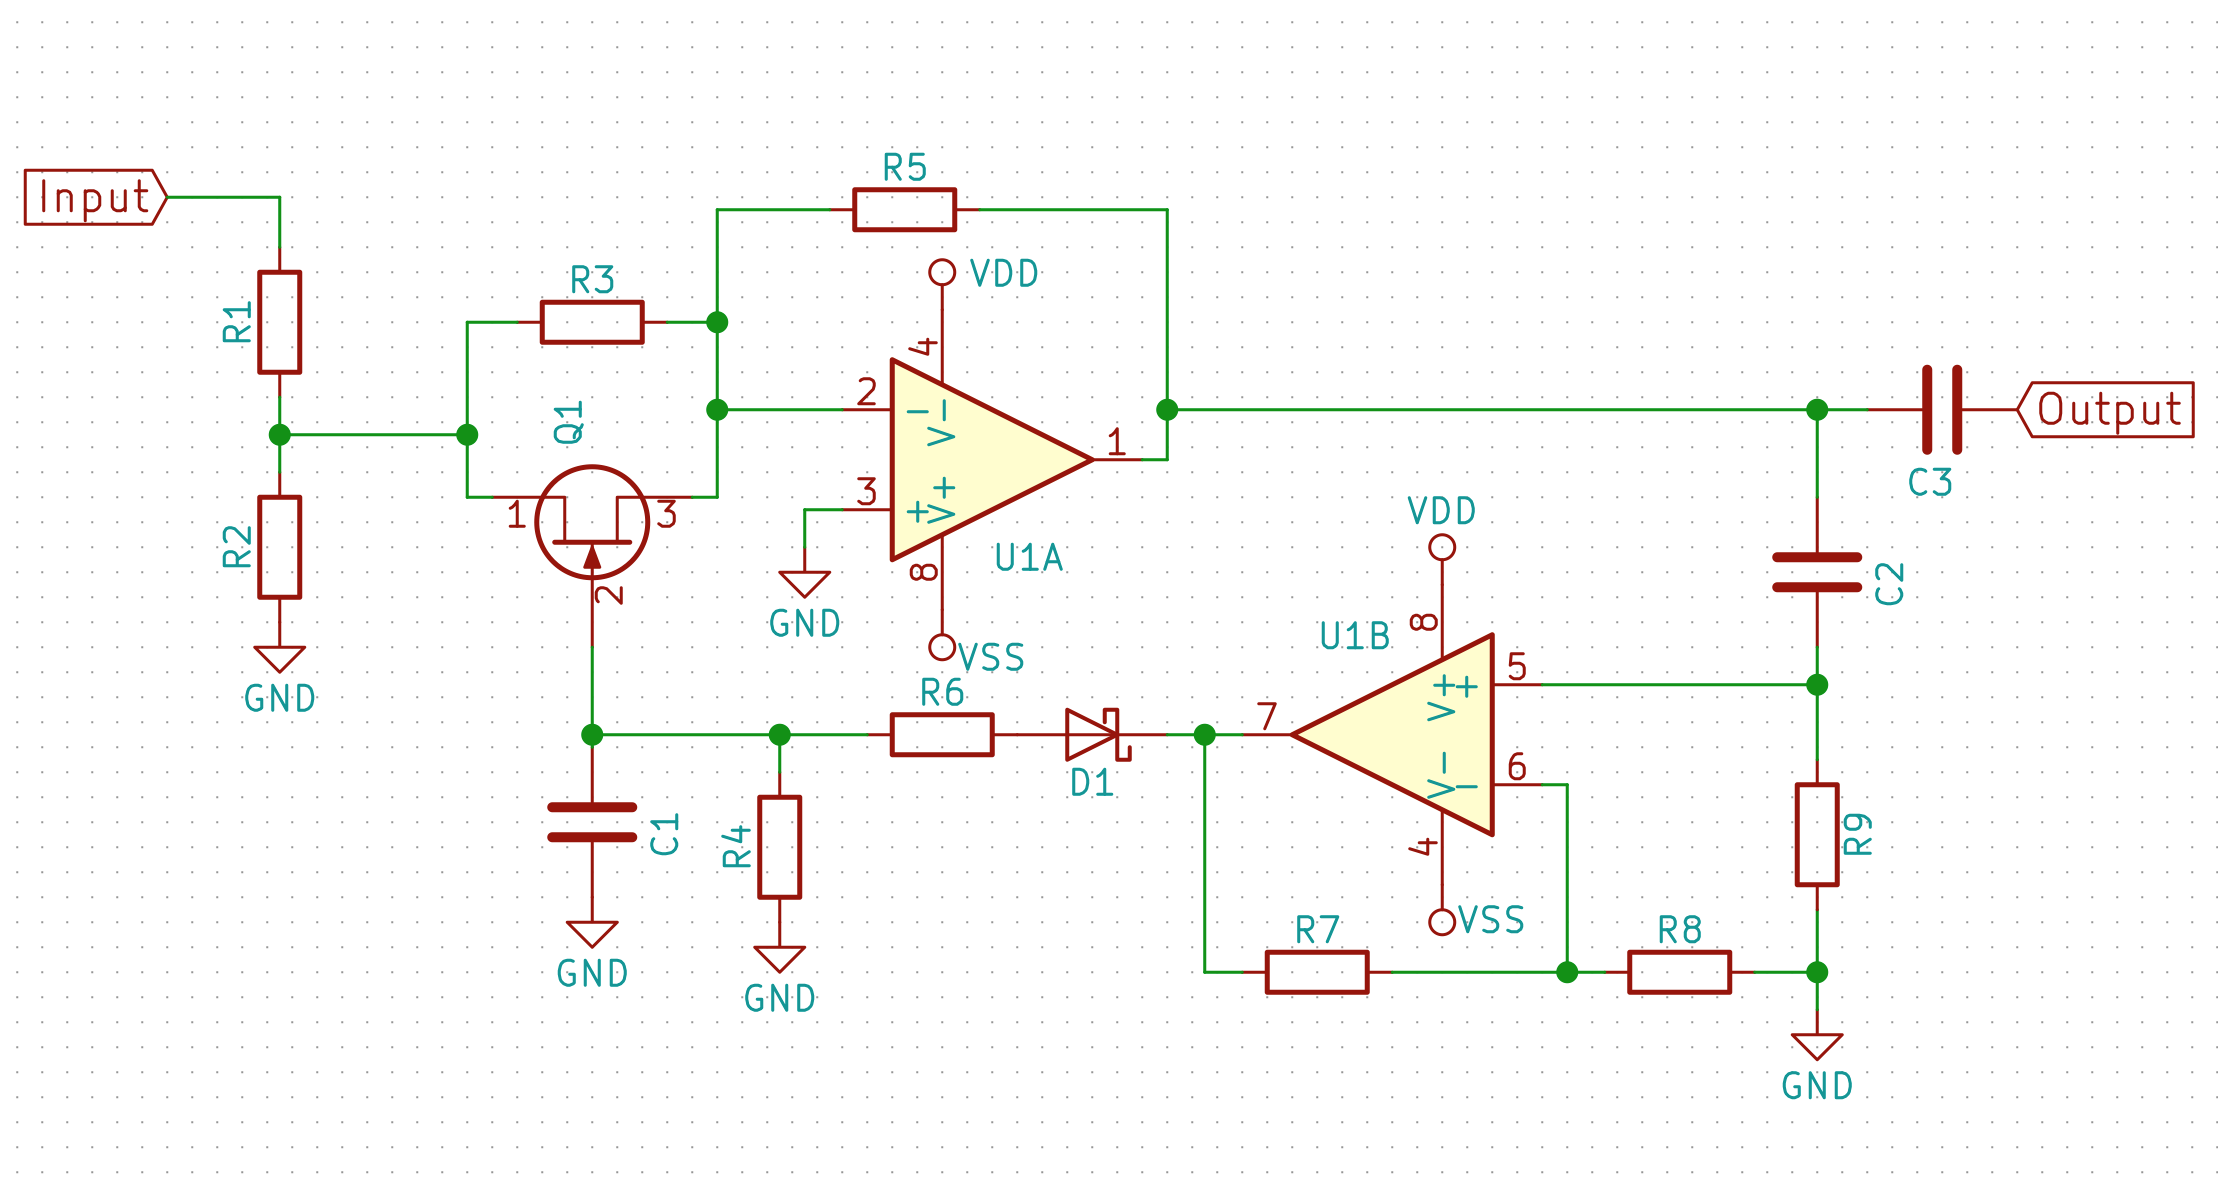
Although I built several prototypes incorporating a compressor, I eliminated the compressor from some designed due to its complexity. (See the project logs if you want the full details - in brief, its because 1.) the compressor adds cost and 2.) I need to redesign my compressor and haven't gotten around to it yet).

  • Adding a Peak Indicator

    Grant Giesbrecht05/24/2019 at 22:30 0 comments

    For the compressor to work correctly, the input signal's amplitude must be set correctly. A graph of input vs output amplitude of the compressor help to illustrate why.

    As you can see, there is a region in which input and output amplitudes are correlated roughly linearly. There is also a region in which input amplitude can change greatly but output amplitude stays nearly constant. These linear and plateau regions fundamentally are why the input source's amplitude must be correctly adjusted; when listening to an audio signal you don't want the compressor to level the volume unless something comes through which is far too loud (otherwise pauses in speaking or music would be amplified to the same level as level as the primary content). In other words, unless a sudden loud noise comes your way, you don't want to notice the compressor - you want a linear relationship between input and output amplitudes - you want constant gain. The circuit should be operating in the linear region typically. Only when a loud signal comes through that needs to be compressed should the circuit enter the plateau region. The peak indicator I describe in this log indicates to the user via an indicator light when the circuit is transitioning from the linear to the plateau region. In typical use, the user would set the input source volume to the maximum which doesn't illuminate the peak indicator.

    As for the actual design, ideally the indicator would be triggered based on the voltage which determines the compressor's gain (Q1's base voltage) because this is exactly the parameter which determines if the circuit will behave linearly or non-linearly. I chose to base my indicator on the input amplitude, however, because Q1's base voltage changes by only a few millivolts between the beginning of the linear region and the end of the plateau region. Even an offset of a few millivolts in the indicator's calibration could cause the indicator's trigger level to be off by a volt or more. Comparing the input voltage against a carefully selected reference voltage is a much more resilient technique.

    The only catch is generating the reference voltage. A voltage reference is called for here, but I didn't have one on hand so I decided to use a diode's forward voltage instead. I'll need to change this eventually, however. Here's what I came up with:

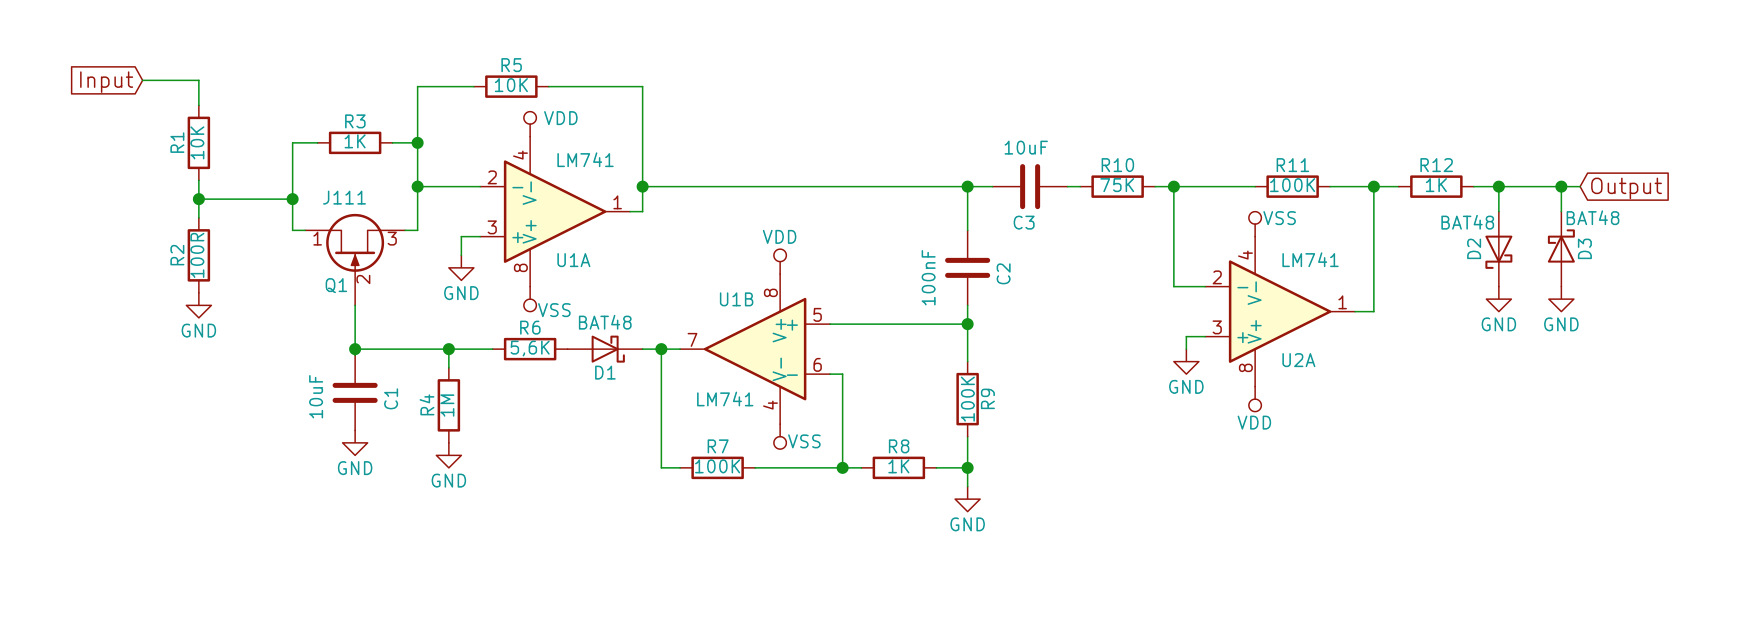
    One of the most important aspects of the voltage reference (or in this case, what I'm using in place of a reference) in this circuit is that the voltage is constant regardless of supply voltage. Because the device has a very wide input voltage range (about 4-5V on the low end (this is the output voltage of a 9V when it's towards the end of its life) and 12V on the high end (12V DC jacks are pretty ubiquitous and need to work with the equalizer's DC jack) ) the reference needs to produce an approximately steady voltage with an input range of 4-12V. I took measurements of the threshold voltage, ie. the voltage at which the indicator turns on - the voltage from the "reference", vs supply voltage.

    Although the data look damning at first glance, the results are actually quite acceptable for this application. The device should only ever be operated between 4 and 12V. These bounds are indicated in the graph by the dashed lines. Between these limits the threshold voltage only changes by about 3mV as opposed to ~23mV variation over the full tested range. Naturally the question becomes "how precise does the threshold voltage need to be?", and the answer is "not very" because we're comparing against the input voltage. The transition between the linear and plateau regions is not crisp so where the indicator's threshold should lie exactly is somewhat arbitrary. Furthermore, the transition between these two regions spans around 100mV, so a 3mV change will move the indicator's threshold through only a tiny fraction of the transition region (about 3%). Conclusion: this crude solutoin seems to be more than good enough. I didn't test threshold...

    Read more »

  • Designing the Dynamic Range Compressor

    Grant Giesbrecht05/23/2019 at 22:38 0 comments

    Before starting this project I had tested a compressor circuit W2AEW discussed on his Youtube channel. The circuit used a peak detector to set the quiescent current through a germanium diode which was used as the lower-half of a voltage divider. The voltage divider sets the gain of the circuit (which, of course, is always below unity). Although W2AEW was able to get admirable performance from his circuit, I wasn't able to replicate his success. I had more success using the circuit shown below.

    One aspect of the new circuit I prefer over W2AEW's circuit is that the new design utilizes a closed-loop control system as opposed to the open-loop system in W2AEW's circuit. I decided to go with the closed-loop circuit instead of W2AEW's circuit for two reasons: 1.) in practice, I was able to get better results from the closed-loop circuit 2.) the closed-loop circuit is made from commonly available components, whereas the other requires the somewhat rare and difficult to obtain 1N34A germanium diode. Although W2AEW's circuit could be made form non-germanium diodes, it's performance would be worse and it would be more difficult to correctly adjust due to the steeper I-V characteristic curve of Si diodes compared to Ge diodes.

    As I was tweaking the closed-loop circuit to work with my equalizer I ran into issues with the output amplitude oscillating. The oscillations occurred because the feedback was too strong. U1B's gain was set much too high, which caused a cycle in which first U1A's gain would be way too low because U1B would perceive the output signal as too large, then the output amplitude would drop to near zero, at which point U1A's gain jumps up way too high. Reducing U1B's gain solved this problem. The circuit was working correctly to stabilize the output signal amplitude.

    I added clipping diodes to the output of the circuit (an idea I borrowed from W2AEW's design) to help attenuate any sudden changes in volume which the main feedback system would be too slow to catch. However, listening to audio signals through the circuit showed that it was negatively impacting sound quality. I realized that the attack time (how long it takes for the circuit's gain to change to counter a change in output amplitude) was too fast, causing the circuit to change its gain continuously as music played rather than just when the volume changes dramatically. Increasing C1 and R6 slowed the attack time and fixed the problem. There was no discernible change to audio signals passed through the circuit.

    Lastly, I added a fixed-gain amplifier at the output of the compressor to restore the signal level's amplitude back to that before the compressor. The finished circuit is shown below.

    Lastly, I added an amplifier to the output with a potentiometer to set the total gain. This will serve as the master volume control.

  • Designing the Mid and High Bands

    Grant Giesbrecht05/23/2019 at 21:10 0 comments

    I began by running a few dozen simulations using the same code I developed when designing the low band. I was looking for a frequency response which would not overlap too much with the low band (or later, the high band) and which would be centered close to where voices tend to reside. This way the mid band of the equalizer is able to adjust the volume of voices in the sampled audio. Nothing I saw in the simulations was satisfactory. It predicted a low Q factor and low maximum gain. I tested one of the simulations' circuits on a breadboard and got a result which conflicted with my simulation. I believe that the issue is that the circuit's transfer function is strongly affected by the op amps's input bias current, which I modeled to be zero in my simulation. I decided to switch over to experimental guess & check methods briefly to see if I could find a solution that way or if I'd need to revise my model and proceed with simulations. To get very quick experimental data I used my waveform generator's sweep functionality to feed the test circuit sine waves between 10 Hz and 20KHz over the course of about 5 seconds. Setting my scope to single trigger at the start of a sweep made my scope display what was effectively a crude bode plot. I used this system to quickly try different circuit designs until I achieved a frequency response approximately equal to what I was looking for, at which point I switched back to the more tedious but also more precious system of measuring gains and various discrete frequencies manually.

    Eventually I settled upon the design shown above for the mid band filter. It has a much higher Q and gain than my previous equalizer's mid band.

    The high band was pretty quick to design using the experimental guess and check method with swept-frequency sine waves to generate bode plots. I found a few designs that seemed feasible and tested them by listening to audio signals through them. Ultimately I decided upon the design shown below.

  • Designing the Low Band

    Grant Giesbrecht05/09/2019 at 20:24 0 comments

    Before getting into the nitty-gritty of designing the equalizer such as selecting component values or specific op-amps I needed to select a topology. The multiple-feedback topology was appealing because it is well-known and equations are available that can give you a circuits with a specified Q and cutoff frequency. This makes it comparatively easy to get a multiple-feedback filter that produces a pre-selected frequency response. I decided not to use this topology, however, because I saw no clear way to adjust the gain from its maximum gain smoothly down to a minimum gain that is exactly the inverse of the maximum gain. A more attractive alternative was a topology that first appeared (to my knowledge) in a Philips application note from 1984, AN142 "Audio circuits using the NE5532/3/4". The Philips topology is a modified form of a typical op-amp inverting amplifier that uses a potentiometer in the feedback network to select gain, and capacitors either bypassing or in series with the potentiometer to ensure that it is only effective at setting the gain above or below unity at specific frequencies. The fundamental design is shown in the schematic below.


    One drawback with this circuit, however, is that convenient design equations aren't available. I started analyzing the circuit by hand, but bringing the algebra through to a point where I could get a formula for Q and cutoff frequency proved to be more trouble than it was worth. I decided instead to analyze it only qualitatively on paper (to build an intuition for how it works and how to modify its transfer function), then simulate it in MATLAB. I wrote a program that would generate 9 bode plots for the circuit, each with a different set of values. I used that to confirm that my qualitative analysis was correct, and to determine quantitatively which values I should test on a breadboard.

    Using this methodology, I decided to try for the low-band circuit the Philips topology with fixed resistors of 500Ω, a 100KΩ potentiometer, and 600nF across the potentiometer. C2 was omitted and shorted because C2 would diminish low-frequency gain. I chose 100KΩ for the potentiometer because I already have a nice 2-gang potentiometer from GEQ-1 picked out for this project with a 100kΩ resistance.

    Initial measurements of the transfer function were encouraging. They aligned very closely with the predicted measurements. Of course, what really matters is how it sounds, so I listened to some music through the circuit as well. I tested a couple changes, but the only change I kept in the final design was changing the capacitor's value to 800nF to decrease the cutoff frequency and make the filter's gain closer to unity at higher frequencies.

  • Automating Data Collection

    Grant Giesbrecht05/09/2019 at 20:09 0 comments

    I decided to try to automate data collection partially because this project was going to demand measuring dozens of frequency responses, each of which takes upwards of 20 minutes to collect by hand. Even if I only take a dozen or so data points, each point requires setting the function generator and oscilloscope to get a good reading, writing the data into a table, and entering it into my computer. Only then can I see the plot. It's too much writing and too slow to see results.

    To fix the issue I made a Python script to run on my laptop and send commands to my Rigol oscilloscope over USB. I'd still have to manually set my function generator and adjust my scope's trigger and horizontal + vertical scales to get clear measurements, but after that my script pulls the measurements I need straight from my oscilloscope. This eliminated the time consuming paper tables and copying them into a digital format. Plus I designed my script save the data to my hard drive in a file format I designed a few years ago that makes it easy to load the data into MATLAB or C++ programs for further analysis.

    My program helped, but had some important issues. It didn't automatically set the scope's horizontal + vertical scales and thus still required pretty significant amounts of attention to work. Plus, occasionally the scope would send corrupt data and the python script would record this as if it were valid. I continued to use a mix of fully-manual measurements alongside those collected by this program and continued to update and improve the program as I used it. Even with just a few tweaks to eliminate the largest problems (eg. 1. detect corrupt data and ask the user to re-collect 2. allow the user to view the data and erase the corrupt data) my script accelerated data collection quite significantly. I could now collect a data set in half the time or less.

    Note: You won't find the script uploaded here because (as you'll read later) I rewrote the script so it automates the entire measurement process and you can go grab a coffee as your test equipment does your work for you. Because this second program is universally better, I omitted the earlier one. I've got a project page for the completed script here (https://hackaday.io/project/165389-automating-data-collecting-w-python) if you're just too excited to wait.

  • Testing Filters

    Grant Giesbrecht05/09/2019 at 19:09 0 comments

    Before jumping into designing the filters for the equalizer, I wanted to take some measurements of different passive filters' frequency responses. The goal was twofold: 1.) I worked out some formulas for predicting the transfer function of passive filters. These measurements can validate these models so I know I can apply the same analysis techniques to the more complicated filters to come. 2.) These passive filters give me something against which I can compare my later filters.

    First I looked the classic RC low pass and high pass filters. I threw circuit together on a breadboard and set specific input frequencies into the circuit with my waveform generator, then recorded the gain with my oscilloscope. I made the theoretical curves very simply just using complex impedances to analyze the 3-node circuit. I then tested a band-pass filter by putting a low-pass and high-pass filter in series with an op-amp in between. The op amp was set to a unity-gain configuration to make sure the circuits behave the same way as when they were separate.

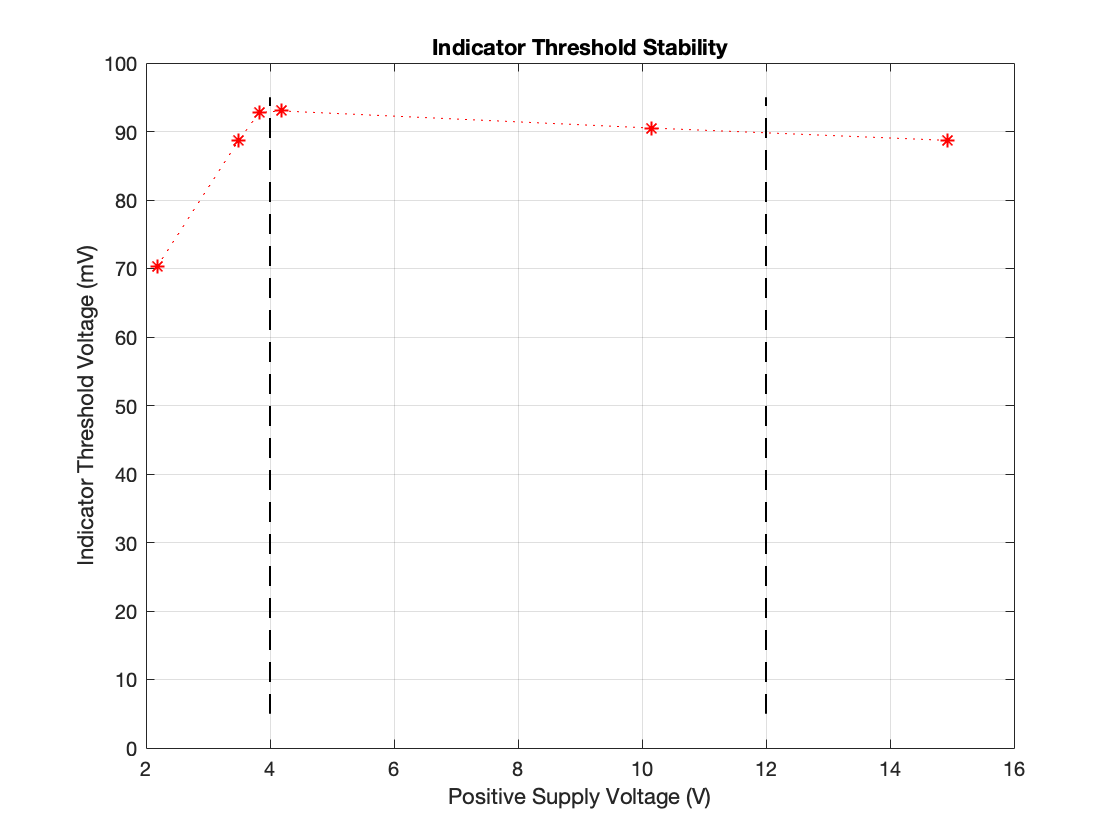
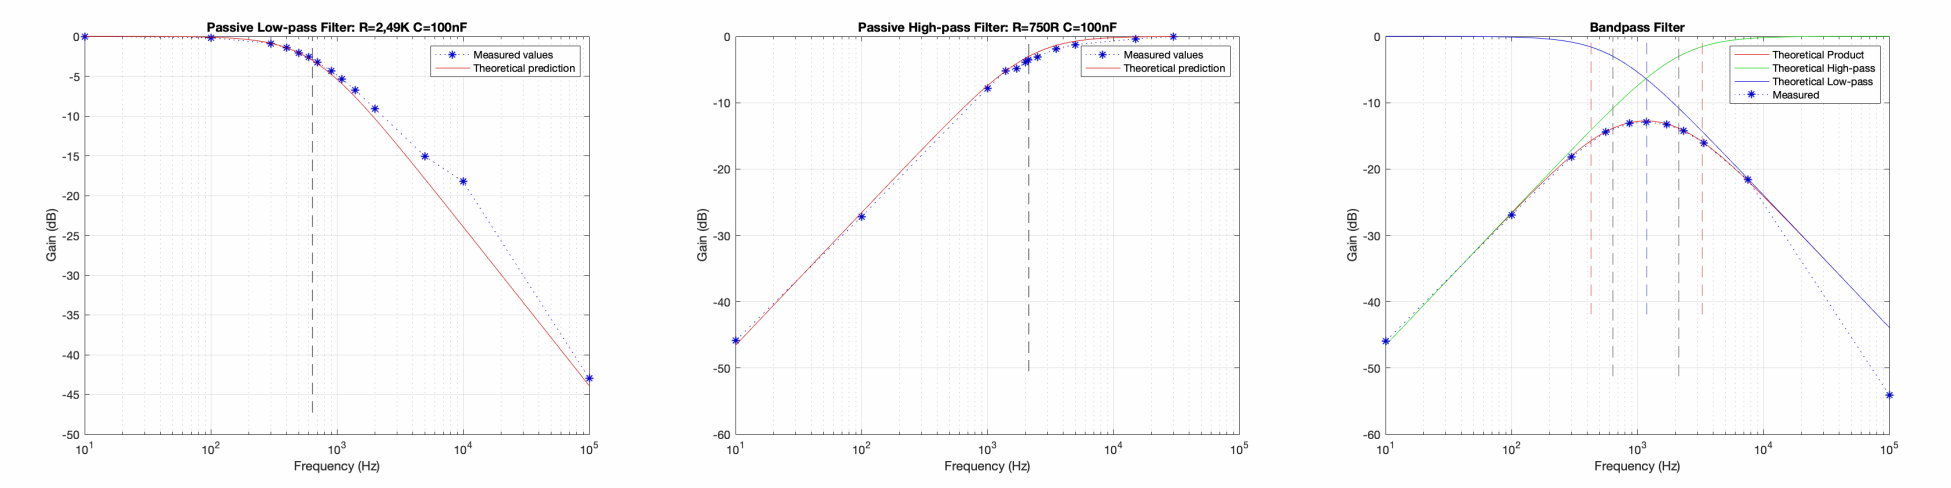
    As you can see in the figures above, everything matched up pretty well.
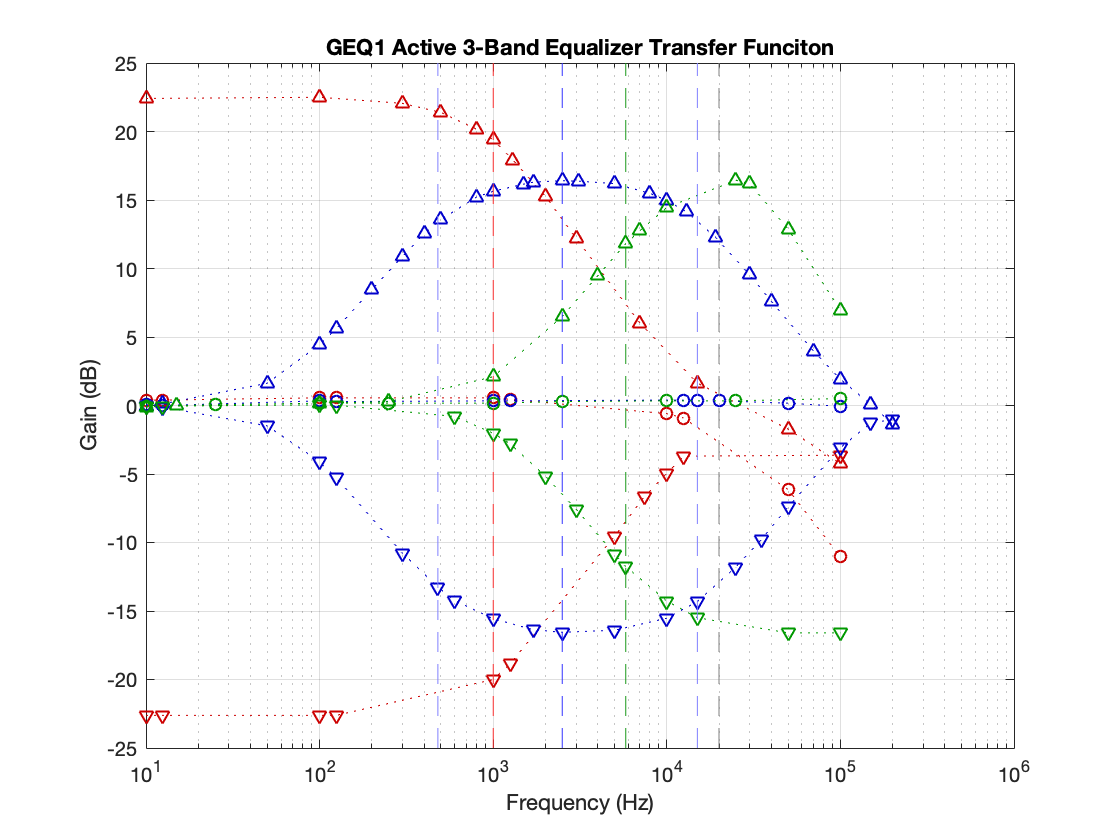
    Next up was to remeasure the frequency response of my equalizer from my earlier project, GEQ-1. This was more than a bit tedious because each of the three bands had to be measured at both maximum and minimum gains, resulting in a total of 7 data sets (the 7th comes from a baseline in which all stages are set to have a flat response).

    The graph above shows what I measured. The red curves indicate when the low-band was set to either maximum or minimum gain (up-triangle markers indicate max, down-triangle markers indicate min), blue indicates mid-band, and green high-band. I don't like the drop-off in gain at high frequencies, the low-Qs, and the uneven max gains between different bands. These are issues I'll address with my new equalizer. 

View all 6 project logs

Enjoy this project?

Share

Discussions

Michael G wrote 05/25/2019 at 06:51 point

Very well documented!

  Are you sure? yes | no

Similar Projects

Does this project spark your interest?

Become a member to follow this project and never miss any updates