I was unable to find a simple method to predict the variation of the resistor divider output by trolling the internet. I found quite a bit of misinformation out there...and webpage calculators that don't appear to yield the correct result. I had to roll my own.
I am definitely not a guru when it comes to statistics. I tend to use simple theory to predict results and when that fails I turn to the internet...and when that fails I turn to Mathematica (which happens to be free on any Raspberry Pi computer.)
Unfortunately, the probability density function is not known for the resistors that I will use in the divider. Vishay only publishes a tolerance. If you're interested, the resistors are Vishay TNPW 20k 0.1%. (They do however specify stability at 70°C over 8000hrs < 1000ppm (0.1%). I'm hoping that they all drift in the same direction.
Some Background Statistical Theory:
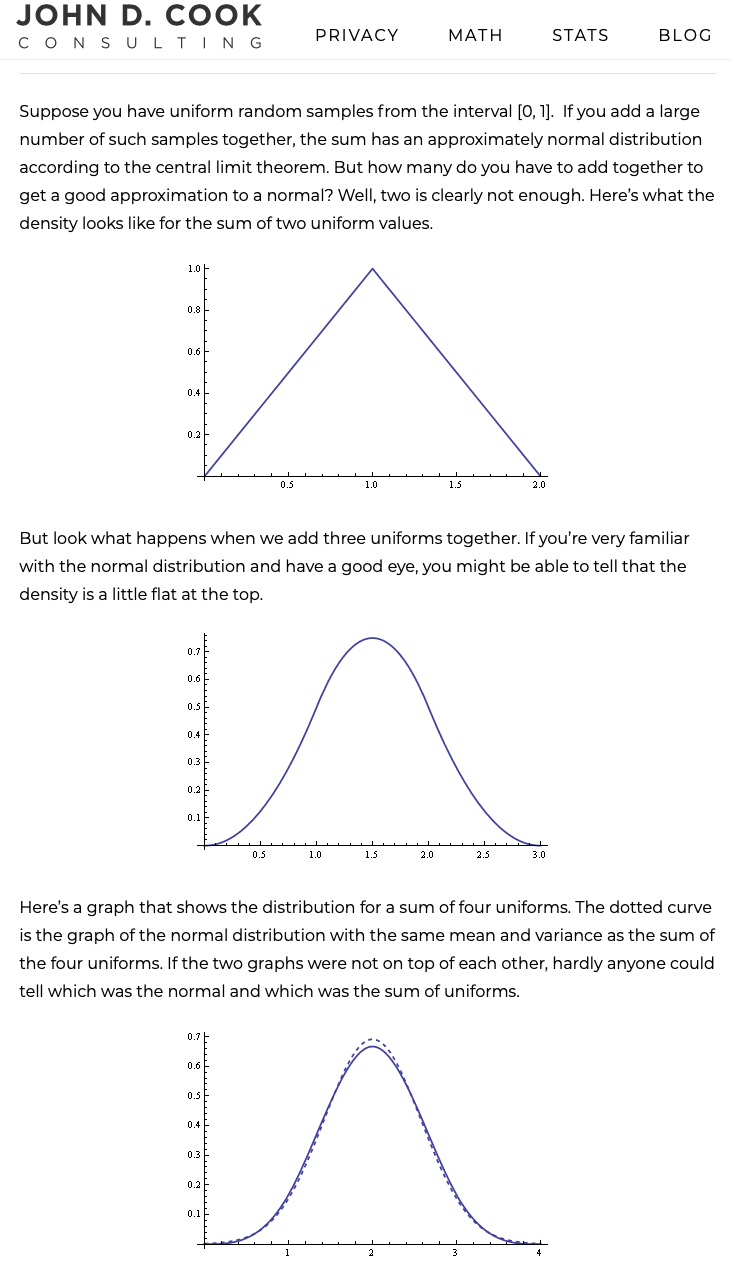
The simplest distribution to assume for resistor variation is the uniform distribution -- all values within the tolerance are equally likely and there is is no likelihood of a value outside of the tolerance specification. If you have a string of resistors in series then the probability distributions sum as well, but that involves convolution. There is a pretty good explanation of it on the web (credit --site):

So the lesson here is that when you get more than 4 sums of uniform independent random variables they can be treated just like normal probability distributions with mean, variance and standard deviation.
But that's not all. When you add resistors together you add their variances. Then the standard deviation of the sum of resistors reduces by the square root of the number of resistors: SDsum = SD/sqrt(n). That is the theory behind using 49 resistors to make a 1:25 resistor divider. My fat finger says that the standard deviation of the divider should reduce by sort(49) = 7. Roughly 0.014%.
Monte Carlo to the rescue:
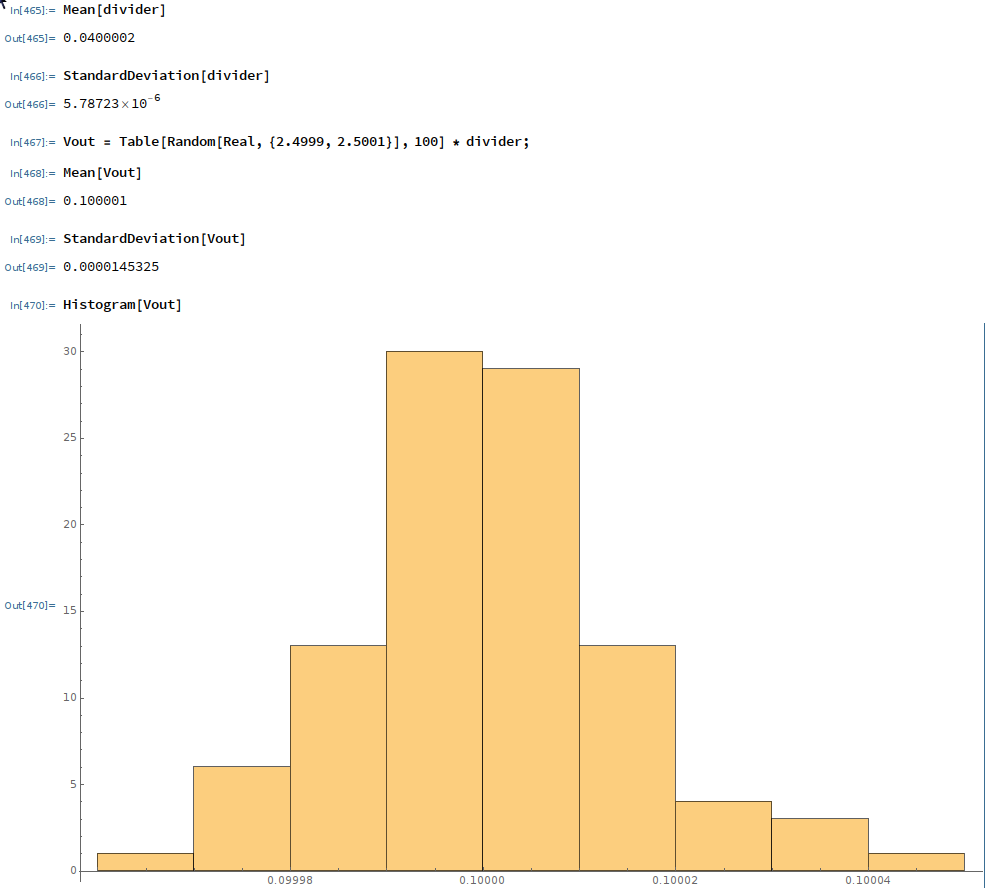
I created a Monte Carlo simulation in Mathematica to perform 100 experiments to simulate the expected value of the resistor divider. I will upload the Mathematica notebook file to the files section of this project. Each resistor was given a uniform probability density between 0.999 and 1.001 and a list of 100 random values created for each resistor. The the resistor divider function was calculated 100 times to yield a list of the divider output values. I also assigned a ±0.1mV uniform distribution to the 2.5V reference voltage to include it's expected variation. Here is the final resulting mean, standard deviation and histogram:

There is better than a 50% chance that the output voltage will lie within 10µV of 100mV. It looks like the result is pretty close to a normal density function to me.
 Bud Bennett
Discussions
Become a Hackaday.io Member
Create an account to leave a comment. Already have an account? Log In.