 agp.cooper
Nokia LCD Display
I have a few of these lying around and I wrote some code using a DigiSpark a while back. The code is based on work by Julian Ilett (https://www.youtube.com/playlist?list=PLjzGSu1yGFjXWp5F4BPJg4ZJFbJcWeRzk).
First problem is that the display needs 5 output pins and the DigiSparks only has five IO pins so that is not going to work (i.e. no pin left for the signal input).
I could use an Arduino UNO with the Nokia LCD Display.
MicroView
I have a MicroView so I may as well use that.
So here it is listening to a 3v 1kHz square wave:
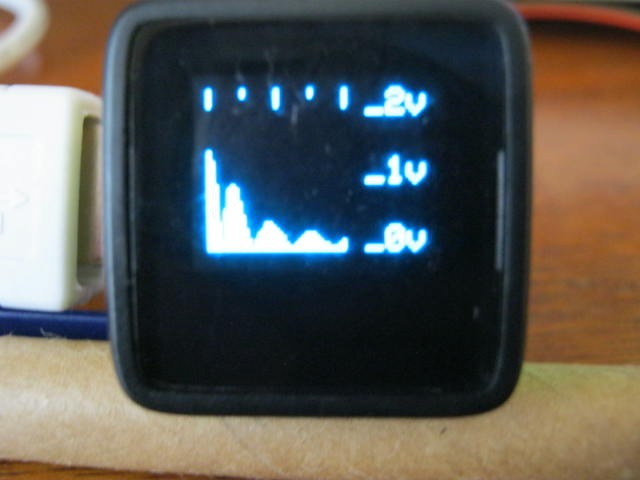
The top gradations are 0 kHz, 1.25 kHz, 2.5 kHz, 3.75 kHz and 5 kHz.
You can see the DC, 1 kHz and the harmonics but they off a little bit.
Next there is quite a bit of jitter at low frequencies, here is another shot:
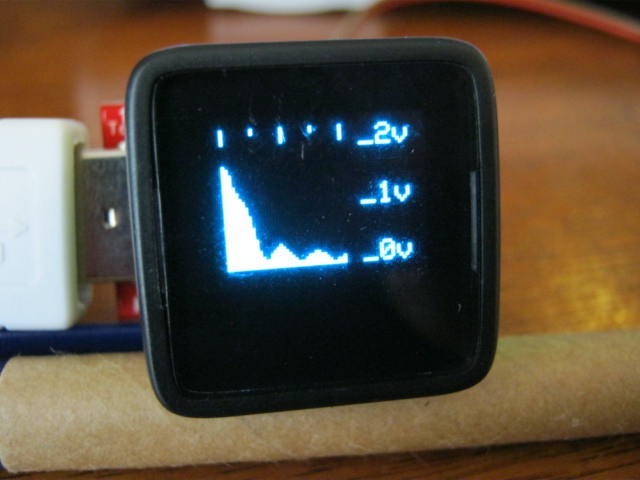
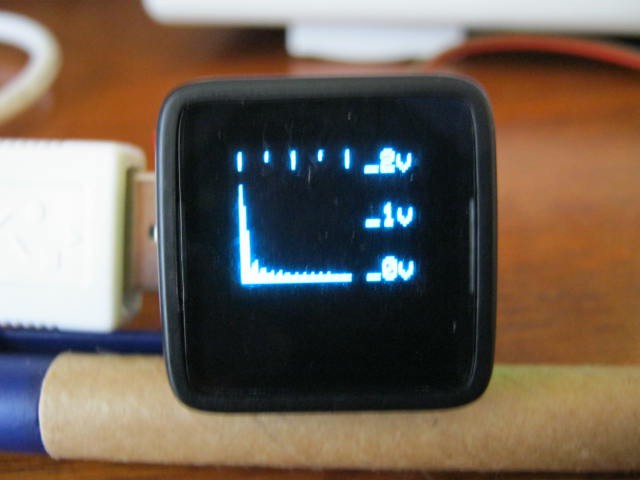
Here is the same square wave but with a 20kHz:
Need to check the actual average sample time for each pass.
Need understand the nature of the jitter.
Is it an interrupt or is it due to the algorithm?
Need some free IO pins for an option menu (after I solve the other problems).
Here is the current code:
#include <MicroView.h>

// Audio Spectrum Analyser
#define SampleInput A0   // Name the sample input pin
#define BandWidth  500   // BandWidth
#define MaxFreq   4000   // Max analysis frequency
#define Trigger     10   // Trigger to synchronise the sampler 2vpp at 1kHz = 32

// Define various ADC prescaler
const unsigned char PS_16=(1<<ADPS2);
const unsigned char PS_32=(1<<ADPS2)|(1<<ADPS0);
const unsigned char PS_64=(1<<ADPS2)|(1<<ADPS1);
const unsigned char PS_128=(1<<ADPS2)|(1<<ADPS1)|(1<<ADPS0);

// Setup the serial port and pin 2
void setup() {
  // Setup the ADC
  pinMode(SampleInput,INPUT);
  ADCSRA&=~PS_128;  // Remove bits set by Arduino library
  // Set prescaler
  // ADCSRA|=PS_64; // 64 prescaler (250 kHz assuming a 16MHz clock)
  // ADCSRA|=PS_32; // 32 prescaler (500 kHz assuming a 16MHz clock)
  ADCSRA|=PS_16;    // 16 prescaler (1 MHz assuming a 16MHz clock)

  uView.begin();                          // Start MicroView
  uView.clear(PAGE);                      // Clear page
  uView.println("Spectrum  Analyser");    // Project
  uView.println("0-20 kHz");              // Range
  uView.println();
  uView.println("agp.cooper@gmail.com");  // Author
  uView.display();                        // Display
  uView.clear(PAGE);                      // Clear page
  delay(2000);                            // Wait
}

void loop() {
  static byte *samples;           // Sample array pointer
  static byte *window;            // Window array pointer
  static int N=0;                 // Number of samples for BandWidth
  static long sampleFreq;         // Sample frequency
  long freq;                      // Frequency of interest
  float s;                        // Goertzel variables
  float s_prev;
  float s_prev2;
  float coeff;
  float magn;
  int i;

  if (N==0) {
    // Check sample frequency and set number of samples
    samples=(byte *)malloc(100);
    unsigned long ts=micros();
    for (i=0;i<100;i++) samples[i]=(byte)(analogRead(SampleInput)>>2);
    unsigned long tf=micros();
    free(samples);
    sampleFreq=100000000/(tf-ts);
    N=2*sampleFreq/BandWidth+1;

    uView.setCursor(0,0);                   // Set cursor to beginning
    uView.print("SI: A");                   // Sample input pin
    uView.println(SampleInput-14);
    uView.print("SF: ");                    // Sample frequency
    uView.println(sampleFreq);
    uView.print("MF: ");                    // Max frequency
    uView.println(MaxFreq);
    uView.print("BW: ");                    // andWidth
    uView.println(MaxFreq);
    uView.print("SN: ");                    // Number of samples
    uView.println(N);
    uView.display();                        // Display
    uView.clear(PAGE);                      // Clear page
    delay(2000);

    // Create arrays
    samples=(byte *)malloc(N);
    window=(byte *)malloc(N);

    // Modified Hamming Window
    for (i=0;i<N;i++) window[i]=(byte)((0.54-0.46*cos(2*M_PI*i/(N-1)))*255);

    // Generate test samples
    for (i=0;i<N;i++) {
      samples[i]=(byte)(30*(sin(2*M_PI*i*5000/sampleFreq)+sin(2*M_PI*i*2500/sampleFreq)+sin(2*M_PI*i*7500/sampleFreq)+sin(2*M_PI*i*10000/sampleFreq))+127);
    }
  }

  if (true) {
    // Sychronise the start of sampling with data slicer
    int a0,a1;
    a0=1023;
    for (i=0;i<N;i+=2) {
      a1=analogRead(SampleInput);
      a0=(a0*13+a1*3)/16;
      if (a1>a0+3) break;
    }
    for (i=0;i<N;i++) samples[i]=(byte)(analogRead(SampleInput)>>2);
  }

  // Scan frequencies
  for (freq=0;freq<=MaxFreq;freq+=(MaxFreq/40)) {
    // Goertzel (https://en.wikipedia.org/wiki/Goertzel_algorithm)
    coeff=2*cos(2*M_PI*freq/sampleFreq);
    s_prev=0;
    s_prev2=0;
    for (i=0;i<N;i++) {
      s=0.0000768935*window[i]*samples[i]+s_prev*coeff-s_prev2;
      s_prev2=s_prev;
      s_prev=s;
    }
    // Get magnitude
    magn=2*sqrt(s_prev2*s_prev2+s_prev*s_prev-coeff*s_prev*s_prev2)/N;
    // Display on MicroView
    uView.line(freq*40/MaxFreq,47,freq*40/MaxFreq,10-(int)(20*log10(magn+0.0001)));
  }
  // Frequency graduations
  uView.setCursor(47,0);
  uView.print(MaxFreq/1000);
  uView.print("k");
  uView.line(0,0,0,5);
  uView.line(10,0,10,2);
  uView.line(20,0,20,5);
  uView.line(30,0,30,2);
  uView.line(40,0,40,5);
  // Voltage graduations
  uView.line(0,40,40,40);
  uView.setCursor(47,38);
  uView.print("-30");
  uView.line(0,20,40,20);
  uView.setCursor(47,18);
  uView.print("-10");
  uView.line(0,10,40,10);
  uView.setCursor(47,8);
  uView.print("  0");
  //Display
  uView.display();
  uView.clear(PAGE);
}
Fixes
Measured the sample frequency on the fly.
Dynamically determined the sample number and allocated the memory for the arrays.
For the phase error issue I added a data slicer (with a time out) to try an synchronise the input signal (if possible).
Convert amplitude to a log scale.
So here it is testing the 1 kHz 3v square wave (using a 500 Hz bandwidth):
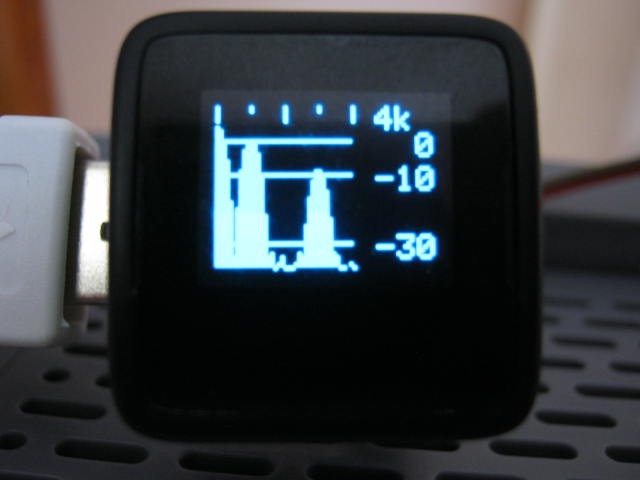
Quite stable - very little jitter.
The magnitude is RMS voltage.
The 4k at the top right-hand corner is the maximum frequency of the analysis.
The nominal band width is 500 Hz (actually 250 Hz before the Hamming Window).
You can see the spectrum noise below -30dB.
Project Complete
Until I find something to do with this project I am going to call it complete!
AlanX
Discussions
Become a Hackaday.io Member
Create an account to leave a comment. Already have an account? Log In.
Hi Trevor,
Great, enjoy.
Regards AlanX
Are you sure? yes | no
Thanks for doing all this hard work. I need a GHz analyzer display, but will implement your code then use its graphics as a framework for expansion. Thanks again! :)
Are you sure? yes | no