 Tim Rightnour
I want to know exactly when to do something. Not "every month because I said so". I want proof. Evidence. So this is me being crazy and getting it.
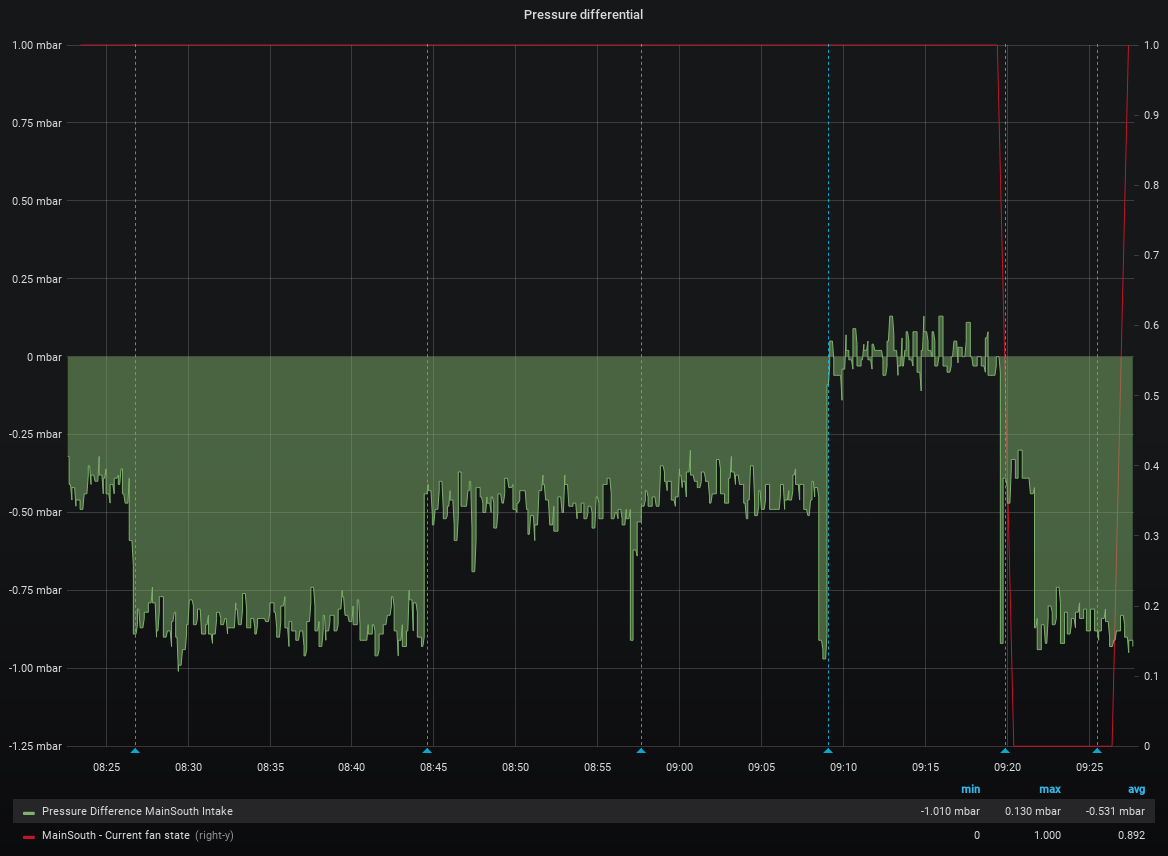
We start with the basic idea. The main intake on your air conditioner pulls air through a filter. When you forget to replace your filter for a long time, it becomes covered in dirt. When you finally replace it, you notice that it's being sucked up into the vent, in a big dome. Presumably, this means that there is negative pressure on the inside of the vent. Can we measure that? Can we measure it accurately enough to do something with the data?
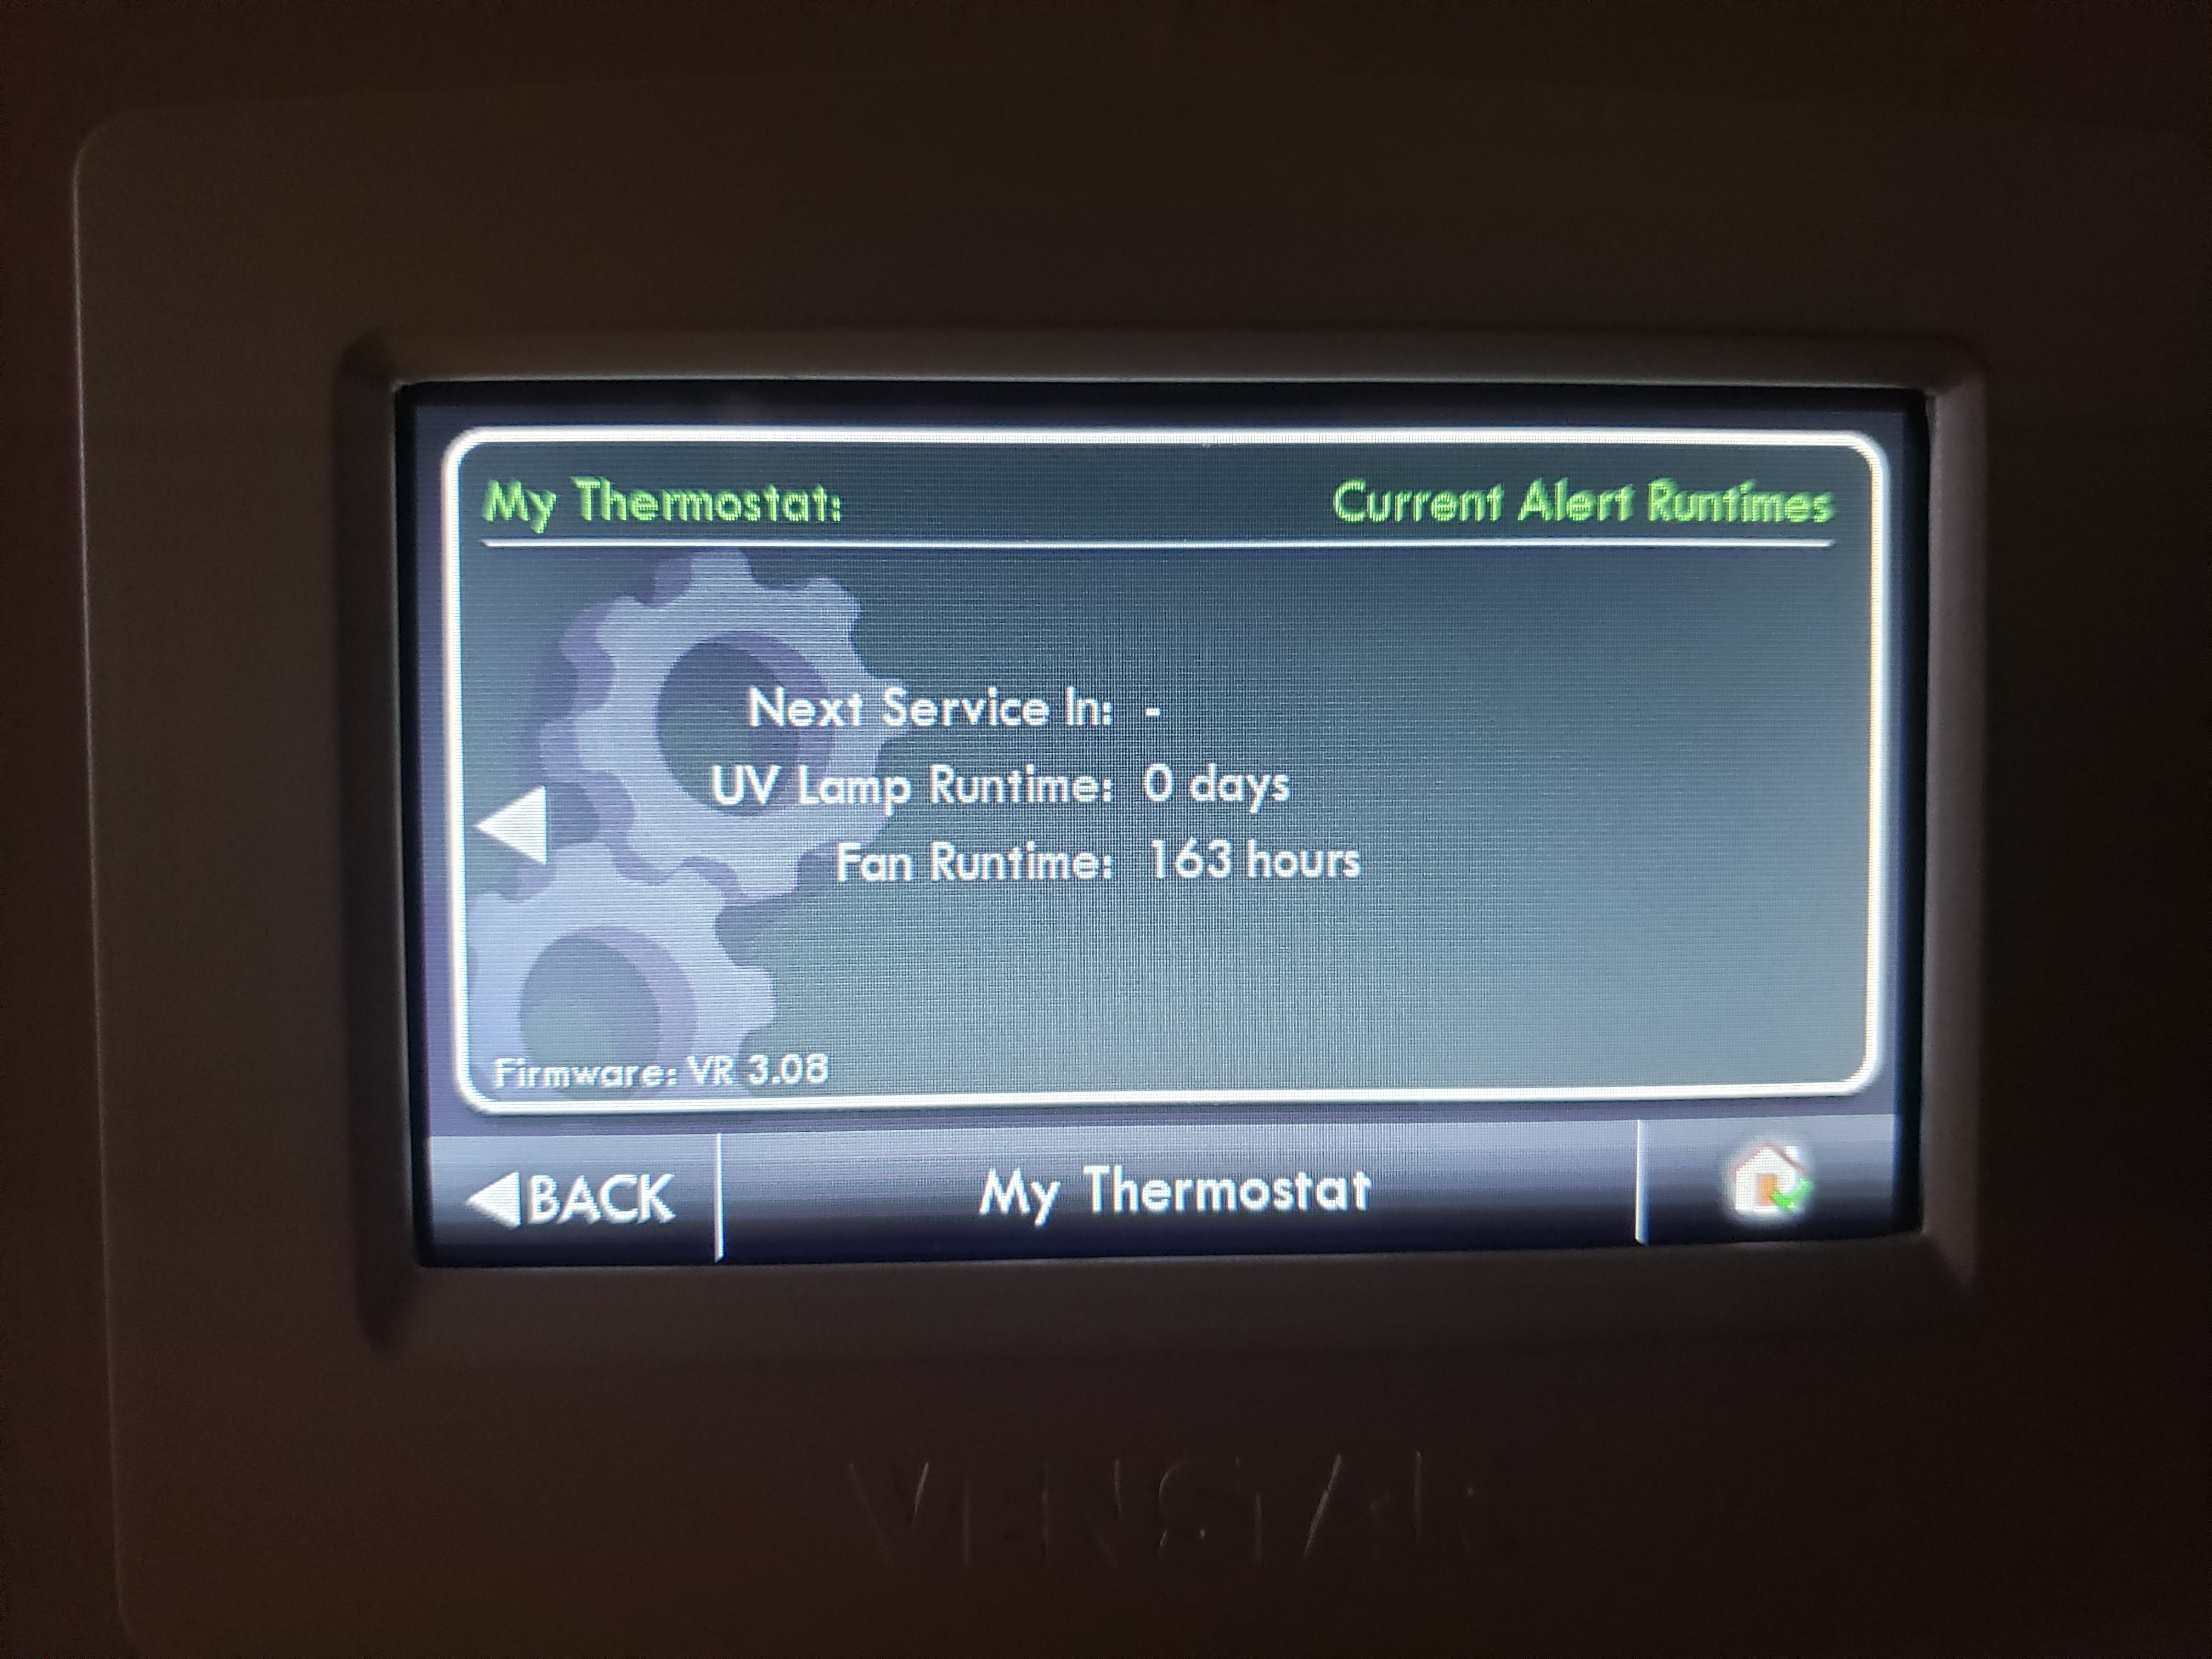
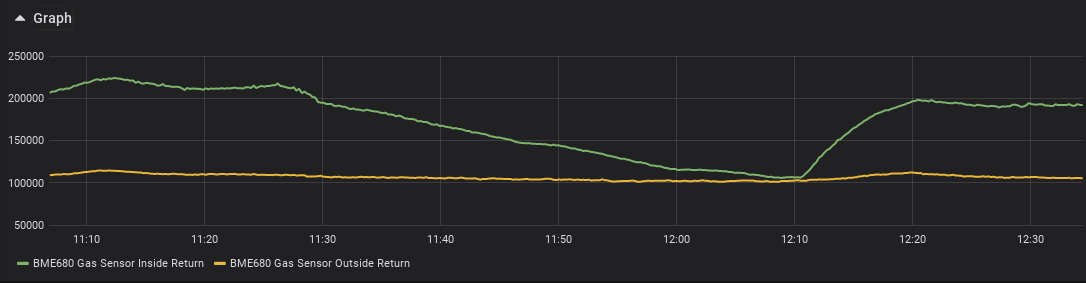
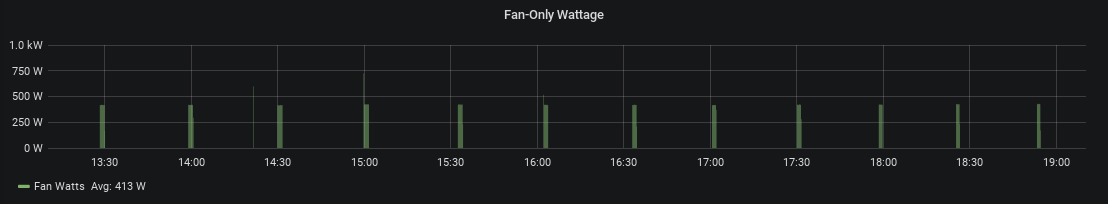
So step 1 is easy. I have a Venstar thermostat. This is a really nice WiFi thermostat that has a fully documented API. It was trivial to hook it up to my home automation system, and start pulling data. Now I know exactly when the fan is on, and off.
Oh, I guess I forgot step 0. Write home automation software, from scratch, because you are crazy. Yes. Do that first.
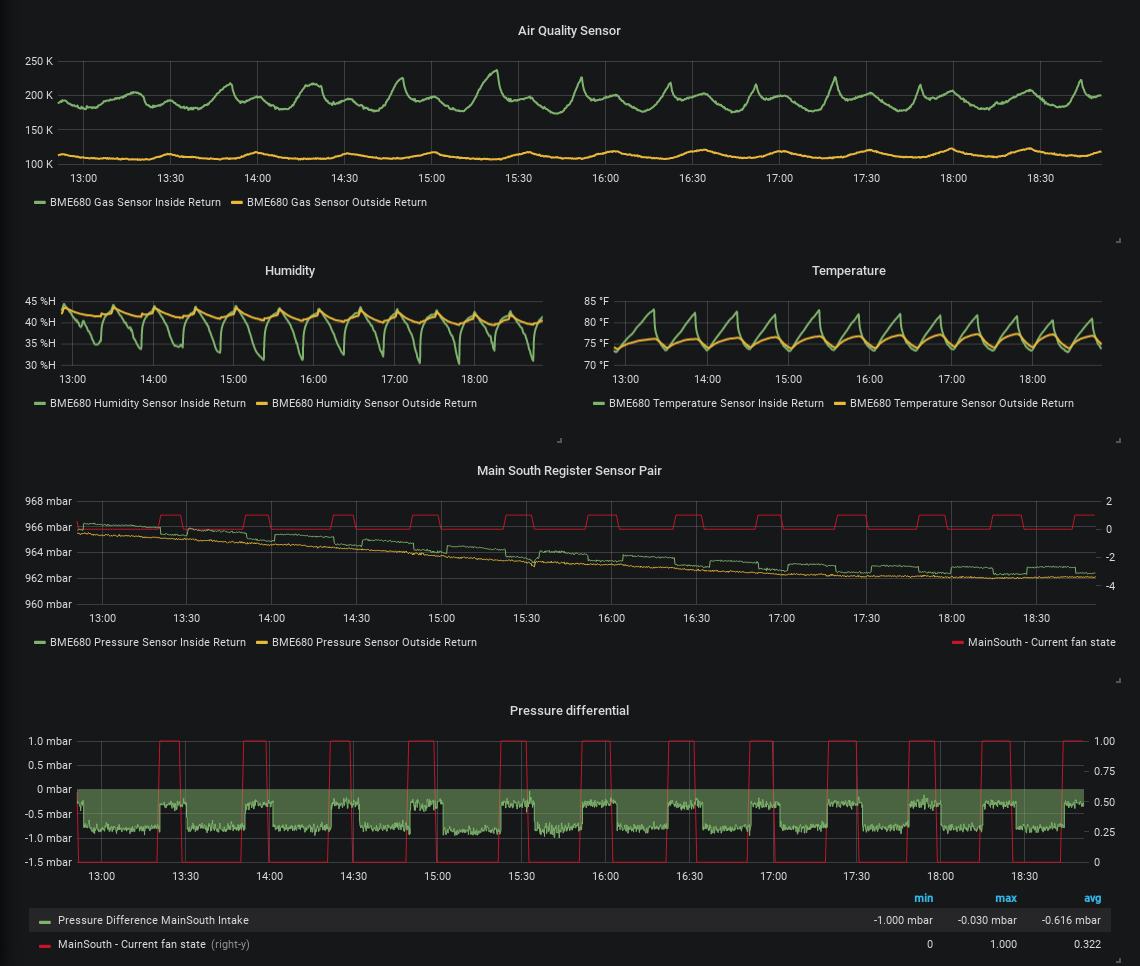
Step 2. Find an accurate pressure sensor, buy two, and hook them up on either side of the filter.
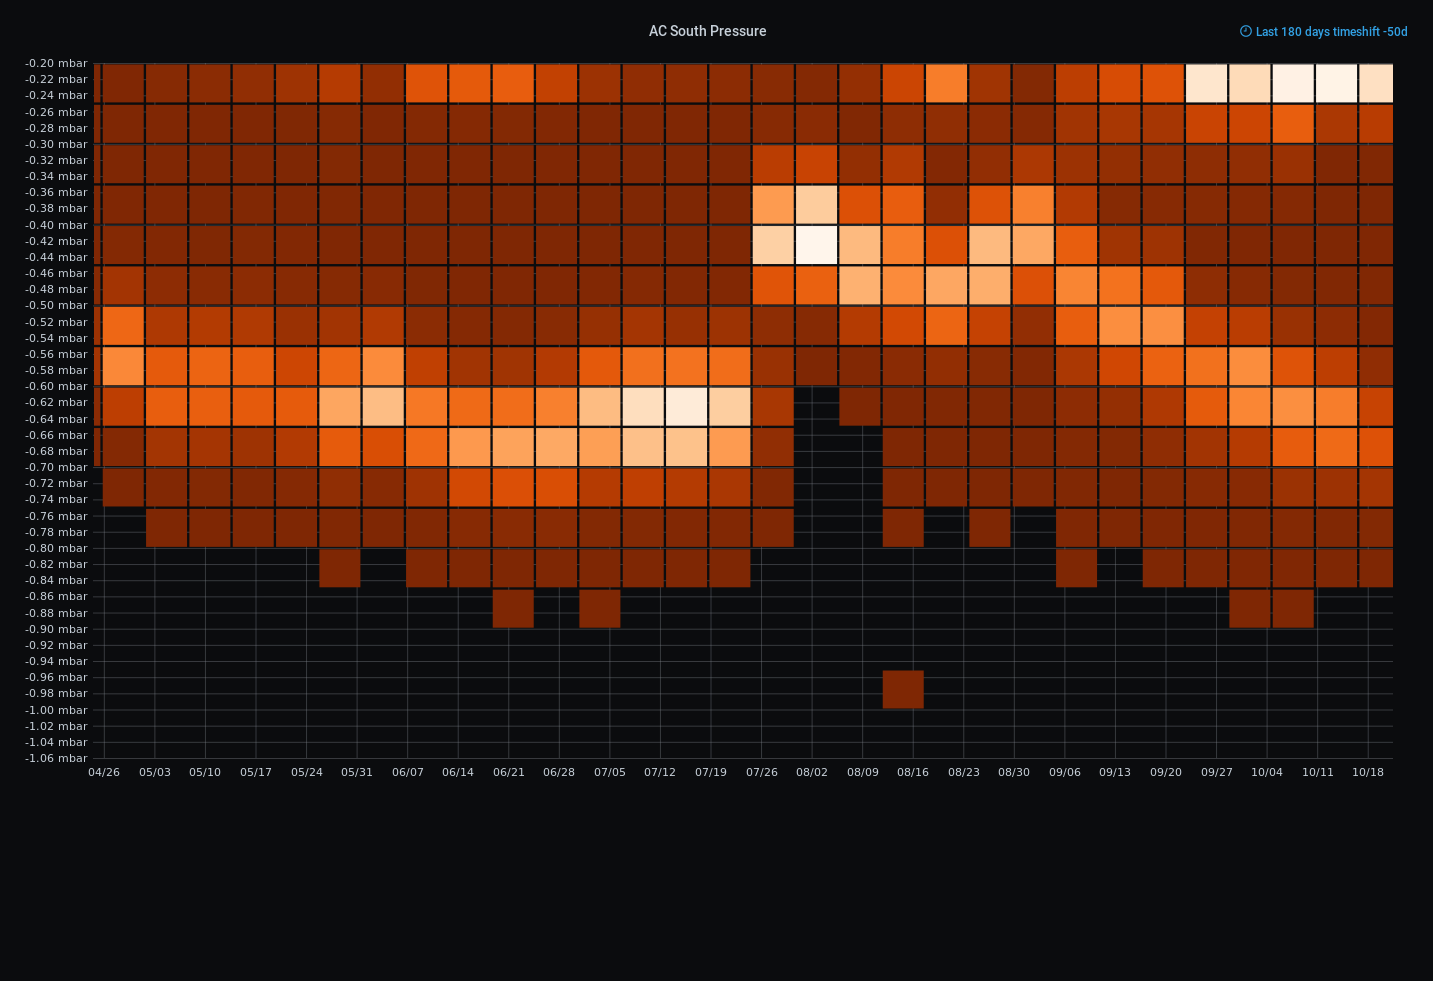
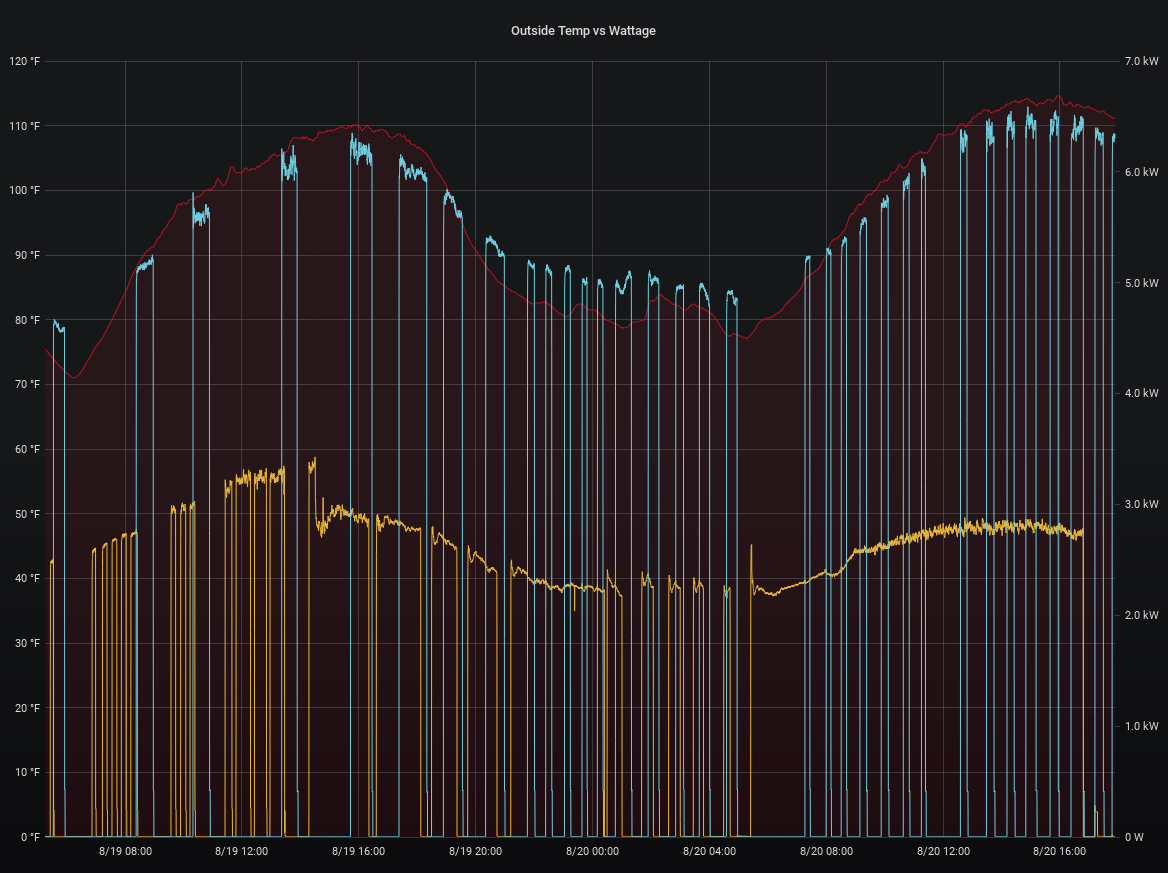
Step 3. Start collecting data, process results.


 Simon Merrett
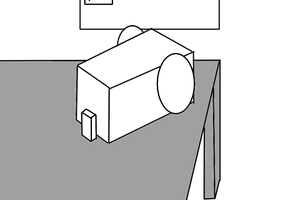
 minifig404
 sparks.ron
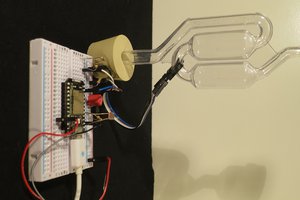
 Alex
Alex
Thank you for taking the time to present your work and sharing your thinking. Really interesting!
My a/c does not have replaceable paper filters - instead there's a fabric mesh that needs to be washed. I suppose the difference is that the paper filter will improve air quality, but I doubt that the fabric filter will.