 glgorman
The method that I am here describing certainly seems to work for the Ridgecrest Earthquake sequence of July 4-5, 2019; that is to say if we use the data from the seismograph at Geyser Peak, Ca. Perhaps the seismograph is picking up premonitory P waves which are efficiently filtered and amplified by the aquifer that feeds that particular Geyser. If we assume then that that aquifer is fed and extends down into therefore from a geothermal, i.e., volcanic rock formation extending up to three miles below the surface of the earth, then the volume of the aquifer might easily contain several million acre feet of water. Then if the geothermal source emits a gas such as sulfur dioxide or sulfur trioxide into the aquifer, those compounds could react with any naturally occurring Calcium Carbonate layers to produce Calcium Sulfate and Carbon Dioxide Gas.
Using a rule of thumb for water pressure of one pound per square inch for every two feet of depth, it is easy to see when the depth of the aquifer exceeds more than a few thousand feet, that the "critical pressure" of water, which is the pressure (usually over 3000 PSI) at which water no longer has a liquid or a vapor phase and a liquid phase. One possibility therefore is that a foaming action occurs when faint P-waves from a distant earthquake pass though the aquifer, and that quite interestingly enough, this foaming action produces an hydro-acoustic signal which arises in a fashion similar to the method of using a pulse counting sigma delta analog to digital converter. In effect, detecting premonitory P-waves which would otherwise be too weak to be detected using ordinary techniques, by in effect, counting bubbles!
This project therefore will attempt to examine existing public domain data available from USGS.gov and by using that data demonstrate how the rate of change of frequency of induced sympathetic vibrations can be used, or could have been used, or has been used (!) to forecast the near exact time of more than one major seismic event! The next step of course would be to automate that process, so that ideally the computations that need to be performed with respect of future quakes can be performed, not so much with the latest Watson/NVIDIA?Deep Learning/AI one million CPU system, but rather, ideally on a more Hacktivist acceptable platform such as Propeller, or Arduino, or even Apple II.
For more information see the YouTube video uploaded by "Celluloid Daydream" entitled "Music Transcription using Spectrum Analyzer" for a demo of the existing codebase (actually uploaded in 2009) that will be adapted and repurposed with this new type of event detection model. Also, if you know how to access the old Deja Archive on Google Groups, you can search for "glgorman earthquake" for some very OLD USENET posts, (which still exist!) and which describe the predictive P wave theory in further detail. Note - this is NOT the shake alert system which warns only when the earthquake begins - this system attempts to identify when major temblors are particularly likely, months, weeks, days, and even hours before a foreseeable major event.
Note as August 25. 2019 the Parallax Propeller 2 is not yet available, so I will be providing an alternative implementation of a suitable microcontroller-based event detection and analysis system in the near future. In the meantime I will update with code snippets describing the core algorithms, etc., based on the existing Windows C++ code base.
Until then - remember these words as you're headed out West, tell only your friends and to hell with the rest!

 Scott Bragg
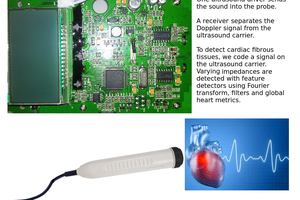
 Jean Pierre Le Rouzic
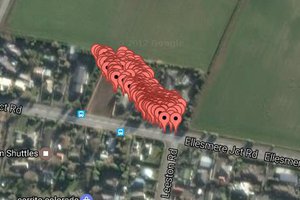
 Hugh Brown (Saint Aardvark the Carpeted)
Questions? Comments?