 Nir H
Nir HMonitoring pm2.5 and pm10 air particles with ESP32 and SDS011.
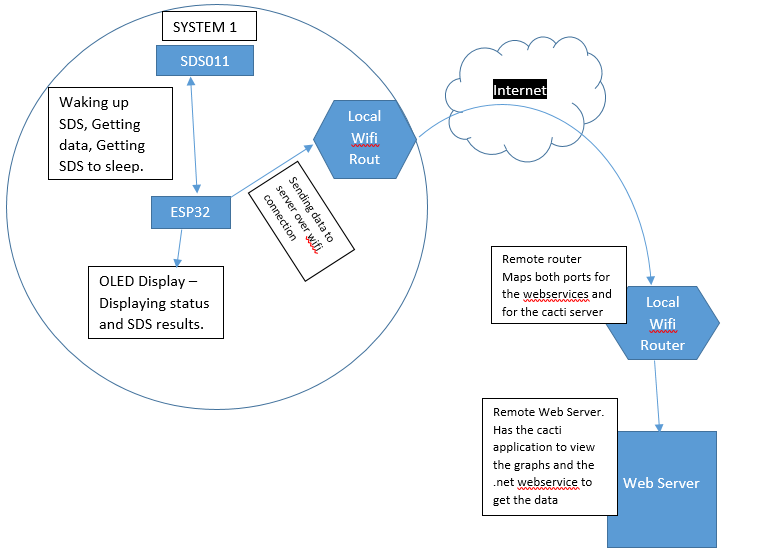
Work Flow
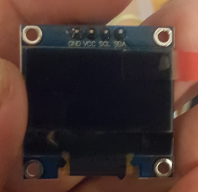
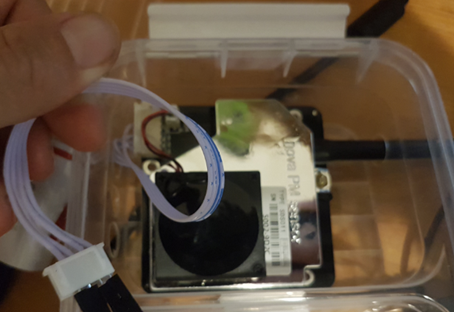
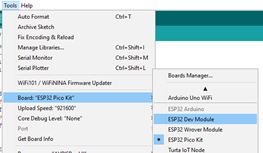
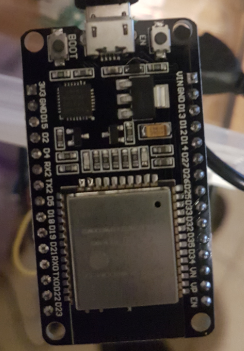
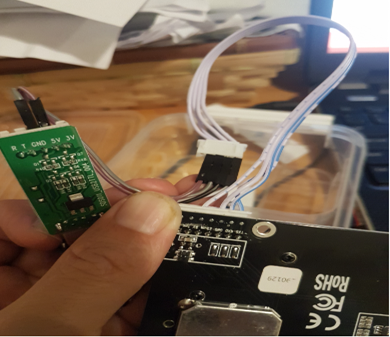
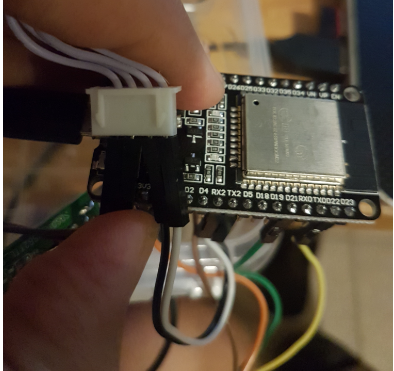
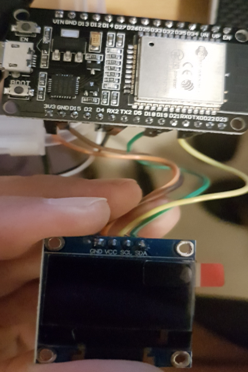
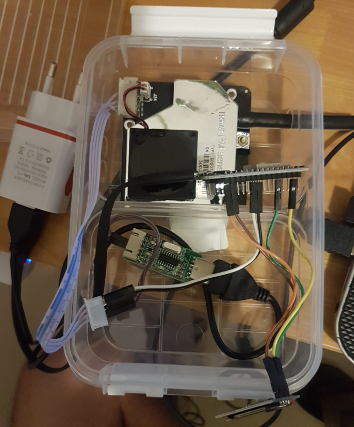
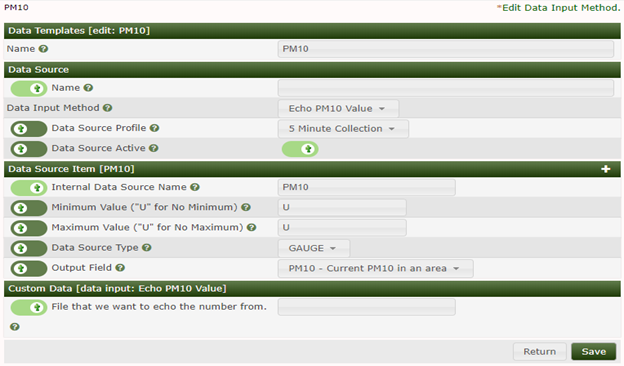
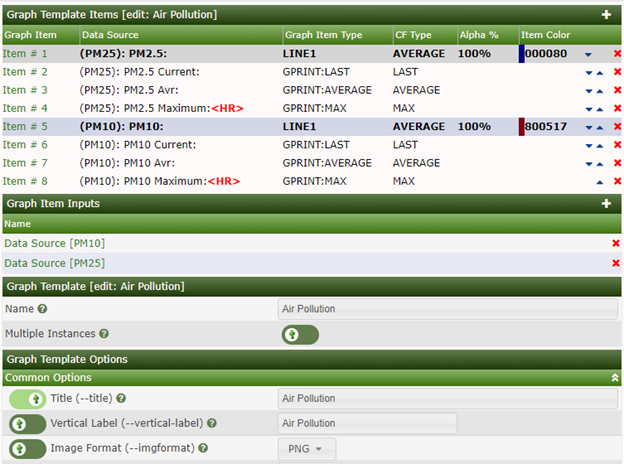
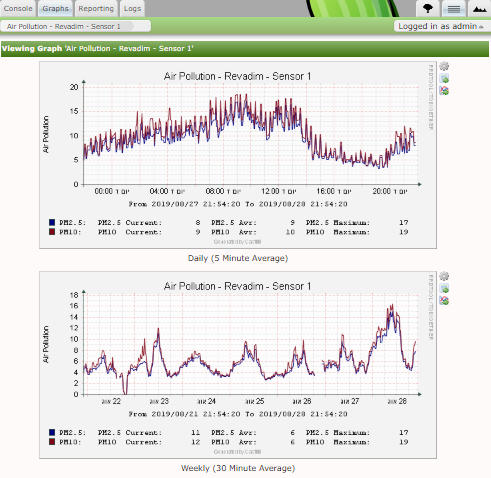
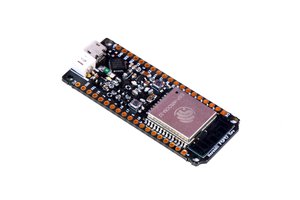
As shown above, the esp32 has a sds011(air pollution module) and a oled screen, the esp will connect to the internet of the local network using it’s onboard controller, will use the sds011 to get the correct pm data, will show it on the oled screen, sent it to the cacti server and then the cacti server will create graphs from it.


 Sandeep Patil
 Mauro Riva
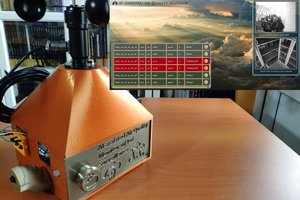
 kutluhan_aktar
 Initial State
Thanks for the project! I will try it this week. I will put the Cacti server on a RASPI. Hopping it will work!