 Bharbour
The firmware on my counter is set up to output the number of milliSeconds between count events. This morning, I carved up the parser program to generate a histogram of the time between events from a log file that I captured yesterday. About half of the log file was captured with an envelope of thoriated tungsten TIG electrodes was sitting next to the counter, and the other half is just background radiation level. The X axis is showing the number of milliSeconds between counts, from the minimum to the maximum that are in the capture file. The Y axis is showing the number of count events for that time between counts. There are 500 bins in this histogram, with time between events ranging from 21mS out to 31000mS, resulting in each bin being about 60mS wide. As an example, all of the events between 21mS and 81mS (minimum + bin width) are counted in the first point.
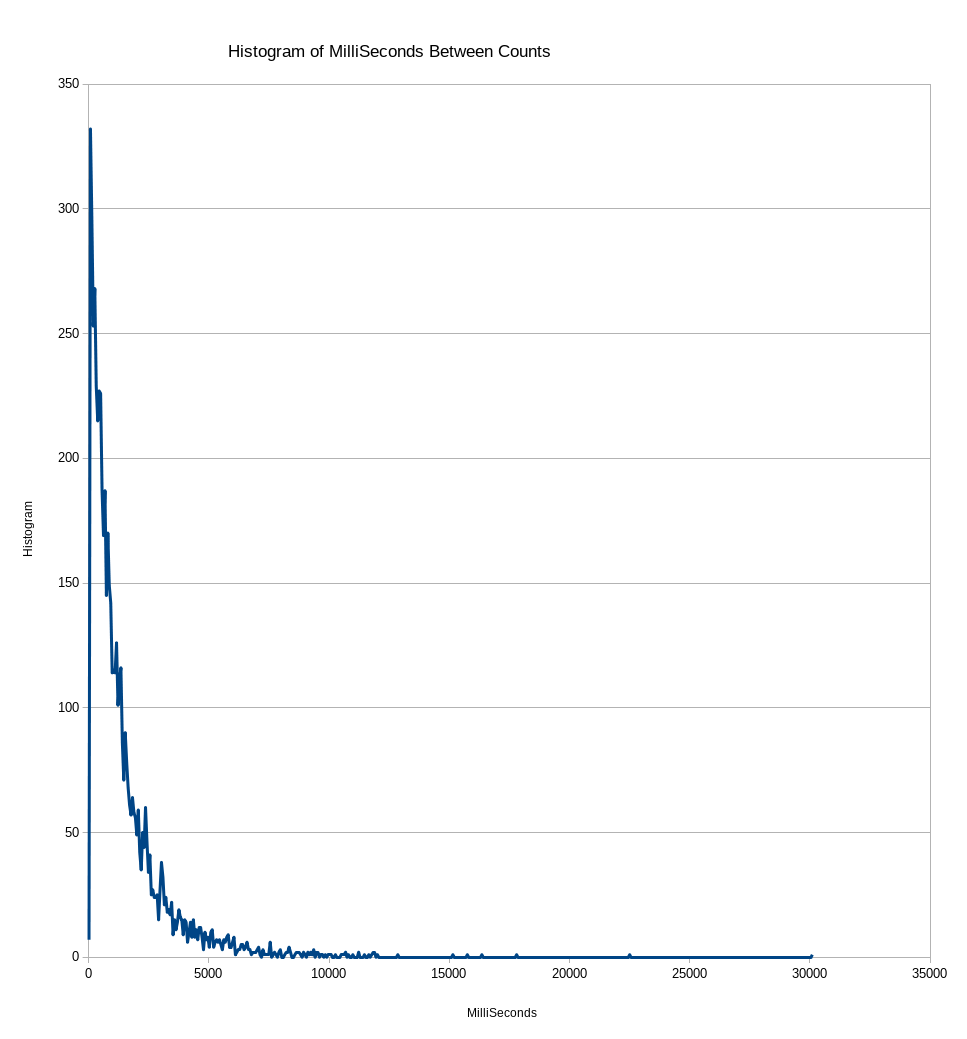
It has been a REALLY long time since I sat in a probabilities and sadistics class, but I was hoping that the curve was going to be flatter and spread out over a wider area. I suspect that if I had only background levels in the file, the curve would be a little bit more spread out at the low end. I will check this later, and if it is really noticable, I will post more on this.
9/15/2019 Update, Here is a plot of the count interval histogram with all data from background radiation, the TIG tungstens were are the other end of the house. There are no sources of radiation that I am aware of nearby. The data was collected mid afternoon. The counts/minute were averaging around 26 or so and this is a 3 hour acquisition set.
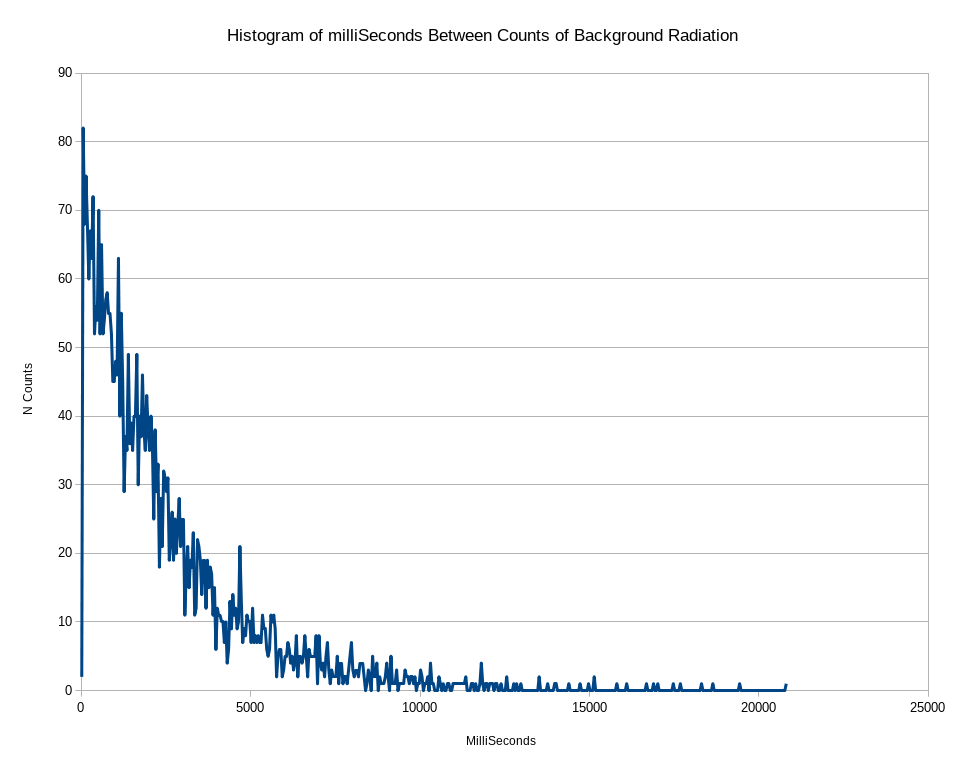
Comparing the two plots shows that the background only plot is somewhat wider at the at the low end, but the shape is pretty similar.
Discussions
Become a Hackaday.io Member
Create an account to leave a comment. Already have an account? Log In.