 Giulio Pons
1) Oxygen saturation and Covid-19
In this incredible period of our life we've learned a lot of things about viruses, lungs, surgical masks, soap and washing hands. Everybody read about symptoms like coughing, fever and breathing difficulties. We've also known that one way to measure this breathing difficulty is reading the amount of oxygen in our blood.
This measure can be read indirectly with a medical device called oximeter. You have probably already seen it, it's a non invasive device that is placed on a finger with some pulsating lights that do the work.
You can find it on Amazon, for example this one here:
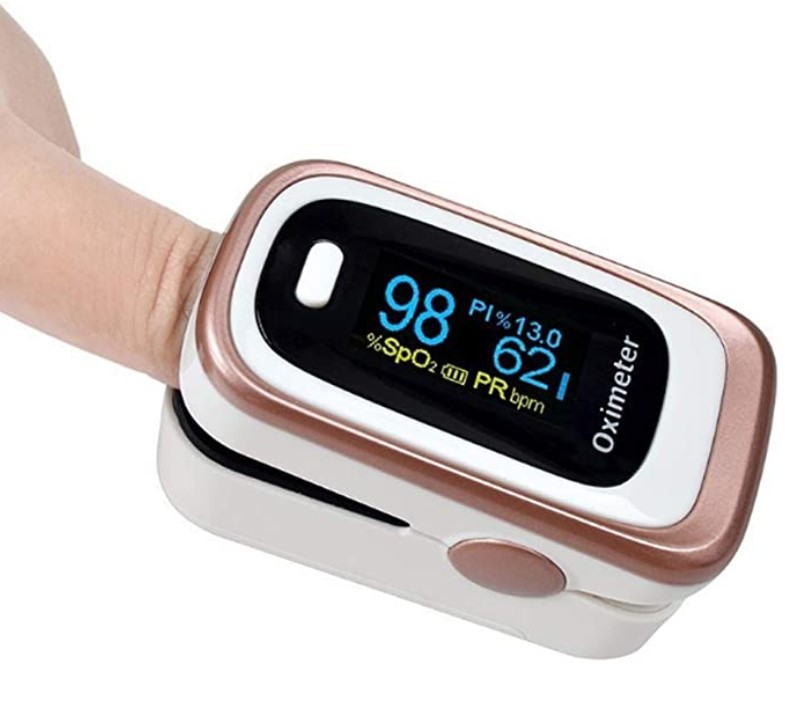
Normally, when you're ok, you have a percentage of oxygen saturation near or grater than 95%. When saturation goes down below 90% and you have cough and fever, it's a problem.
So we will try to build an oximeter!
2) How does an heartbeat sensor work
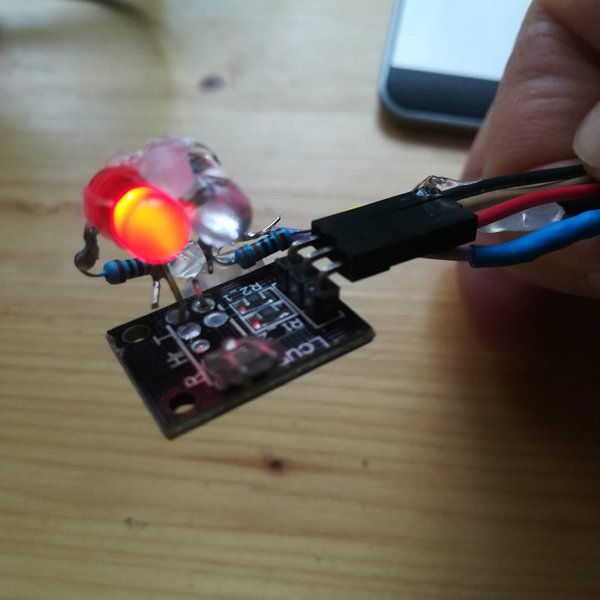
To measure oxygen saturation, we first need to learn how an heartbeat sensor work. I've got an heartbeat sensor named KY-0039 which is made with an infrared led and a photodiode. The photodiode must be able to receive 940nm infrared light. Since we also need (in next steps) to receive the red light (if you're building the sensor from scratch) you will need a photodiode with a wide spectral range to receive light new 600nm (red) and near 940nm (infrared); this one seems ok: LPT 80A (but I'm not able to say if it's the exact one used in the KY-039 sensor).
I've found it in a kit with many sensors, you can see it in this pic (from internet):
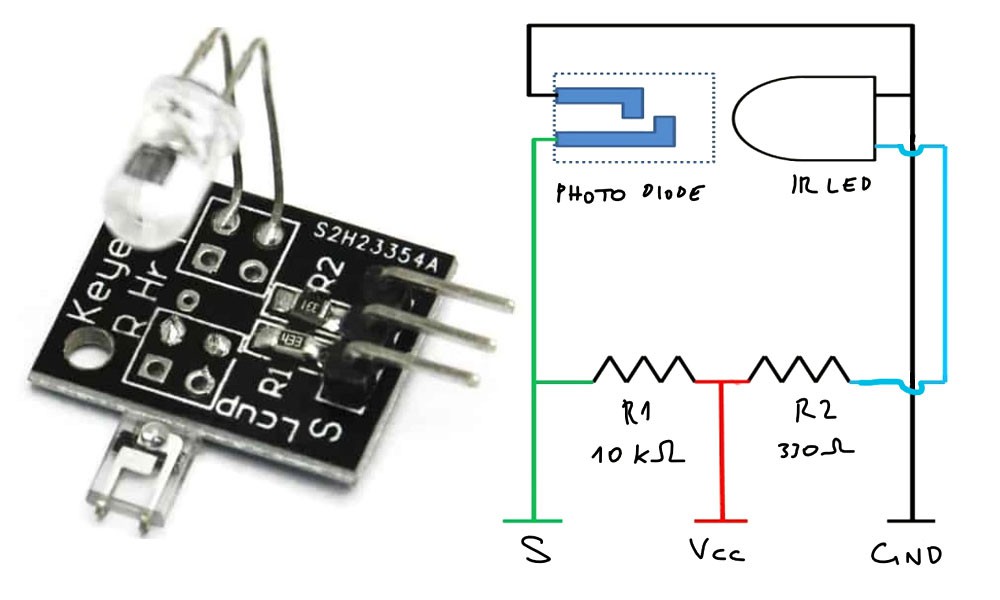
As you can see in the circuit, it's just a infrared led that lights a photodiode. There are also two resistors to protect the led and read the small signal from the sensor. The finger is placed between the photodiode and the infrared led like this photo (from this site):
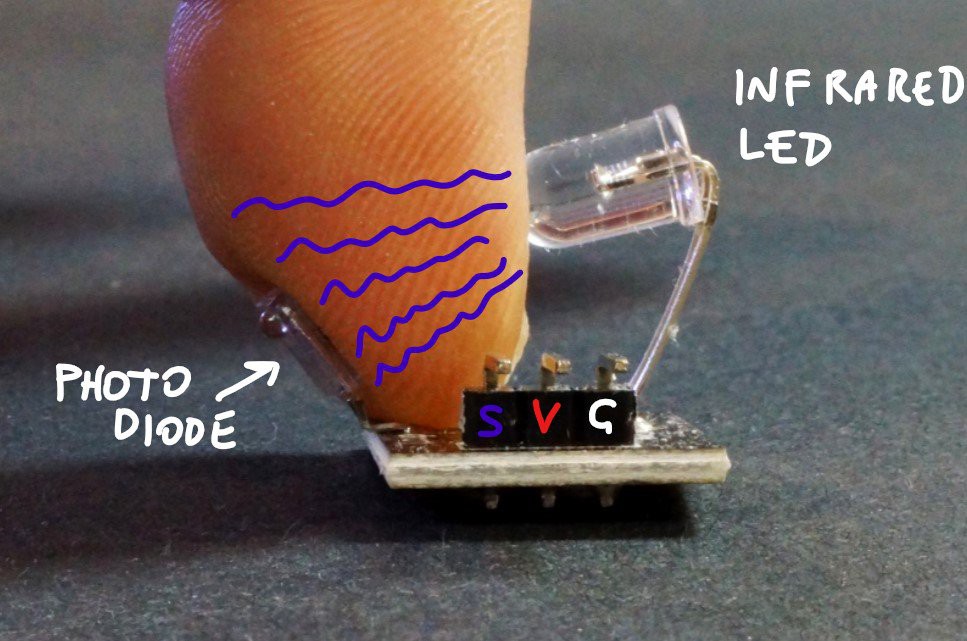
The light emitted by the infrared led is partially absorbed by the nail, the skin, and all the other parts of your finger, but it's not constant because it changes following the changes of the blood running in your veins. When your heart makes a beat the blood is pushed in your veins and the light absorption changes. With the S pin of KY-039 we can measure the current generated by the light absorbed by the photodiode.
3) Measuring heartbeats by finding the peaks of a signal from a sensor
Reading a good value from a variable signal it's not so easy, th signal is very low and there is a lot of noise, so we need to make some math to find values that mean something useful.
I've got to thank this useful post from Johan Ha, which explains how to plot the average of a small number of samples from the signal and it also explains how to remove the noise made by an home lamp (that light has a small noise). But I've also find that my heartbeat sensor records good signal with good ambient light, if I cover the sensor with a black cloth the signal has too much noise.
In its work Johan Ha makes an array in which push a value and drop a value to mantain the average of the last X values read from the sensor.
He has also described a way to find the rising of the signal, when there are N values growing (when a value is grater than the preceding value for N times), it is a peak.
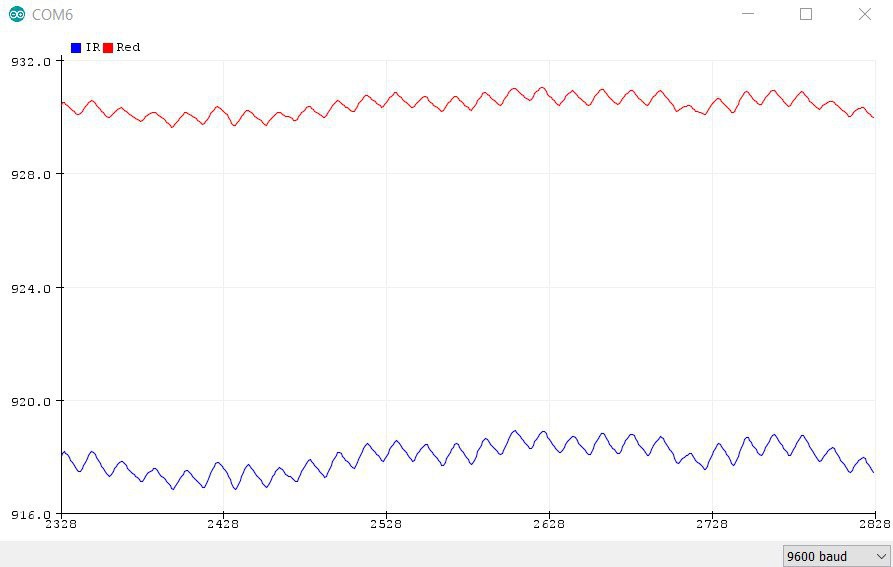
Using SerialPlot I've seen better the number of measures that allow us to define a correct N (rise_threshold constant in the code). In this chart below if you define a number grater than 7, for example, you will miss some beats.
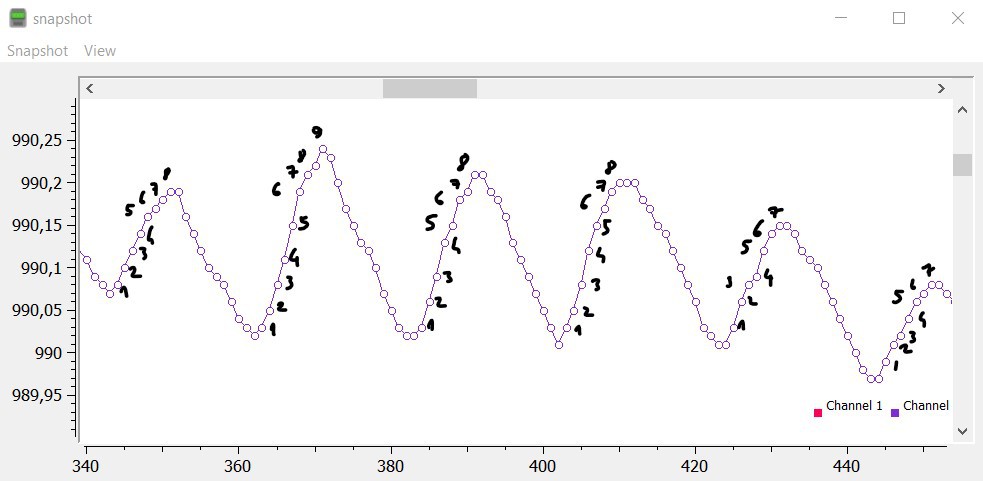
Once you've find the peaks, just count them, or calculate the time between a small serie of beats to determine the BPM rate (Beats Per Minute).
With these tricks, counting the number of peaks and BPM is quite easy.
4) How to hack the KY-039 sensor to find oxygen saturation
Our blood absorbs light in a different way with the change of the wave-length of the light. The red light is absorbed better by the blood with more oxygen, so we can compare the measures and find the percentage of oxygen in our blood. That value is called Sp02%.
SpO2% stands for peripheral capillary oxygen saturation, an estimate of the amount of oxygen in the blood. More specifically, it is the percentage of oxygenated haemoglobin (haemoglobin containing oxygen) compared to the total amount of haemoglobin in the blood.
Our KY-039 has just an infrared led (950nm wavelength). We need to add a RED led (600nm) connected to Arduino pin, we also need to disconnect the IR led from the Vcc and connect it to another Arduino pin. I've also used two 330 Ohm resistors to protect leds.
Here is the schematic of the modified sensor:
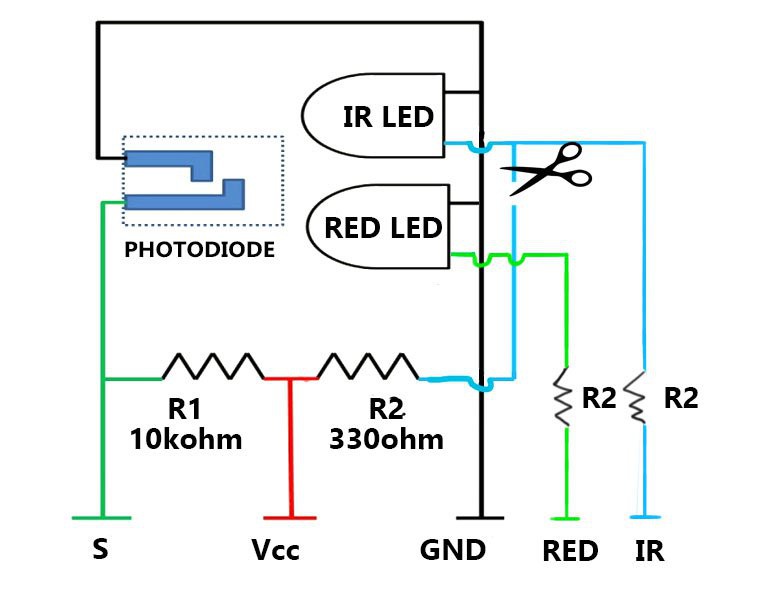
In this way we can tutn on the IR led and read the value from the KY-039 S pin, then we can turn off the IR led and turn on the RED led, and read the value from the KY-039 S pin.
Here it is:
If we plot the two charts we can see that IR values are always lower than Red values.
5) How is measured saturation
Saturation is calculated as a function of a R parameter, which is defined in this way using maximum and minimum from the two signals:
Rnum = (REDmax - REDmin) / REDmin;
Rden = (IRmax - IRmin) / IRmin;

R = Rnum / Rden;
The oxygen saturation level (SpO2%) is a function of R (I found this information on a paper by a student of the university of Politecnico of Milan, Italy, but it's widely available on books about the argument).
Each instrument has it's own specific R function and it's needed calibration with another oximeter to find the right function that connects R with SpO2% (we'll see it later).
As discovered in section 3 of these project details page, counting the number of peaks is quite easy, but now we need to find max and min values of the two curves (both for RED led and IR led).
To accomplish this job we need to evaluate the "period" of the heartbeat (how long an heartbeat lasts) and divide it with the sampling rate (in my code it's 40 mmsec, 20 for RED and 20 for IR).
The period of the beat is the time that passes between two rising curves in the signal.
So we can analyze the last N samples (where N = period / 40) and find REDmax, REDmin, IRmax and IRmin values.
With Max and Min we can calculate R.
R, N and period are calculated every beat, so the calculus of R is also done for every beat.
From R to SpO2%: how to calibrate the homemmade oximeter?
The function that links R with SpO2% can be simplified with a straight line (SpO2 = K * R + M). So we need two points to determine the K and M parameters that defines the straight line equation, two couples of value of SpO2% and R. The only way to find these 2 points is using another oximter and read the values from its display.
The new oximeter will be the reference, we read the SpO2 value while measuring the R values from our homemade oximeter.
You need to pay some attention in calibration, our homemade oximeter is exposed to ambient light, so you should keep the same light everytime. I've tried to cover it with a black cloth, but with poor light the signal is too low and it's too confused with noise, with poor light I can't read beats and find maximums and minimus values.
Try to make many measures.
Try to lower your SpO2% by keeping the breath or by breathing in a plastic bag (re-breathing), so you have two points on the straight line that are not too close.
When you find two good points proceed to solve the 2nd degree equation.
In this way we can found K and M parameters for my oximeter.
Now I can print both bpm and SpO2 values for every measure of R !!
Finally, I've also added a display to show all the numbers and I've made some changes to the code to handle and an array of measures, so I show values on the display only if I've found at least 5 measures of the period that doesn't change too much (±10% of the period length). In this way I remove values that changes too much due to the poor components or change of ambient lights or finger movements, but even with this trick the measures of R are not very stable and Saturation fluctuate a lot. If I would amplify the signal probably it will become a professional oximeter!