 Giulio Pons
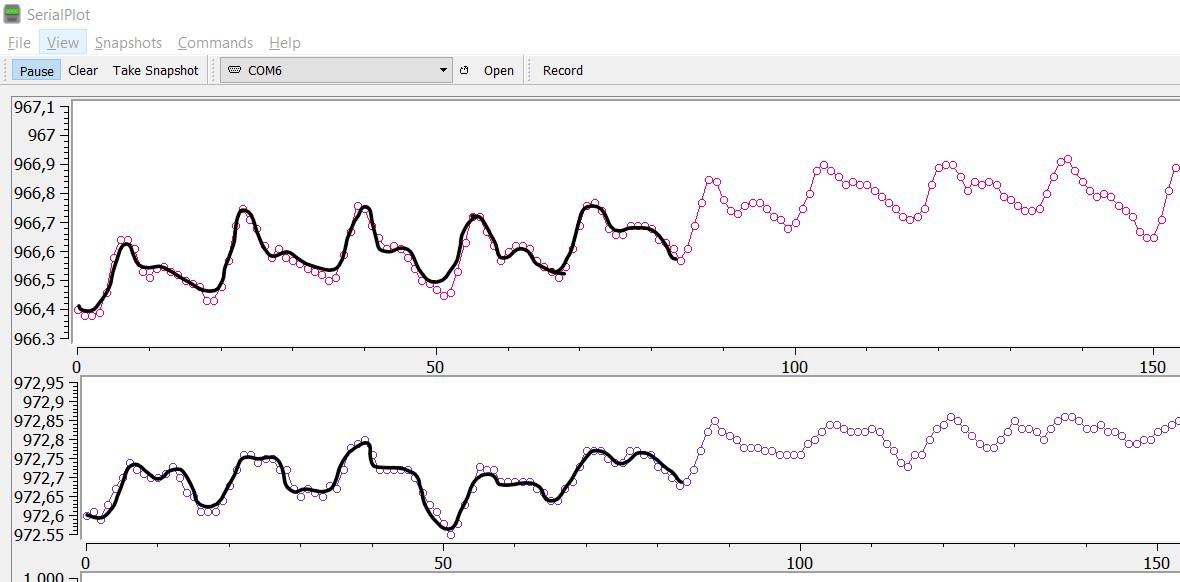
I've modified the sampling parameters, after the average on 20mmsec (to remove electric light noise) I use 1 sample to plot the chart. You can see better the typical "dicrotic notch".

Changing the number of samples that are averaged smooths the curves.
I count the peaks, so I can estimate the period of the heartbeat, the period is the time between two rising curves. Knowing the period and the times I sample the signal I can determine how many samples there are in a period: I make a sample for IR (20 mmsec) and a sample for RED (20 mmsec), so every sample happens every 40 mmsec (I suppose calculation time is enough small)
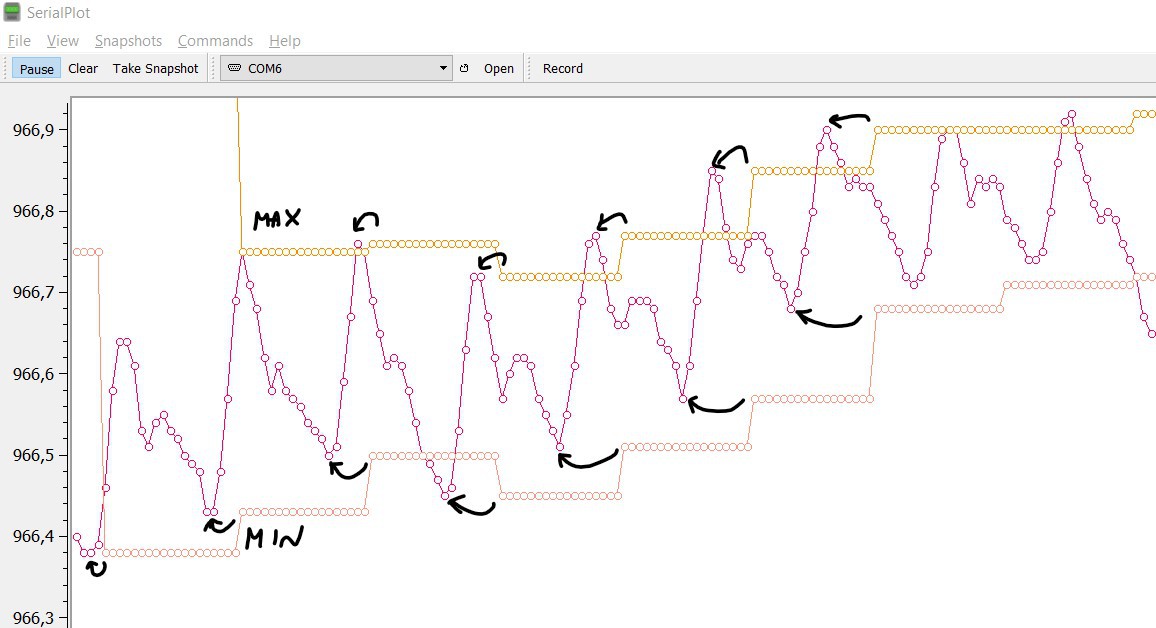
Knowing this number, I can search in the last N samples for Max value and Min value. N is period/40.
Now I have Min, Max and can determine every N samples the R coefficient.
The period, N and R are not fixed. They are continuously calculated.
I've tried to plot min and max, but when I plot they are not synchronized with the signals, because they are calculated a period later.
Now. I have to connect R with Sp02, this work is known as "calibration" of the oximeter.
Do I need another oximeter to calibrate mine?
Discussions
Become a Hackaday.io Member
Create an account to leave a comment. Already have an account? Log In.