 Mayke
MaykeHey fellas
It has been some time since my last update on the project, but I had some unexpected difficulties.
The first one is that my Nvidia Jetson TX2 dev board developed a static electricity problem. After being switched on for some time, it would turn off suddenly. The problem just got worse so, I had to bid for a used TX2 kit on ebay (they are not common to come by these days in the UK). It wasn't chip though and I wish I would not have spent money on things I already have. In the meantime, I used a Jetson Nano as backup but the performance is not the same so, back to the TX2. The good thing is that I simply swapped my TX2 module from board to board and that was it.
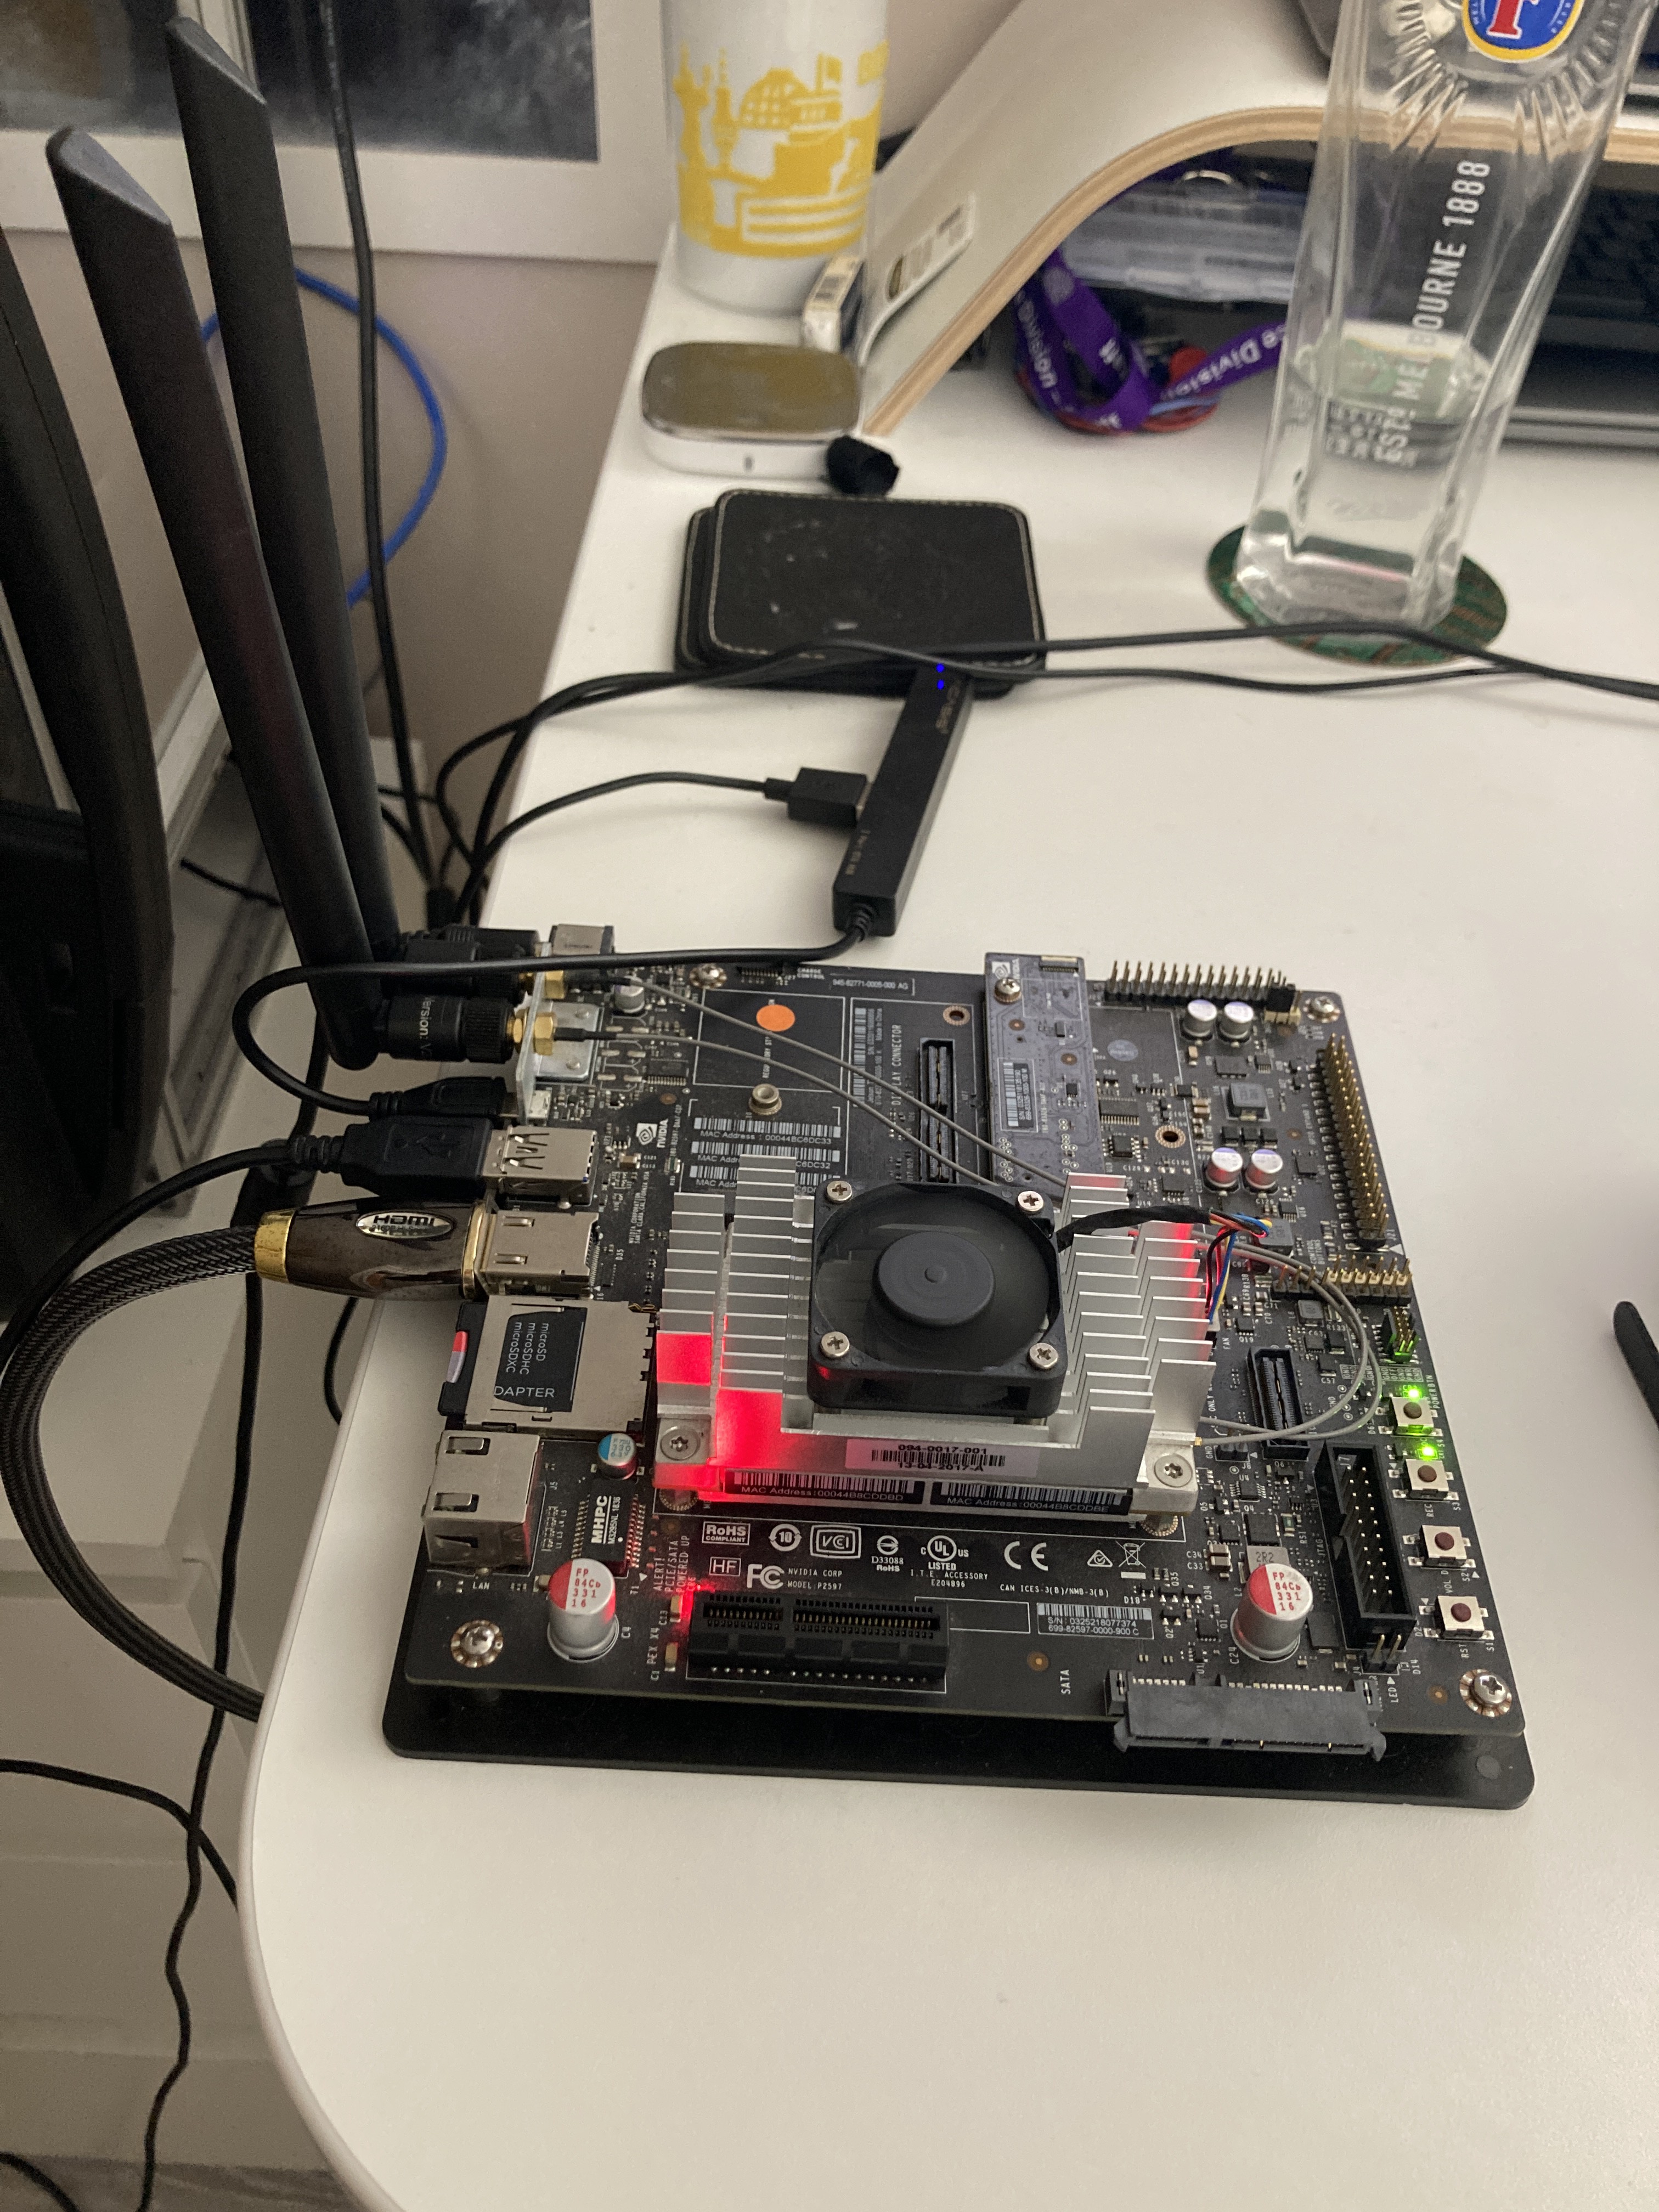
Above: the new member of the family.
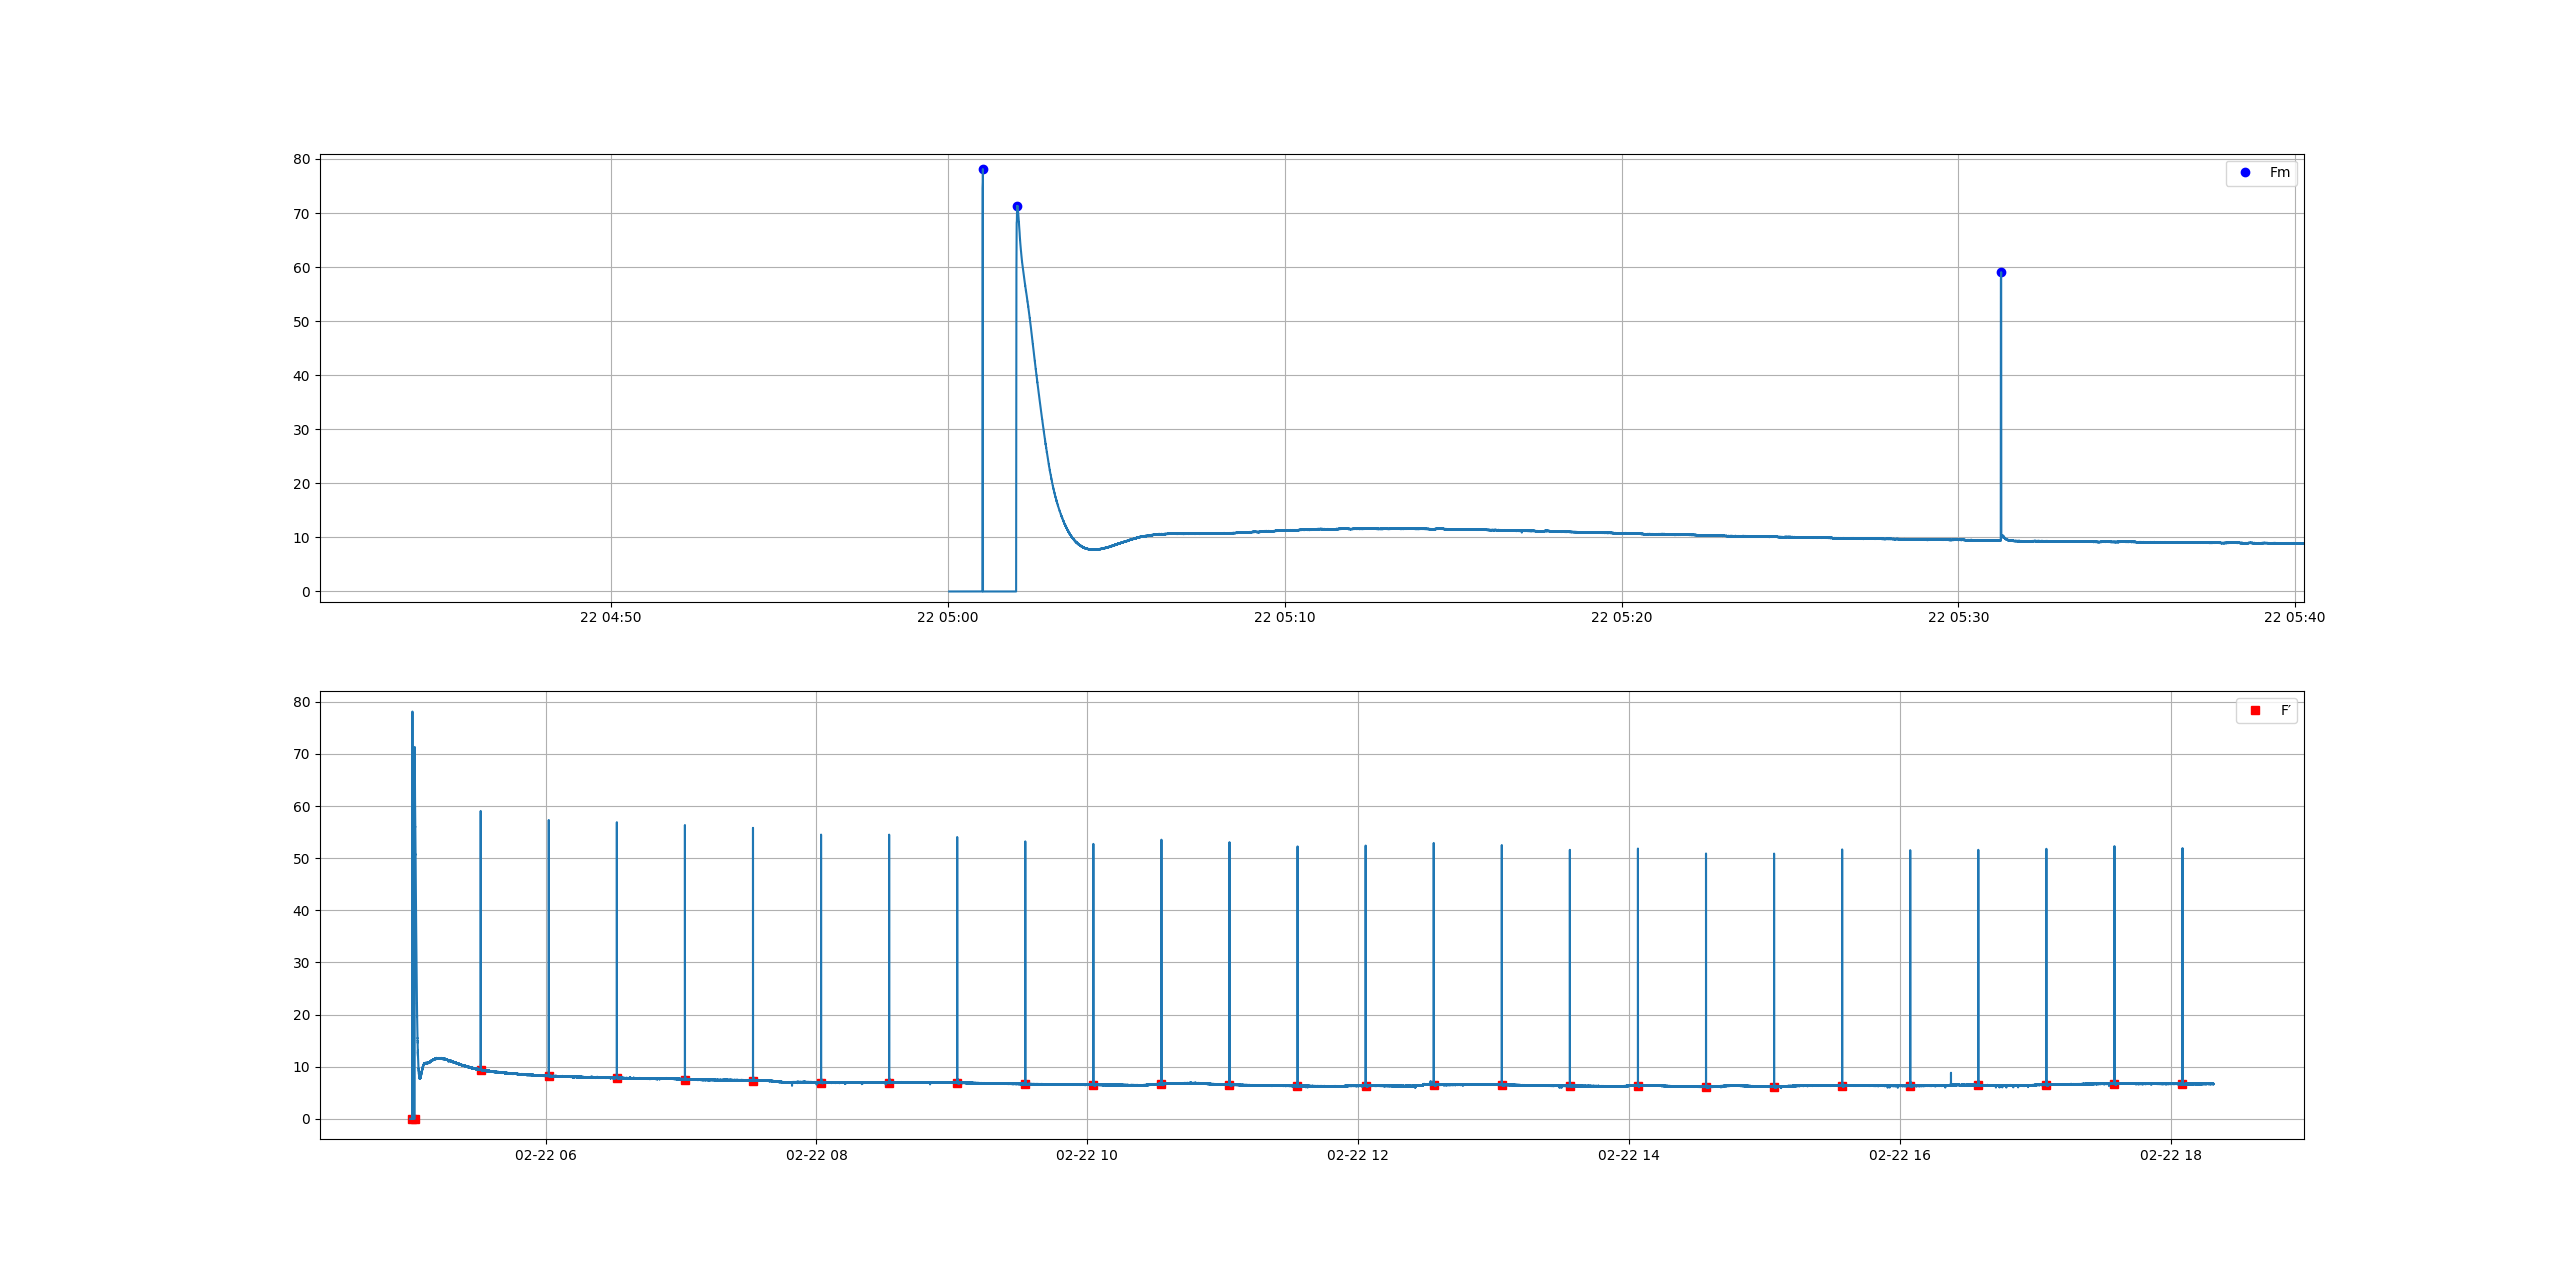
The original idea was to test whether we could measure some important fluorescence indicators, namely, Electron Transport Rate (ETR, or rETR for relative ETR). For that we need to calculate the peaks of the signal and the valleys, immediately before the peak. Thanks to Stackoverflow and a bunch of helpful people that post on these forums, I could get this working in a matter of days. The graph below is how the data looks in one of these experiments. The plant is dark adapted the whole night, then a flash of light is applied in darkness and, after few minutes the actinic light goes on. You can see the detail on the top graph.
We then use script.signal import find_peaks
from script.signal import find_peaks
find the peaks and valleys
peaks, _ = find_peaks(y, prominence=6)
valleys, _ = find_peaks(-y, prominence=1)
and then we calculate PSII:
# PSII Formula Fq'/Fm' (as per nomenclature of Murchie & Lawson 2013)
PSII = (last_peak - last_valley) / last_peak
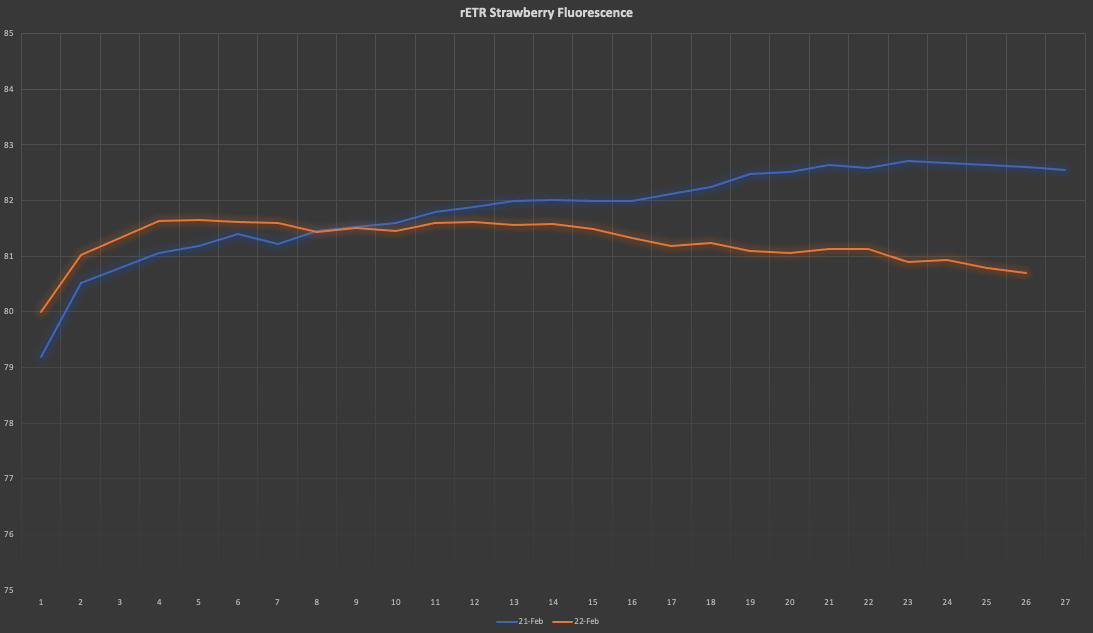
with PSII and some other numbers, we can then calculate the rETR and produce a graph like the one below, where differences among daily rETR rates can be plotted:
The savvy guys around may have already spotted a caveat from the graph with the fluorescence signal, there is no F0, which is the very dim light that is switched on at the beginning and that enables us to calculate F0. First of all, using a very dim light is very dumb in this case because the camera (already heavily shaded by a long pass filter) will not pick up the weak signal. Our second option then is to apply a very strong pulse, but I will leave the academics to explain it better:
For a usable fluorescence image to be generated, the CCD must absorb a minimum number of photons. Increasing the exposure time and/or inci- dent, PPFD will increase the number of photons accumulated. However, when imaging chlorophyll a fluorescence, increasing either of these will often impact on the de-excitation processes at PSII, a problem that is most acute when imaging Fo. Also, exposure time is often limited by the accu- mulation of long wavelength photons (dark noise). With the FluorImager system, an Fo image is generated within a 16.7-ms exposure, during which 2-s pulses (PPFD of 4,000 mol m2 s1) are applied every 300 s. Although the same number of photons could be delivered during a single pulse of approximately 110 s at the same PPFD, the long exposure time at low average PPFD has the advantage of allowing for the opening of PSII centers, thereby increasing the accuracy of Fo measurement.
The above text is from Barbagallo et al. 2003 (accessible in the following link)
Another very interesting paper is Oxborough 2004 which states the following:
For example, the generation of a usable Fo image might require a single integration period of 1 s at a photon irradiance of 1 mmol m±2 s±1. As an alternative, the same number of photons could be delivered to the sample during 10 widely spaced integration periods of 100 ms each, at a photon irradiance of 1000 mmol m±2 s±1. While the first method will accumulate 1000 times as much dark-noise as the second, the second method will accumulate 10 times as much read-noise as the first.
But to my best abilities, with the type of LEDs that I've got, I haven't managed to get a pulse of light under 500 us with the Arduino Uno, even though I have changed the PWM frequency. So, all I have managed to do is to calculate F0 by triggering a pulse for 500 us, which theoretically means that, is 200 us above the threshold to trigger a photosynthetic response. I am testing different options at the moment and I hope to resolve that soont. In the meantime, my F0 is a fixed number that I have reached with different tests.
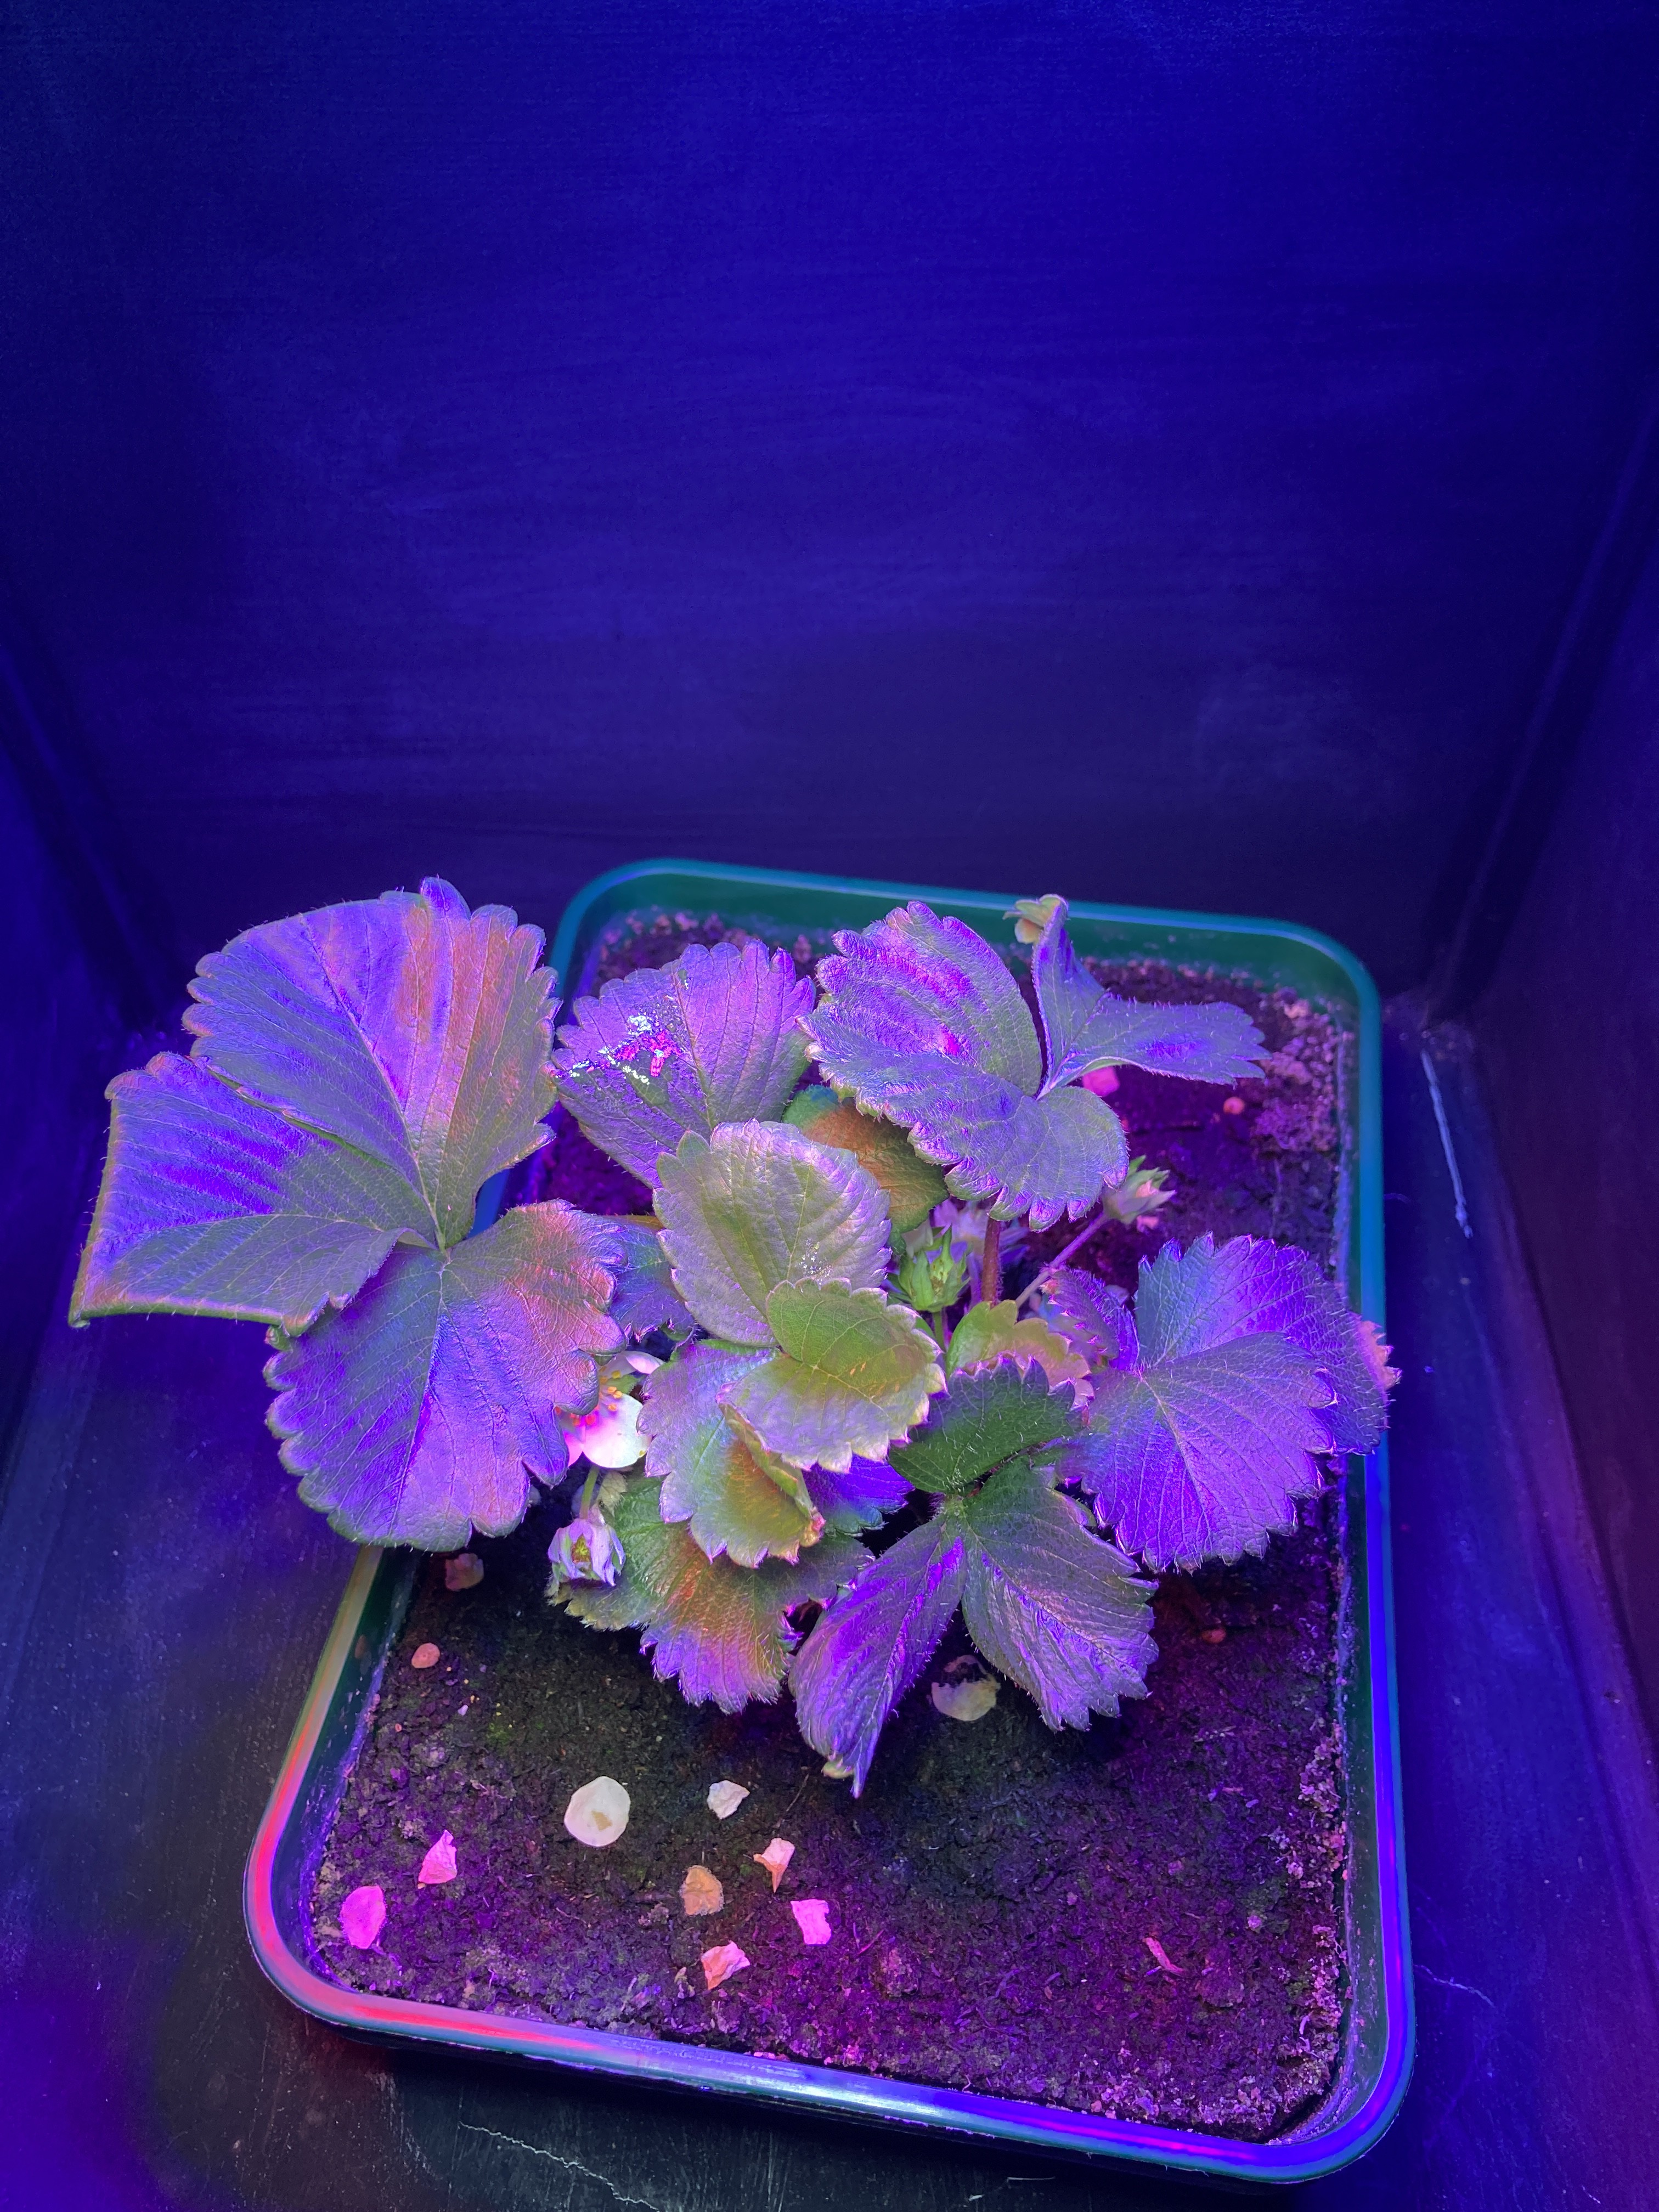
Picture: the new happy inhabitant of the light box. A strawberry plant (fragaria ananassa) variety Elsanta developing fruits.
The strawberry plant that you see in the picture has been growing like mad, with a huge amount of flower trusses coming out in the last week and it doesn't stop growing. I keep humidity levels elevated to avoid tip burn (a common problem for glass house strawberries) and this weekend I am going to install the humidity and temperature sensors, as well as soil conductivity to add more data to the feed.
Discussions
Become a Hackaday.io Member
Create an account to leave a comment. Already have an account? Log In.