From the Project Description:
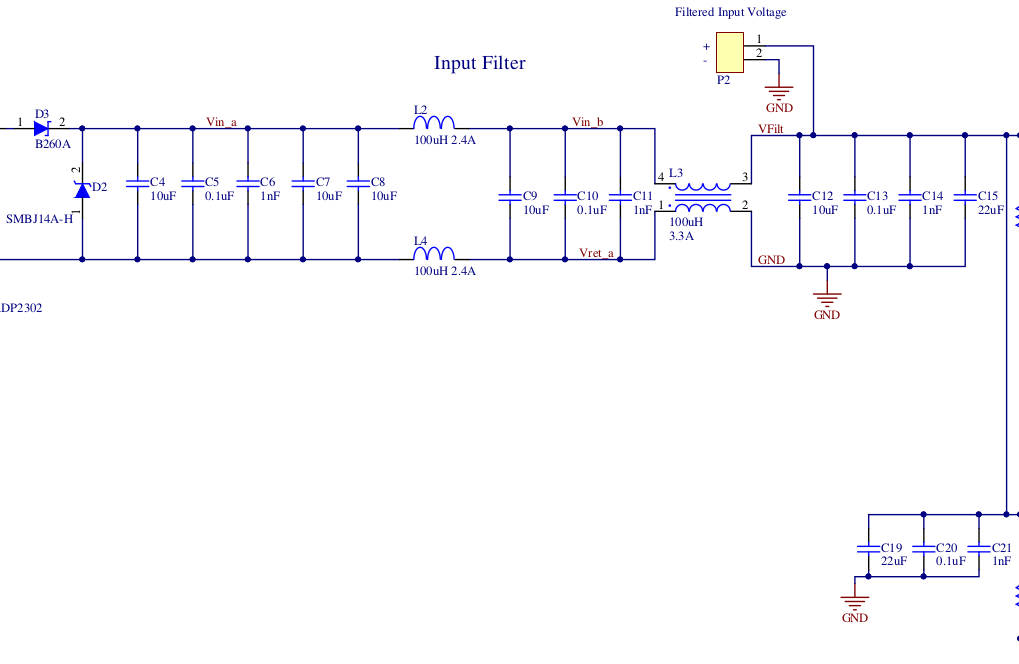
"There is some debate about the use of multiple parallel capacitors of different values in filters. The parasitic inductance of capacitors mean that large capacitors that are capable of supplying the instantaneous current demands stop looking like capacitors at disappointingly low frequencies. Electrolytic capacitors are really bad in this respect, but the ceramic chip caps suffer from it as well. Lower value capacitors have lower parasitic inductance, so they continue to behave like capacitors to higher frequencies, but won't supply much energy. The most obvious solution to this is to put some smaller value chip caps in parallel with the high value caps in the expectation that the high value caps will supply the instantaneous current while the low value caps will provide low AC impedance to higher frequencies. I have seen several competent people claiming that this idea does not work. I have also heard some people claiming that it does work. I want to see for myself, so the input filter design used here has sites for a range of capacitors.
The new PCBs came back from OSH Park on Friday. In order to test the behavior of the input filter and to attempt to determine if the parallel capacitors spanning a range of values contributed to better high

frequency filtering, I populated all of the inductors on the board and just the 10uF caps C4, C7, C8, C9, C12
and tested the board with my home built Scalar Network Analyzer, sweeping from 100KHz to 30MHz.
Next, I populated the 22uF caps C15, C19 and repeated the sweep.
Then I populated the 0.1uF caps C5, C10, C13, C20 and ran another sweep.
Finally, I populated the 1nF caps C6, C11, C14, C21 and ran the last sweep.
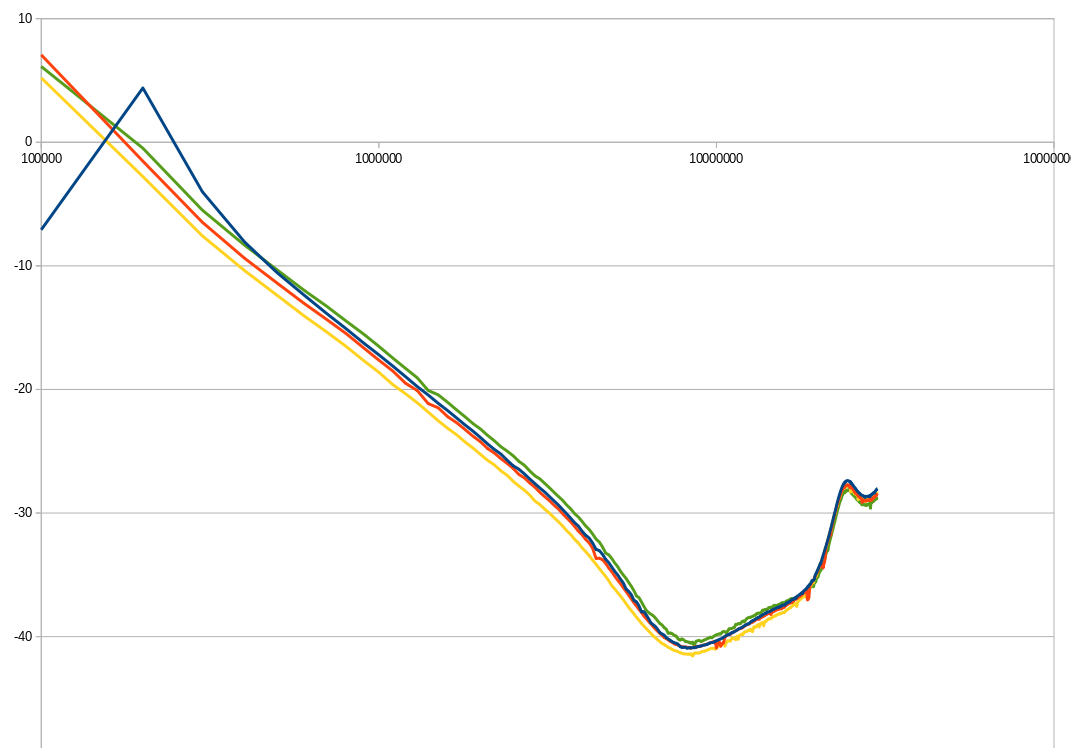
The results of the 4 test runs were almost indistinguishable from each other. This is the behavior that I would expect if the individual caps just combined into one capacitor "blob". It is possible that 30MHz is not high enough to see the individual capacitors contributions, but I am not set up to test to higher frequencies right now.

The plot shows Attenuation in dB on the Y axis and Frequency plotted logarithmically on the X axis.
The blue trace is with only the 10uF caps and the inductors populated. I am not certain what the extra peak is around 200KHz. The traces appear to converge as the frequency increases. I was expecting that the traces would start to diverge around 5 to 8MHz, as that is where the manufacturers data sheets show the parasitic effects becoming dominant on the large capacitors.
I believe that the minimum around 8MHz is the parasitic capacitance in the inductors L2 and L4 reducing their effective impedance. This is supported by the fact that all of the plots show a very similar feature.
Until I can test this farther, I am going to assume that paralleling a span of capacitor values does not work as I hoped.
 Bharbour
Discussions
Become a Hackaday.io Member
Create an account to leave a comment. Already have an account? Log In.