Close
0%
0%

Data dashboard

Real-time data visualization software

Similar projects worth following
Data dashboard is a visualization software made in QT framework. It's feature rich and provides several tools for receiving, visualizing, logging and manipulating data.

tl;dr

Intro

Recently, I grabbed an IMU and was looking around for some tools I could use to log and visualize the data. I saw some YouTube videos where people showed off their IMU code by rotating a simple cube on their PC with data being sent through a serial port. I was soon disappointed to find no generic tool I could use to visualize and capture various data formats returned by an IMU.

So with this project, I went on (initially) a month-long break from IMU to put together a comprehensive tool for capturing, visualizing, logging and manipulating data sensor data. Its application, although tailored to IMU, can be wider to other types of sensors and sources of real-time numeric data.

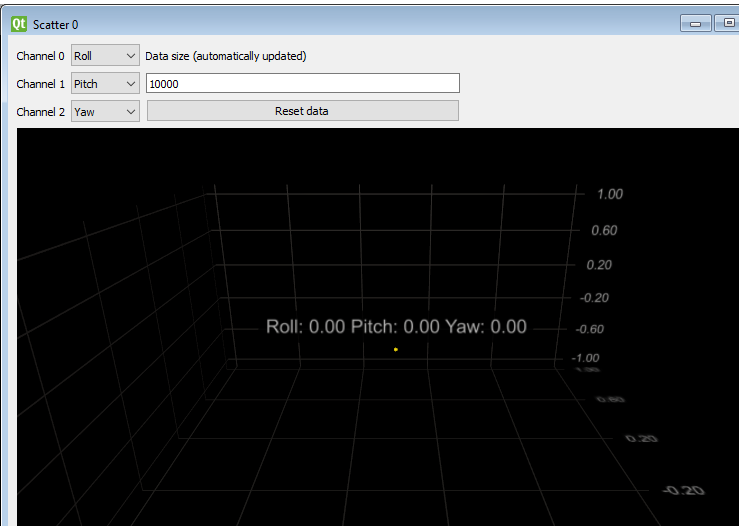
The result is a QT application which currently features 3 ways of visualizing data: 3D orientation cube, 3D scatter plot and a line plot. Data is received through a serial port, although I plan to expand it to a network port as well, and can be selectively visualized in the graphs above. In parallel, input data can be logged to an external file (e.g. .csv) and there's an option to perform simple math operation on input data.

Video an screenshots demonstrate current capabilities, which I think are sufficient and stable enough. However, this being a non-professional software, some minor kinks can be expected.

All that is very nice, but what actually works

It's currently possible to:

  • Read data from serial port or network socket, in a customizable frame format
  • Perform simple math operations (add, subtract) on serial channels to create virtual math channels
  • Visualize any 3/4 channels as 3D orientation in Euler angles or a quaternions
  • Visualize any 3 channels in a 3D scatter plot. Zoom, pan select individual data points
  • Visualize any number of channels in line plot(s).
    Zoom, pan, auto-adjust axes to inspect regions of interest
  • Log all data channels into a file
  • Retain configuration between app restarts
  • Run precompiled release for Windows & Linux; compilation instructions
  • Internal run log saves events during runtime, making it easier to report and diagnose faults

What is not possible:

  • Visualization at high data rates (currently tested up to 200Hz, 5 input channels)
  • Running scatter plot on Ubuntu 16.04/18.04 (something related to LLVM) - seems fixed in v1.0

  • 10. Jan: ​Release v1.0

    Vedran01/10/2021 at 18:25 0 comments

    It's now around 3 months since the first commit on this project and I have done what I initially wanted: plotting from serial port or network socket, with a bit of flexibility when it comes to data format. Today's release of version 1.0 marks closure of this project for any big new features as I got what I needed out of it. With that being said, I plan to leave it on github with all the precompiled releases for people to use and I'll take into account any bug reports (and smaller features) as they come, but I don't want to dedicate as much time to it any more. It's been fun for a while ^^

    New features:

    • TCP socket as input source (plot data from a TCP socket)
    • Added incoming data rate estimator
    • Minor visual changes
    • Data size parameter is now individual per plot, not per plot type as before
    • Scatter plot is now reset whenever an input channel is changed
    • Config file is now versioned in order to be applied migrations in future releases
    • Added program icon

    Bug fixes:

    • Fixed a crash caused by improper handling of objects when closing a plot
    • Math components used to be loaded in the wrong order on startup; causing them to not be applied until math channel has been re-enabled
    • Math component IDs were not as unique as expected, causing problems during component deletion

    In addition, a bug causing scatter plot to crash the program on Ubuntu 16.04 and 18.04 is now magically gone, without any work being put into resolving it... Fun :D

  • 8. Dec: Release 0.4

    Vedran12/08/2020 at 17:25 0 comments

    It's been a while since the last release, but the program is slowly getting where I'd like it to be for my needs, so there's not much more to add. One last big change will come in the coming months: plot from network port. But I'll probably start working on it when I start needing it.

    For now, there's new version with the following changes:

    New features:

    • Existing line plot channels are now preserved when adding new channel to the plot
    • Tool-tips have been added to almost all UI elements, explaining UI functionality. When in doubt, hove rover a control to find out what it does
    • Math channel components now resemble an equation, hopefully making it easier to understand
    • Data-accumulation mode in line plot (data will be logged for as long as there's memory available - use with caution, can crash the program if there's no more memory available)

    Bug fixes:

    • Line plot was inserting data from the wrong side, causing the graph to move unnaturally
    • Multiplication math operation was using in fact multiply by ABS() value, which is no more the case
    • Hide unused UI elements (elements in the development)

  • 20. Nov: ​Release v0.3

    Vedran11/20/2020 at 18:54 0 comments

    A few more features have been added:

    • Math functions now include ABS and multiplication
    • Scatter plot shows channel names instead of generic 'Channel X'
    • Few stability fixes

  • 15. Nov

    Vedran11/15/2020 at 18:25 0 comments

    Internal logging is now fully functional, producing a log file every time the app is run and saving important events. By default, last 3 run logs are saved on the disk and rotated on every app startup. Should help with future debugging.

    CI pipeline for ubuntu release was not include a libpng12 dependency, failing to run precompiled ubuntu package on anything apart from Ubuntu 16.04. Also fixed

  • 14. Nov

    Vedran11/14/2020 at 22:18 0 comments

    Expanded pipeline to offer ubuntu-compatible version. Tests show that the same precompiled binary crashes on Ubuntu 16.04 and 18.04 when launching scatter plot, but not on Ubuntu 20.04. Very interesting...

  • 12. Nov

    Vedran11/12/2020 at 21:55 0 comments

    CI pipeline has been implemented, offers windows release (linux coming when I figure out how to deal with dependencies. Funny enough, it's seem to be easier to cross-compile from linux to windows, than from linux to linux :D)

View all 6 project logs

Enjoy this project?

Share

Discussions

Does this project spark your interest?

Become a member to follow this project and never miss any updates