 Sylwester
In a few steps we show a complete workflow on how to create graphs and feed data to AdafruitIO via HTTP (Webhook) from the sensor device. Then we configure IOT Cricket to send data directly to that webhook to plot a graph on our dashboard.
![]()
Prerequisites
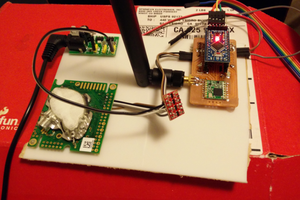
- IOT Cricket WiFi module
- 2xAAA battery holder
- 2xAAA batteries
- [optional] 6-Way Terminal Block
What is Webhook?
As we feed data to AdafruitIO via webhook, we first need to explain what it is. Webhook is a HTTP API on a server-side. Any function on a server can be triggered by sending a HTTP request to a given URL address. Usually the HTTP address is a link composed with a unique private token string and only clients who have this address can send a request. There are different methods of requests and for this project we use the POST method.
POST is one of the most common methods used to send data to a server. The data is stored in the body of the HTTP request and usually it is coded in JSON format. For example, to send a value equals 20 to our Adafruit webhook (https://io.adafruit.com/api/v2/webhooks/feed/YOUR_TOKEN) we can use command line tool curl as shown below:
curl -X POST -d '{"value":"20"}' -H 'Content-Type: application/json' https://io.adafruit.com/api/v2/webhooks/feed/YOUR_TOKEN


 HYuiii
 Splendide_Mendax
 Marcus Berg