i started off with looking at temp variation, and moved on to voltage and then to laser power.
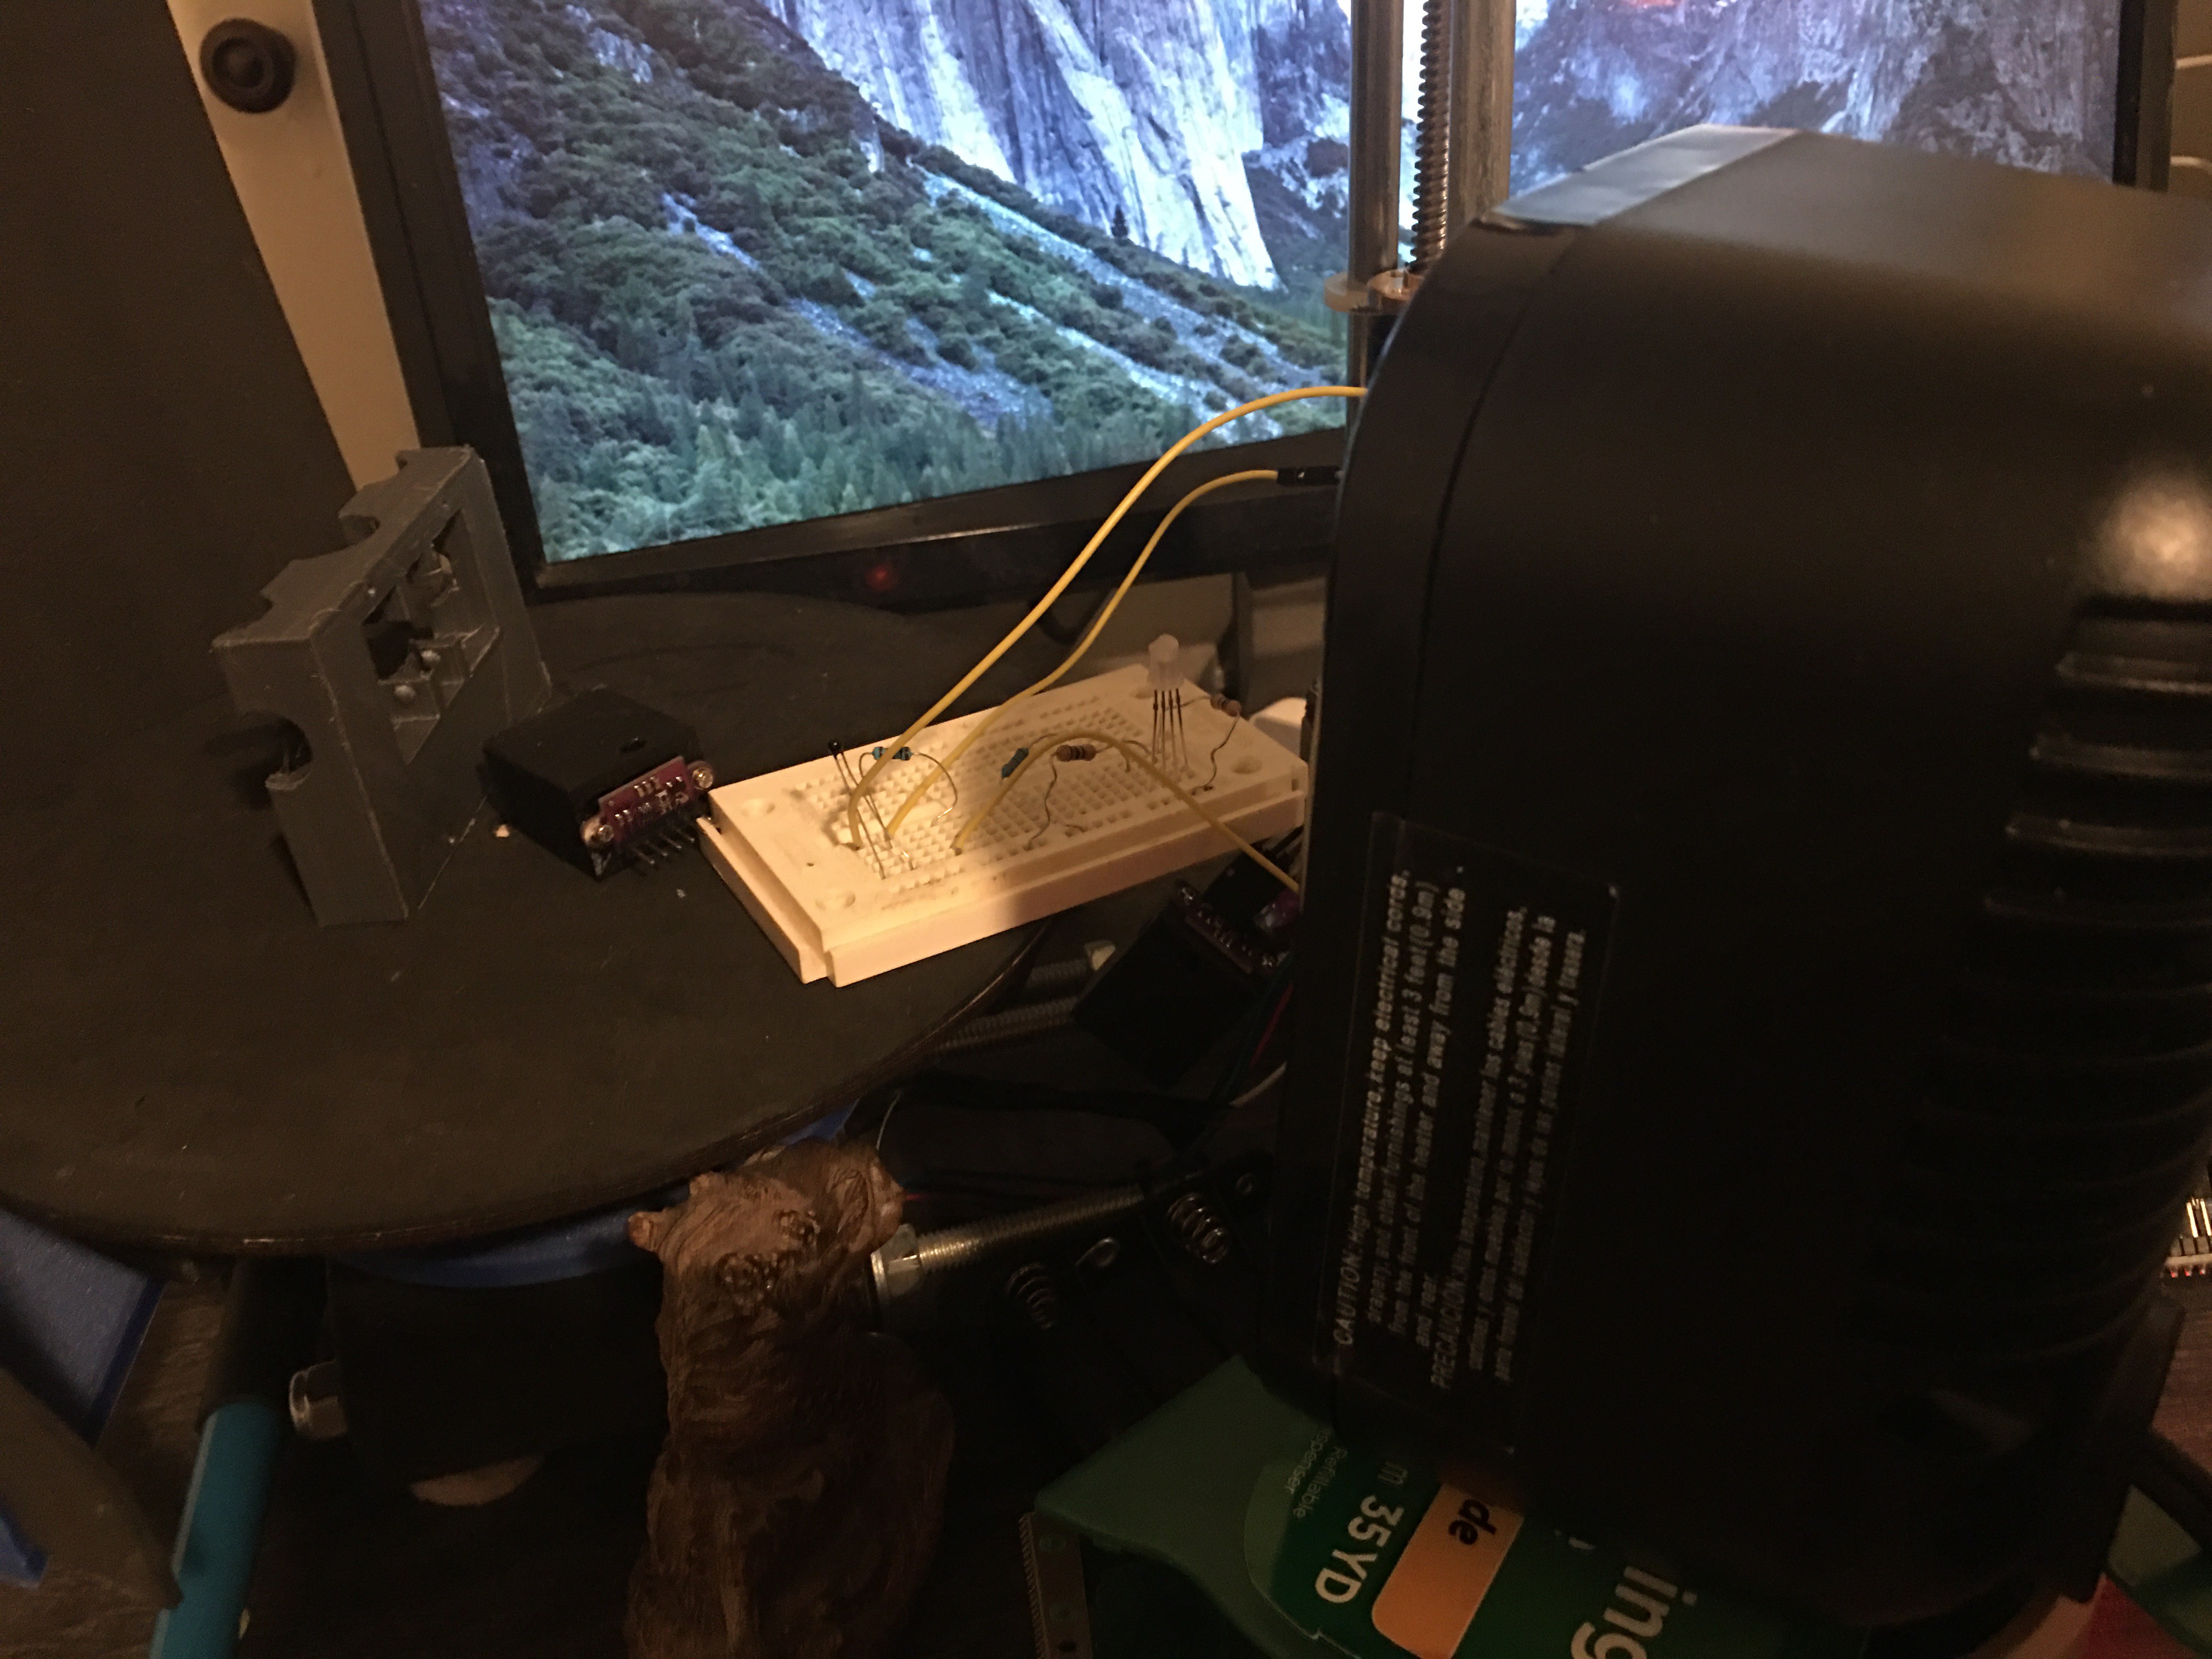
here is what is used, a ntc temp sensor (not sure of brand or type, it was in arduino parts kit) and a sensor that has been placed inside of a case that limits its field of view of sent out laser
there is a lot of noise in raw data. to summarize, you will want to monitor chip voltage. if it goes out of spec dont count the measurement of the range for that reading. variations in voltage, and in laser output power cause the noise in the distance range. but it is still within spec of +/-3% when voltage is above 2.6 (device in spec). the voltage and the laser power variations are still being looked into.
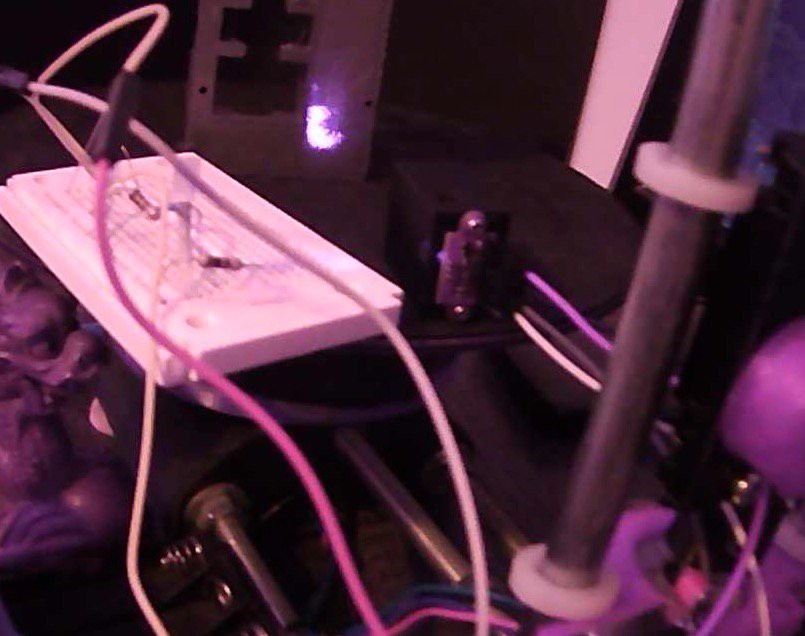
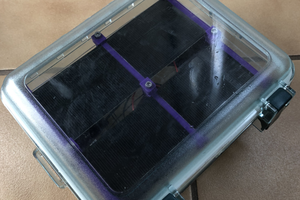
here is an image of what it looked like when sensor was measuring for about 8hrs thru a camera that had IR filter removed. the laser light is not visible.
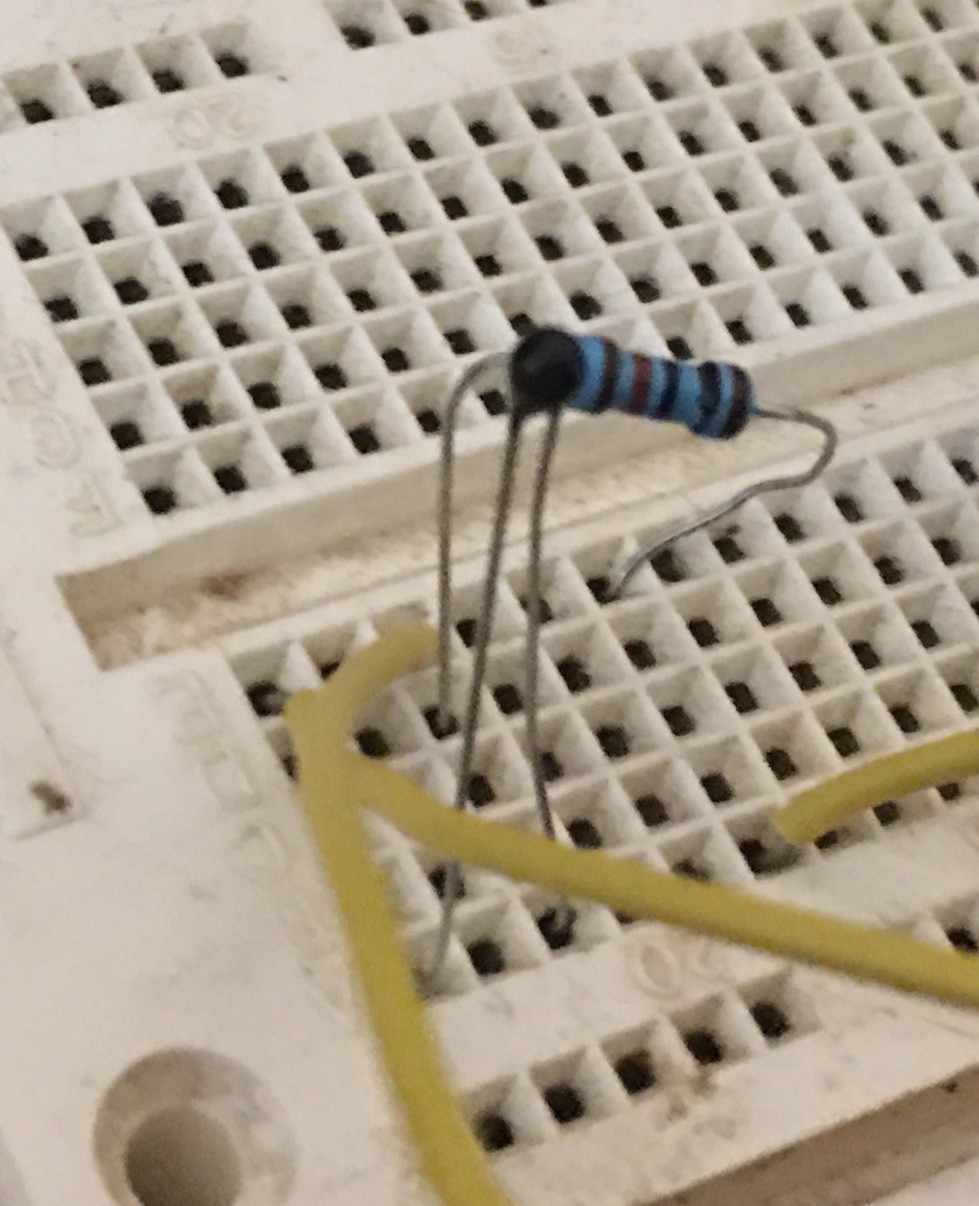
here is a close up of sensor, and 10k resistor.
here is up close of board for temp sensor. it is hooked up to output pin d12 set to output low, and to 5vcc pin of nano. vl53l0x is to vin on chip. nothing really special. it is about 6 inches away from VL53l0x lidar chip
after collecting 528 minute of data for temp and for sensor distance. i'm not convinced that temp causes measurement drift, at least off chip. here is a graph of temp from 16c to 12c, and the values are all over the place below. the noise is just to big, and the temp does not change that much over an hour time, but over 8hrs it drops from about 16c to 12c. the vl53L0x is stable for minutes at a time, but drifts up and down about +/-1.5MM in distance measurements over 8hrs time. fluctuation is not correlated to temp. i just dont see it. i suspect the same to be true for the vl6180 sensor that temp is not directly correlated to drift or noise.
data below is filtered to remove most noise.
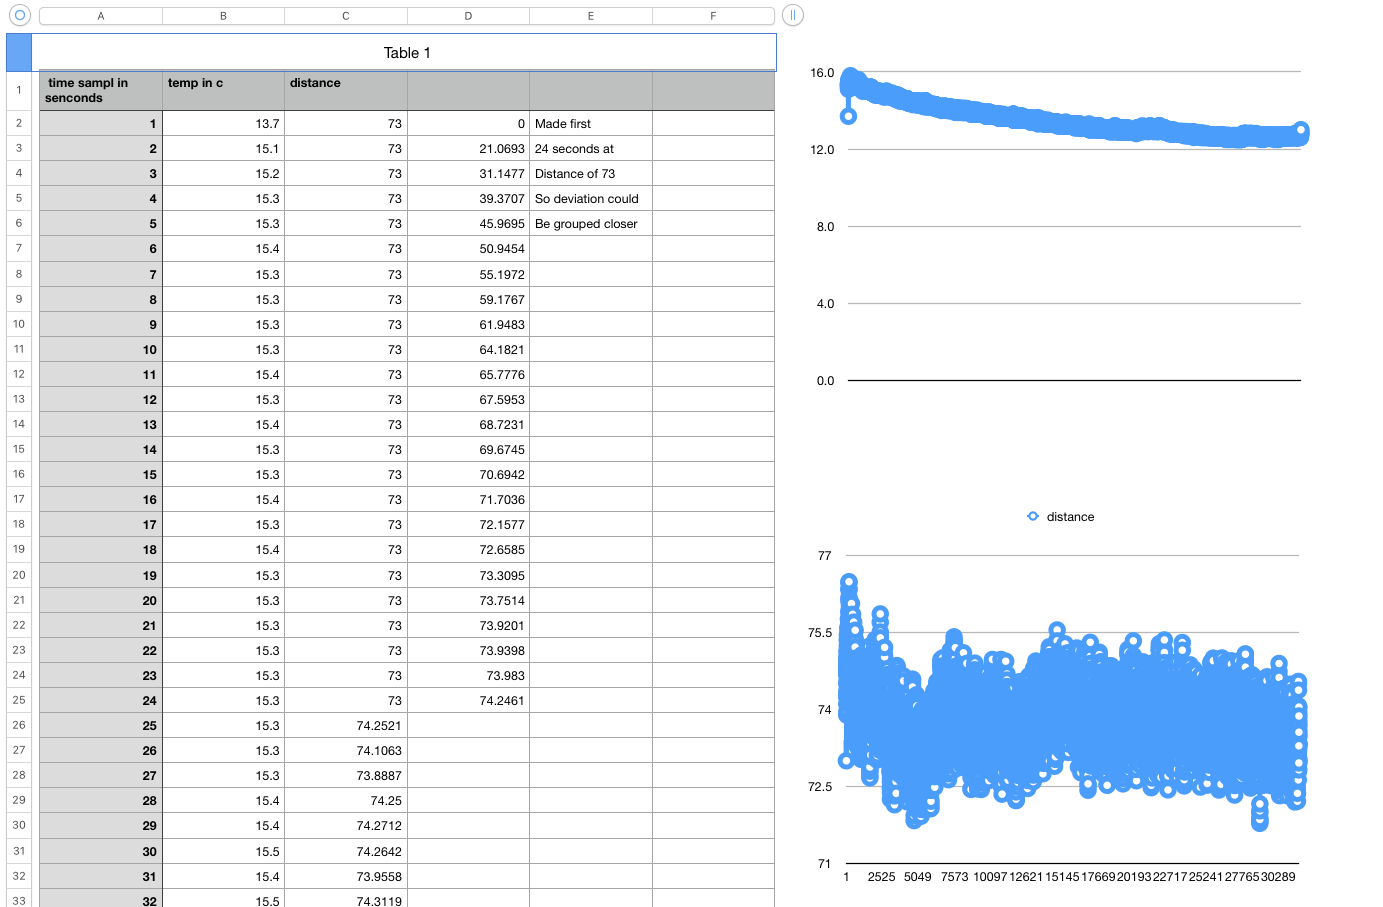
yes you might be able to make out a pattern but it is not consistent and the data is +/-1.5mm to 2mm all the time. for minutes at a time it remains stable but it does drift. temp is constantly going down from about 16C to 12c over night in a room with no heat on. temp is not the main culprit of shift.
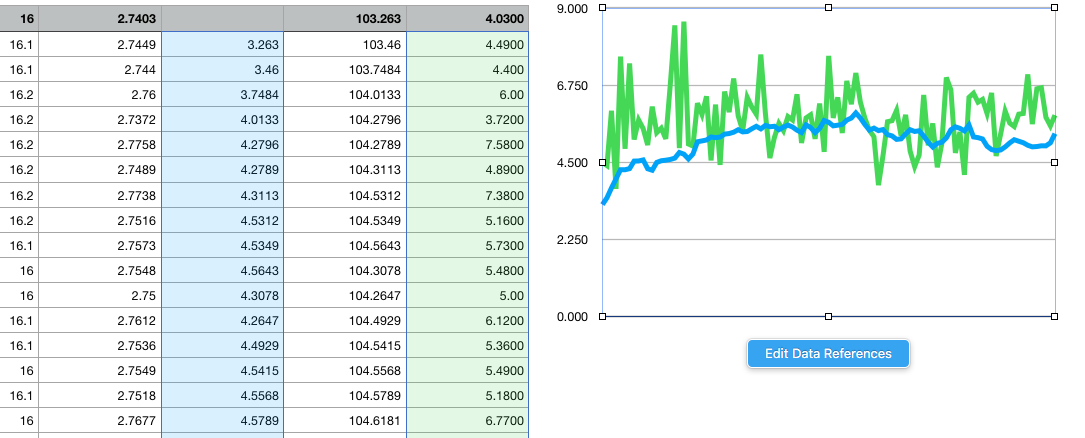
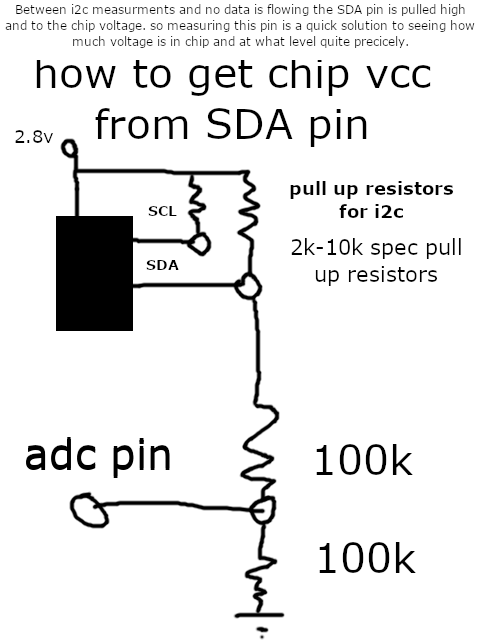
on a hunch, from working with thermal sensors, i know that voltages can effect results. so i decided to modify code to also capture the voltage of the VL53L0x thru the SDA pin when the device was idle between measurements. this pin is connected to a pull up resistor that goes to chip vcc. when not in use this pin floats to vcc of chip at 2.8v
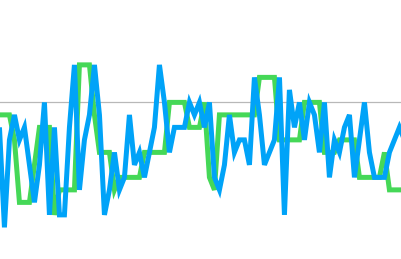
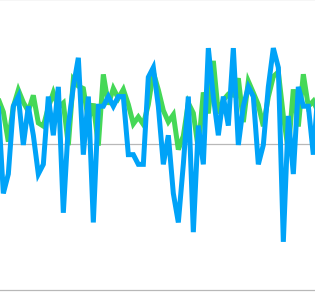
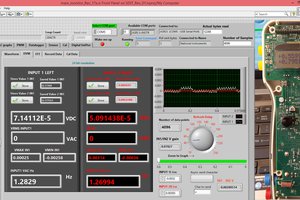
i have an hour of data included below, but here is a section of it. the green is the variation in voltage *100
the blue is the variation in distance. it can be generated with volt_and_temp_and_distance code included
this was with filtered data and a short range. when i tried adjusting for voltage noise, i got a lot of variation. so it seams that something is causing voltage spikes, and is somehow causing measurements to vary.
We only get measurements when SDA line is not in use, so it is not pulled low, it is floating to chip vcc

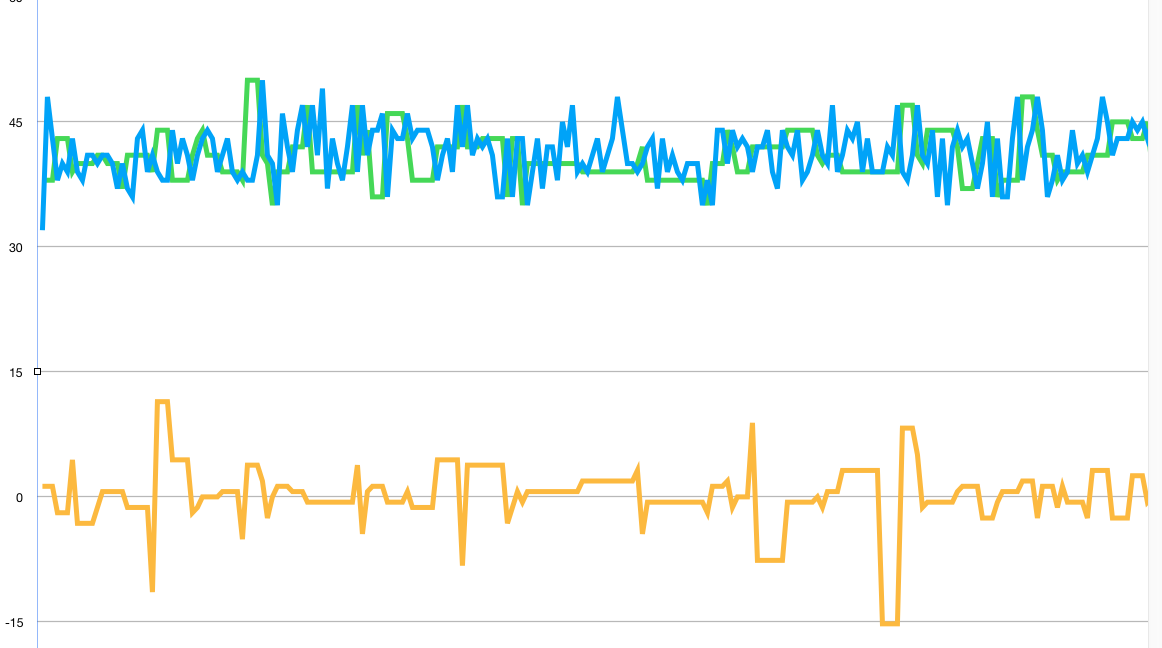
these are filtered results of temp variation and voltage variation. it seems to match but voltage noise is not the main cause of variation. it does cause change, but something else is causing more variation. something is changing. it is not temp, voltage is a cause and should be compensated for, but there is a bigger culprit.
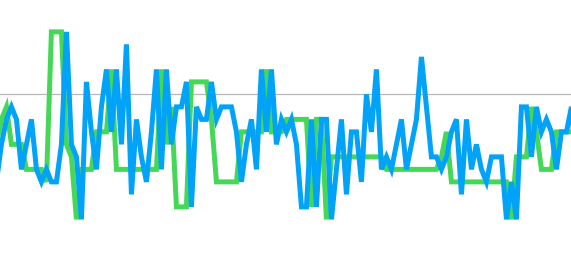
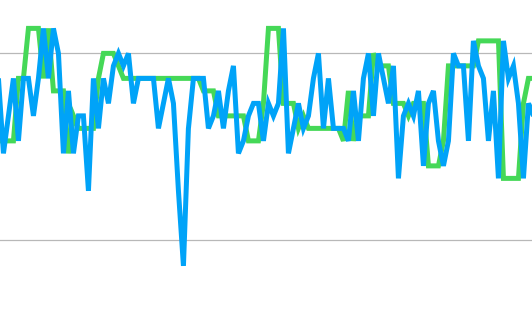
 i got a short segment that i though was promising, but after further looking at voltage, it varies up and down and sensor ranges +/- delta does not account for most of the noise.
but it you want a lot of raw data at 30-50 times a second with no filtering that shows temp, v of chip and distance look at the included file raw_measurment2_21_21.csv
i do see some correlation with voltage and noise, but there seems to be something bigger causing variation. i began to suspect laser output might be cause of variation, so i encased a cds cell inside of case device i...
Read more »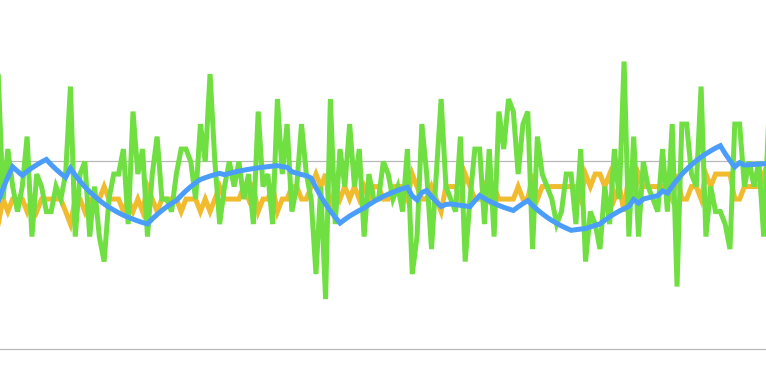

 Roman
Roman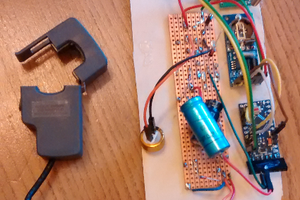
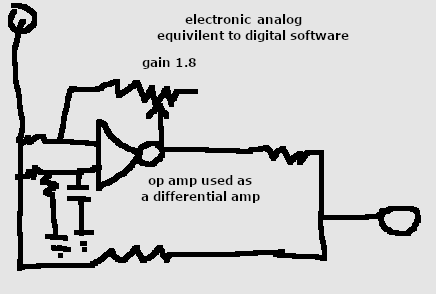
thanks for that. you might be right. I don't need to worry about timing much anymore directly. i have plenty of data that suggests that the noise is from the laser output average power variations and the voltage spikes. the issues with compensating it was the phase was not consistent. it matters less now as a high pass filter with inverted feedback is applied to raw output data. this reduces raw variation to about 13.8 (max-min), +/- ~7, from where it was of about 34 (max-min). i think this is the best i can get the raw variation as you stated the analog state of tech and the speed of digital detection on modern silicon for photon avalanche diodes. but over time the average should be more spot on because the range is more controlled. but this is just conjecture until there is proper data, and Arduino code that shows the results!