 Dominik Meffert
Here are some pictures of the 7-inch ESP32 powered control touchscreen and the latest changes to the prototype:
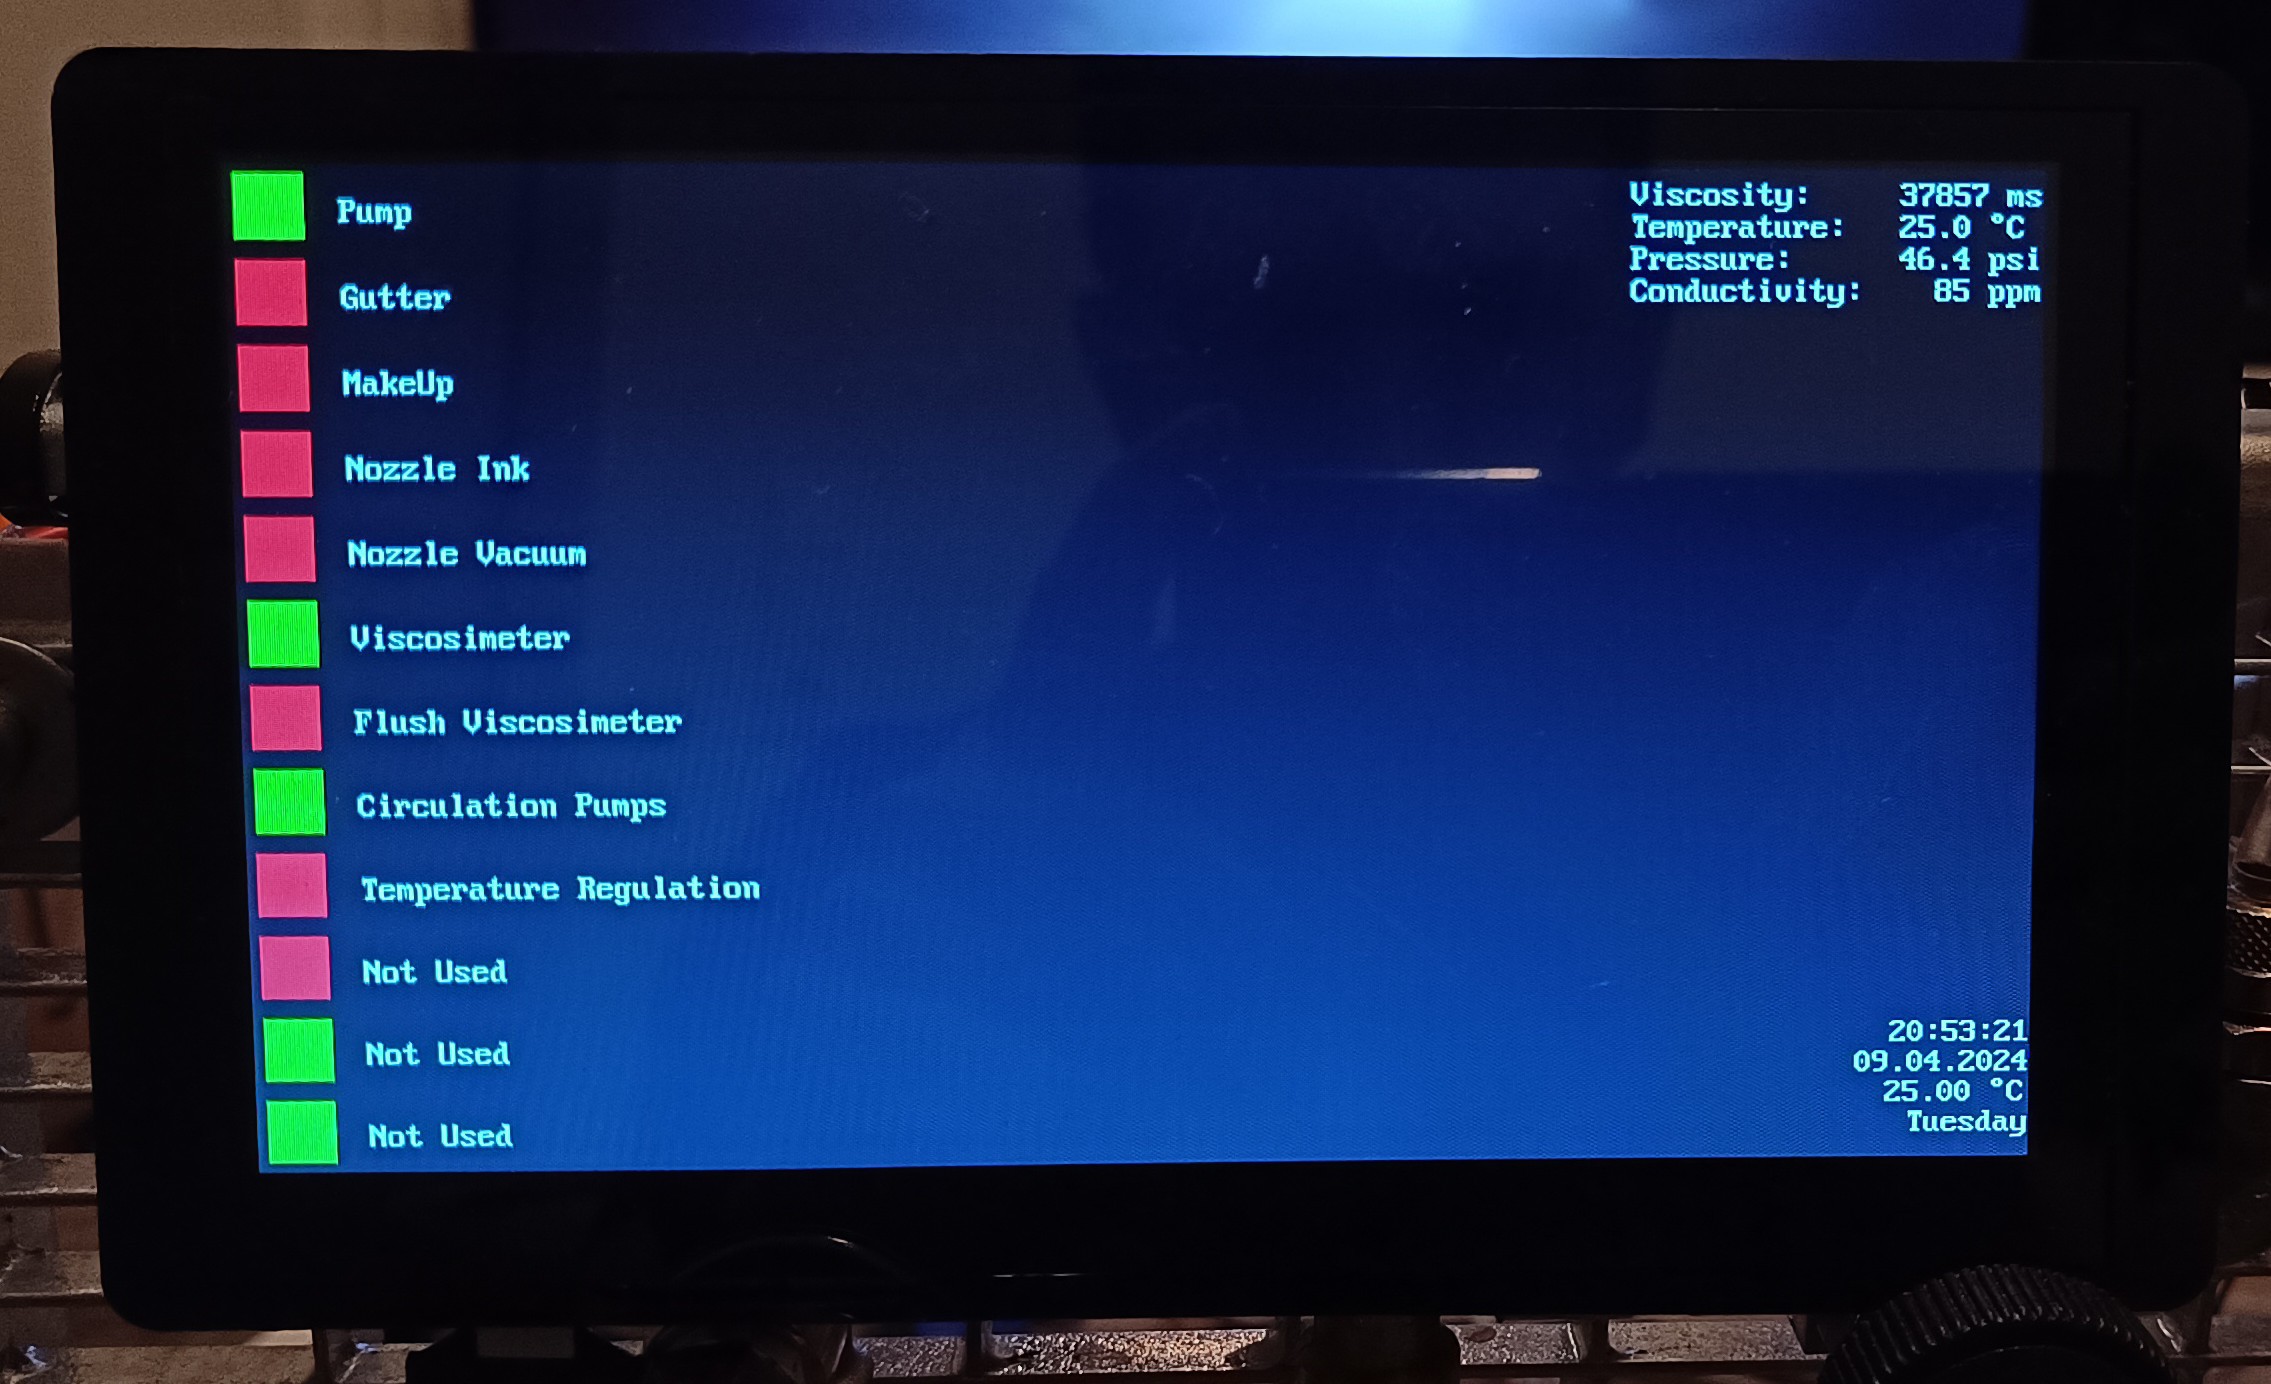
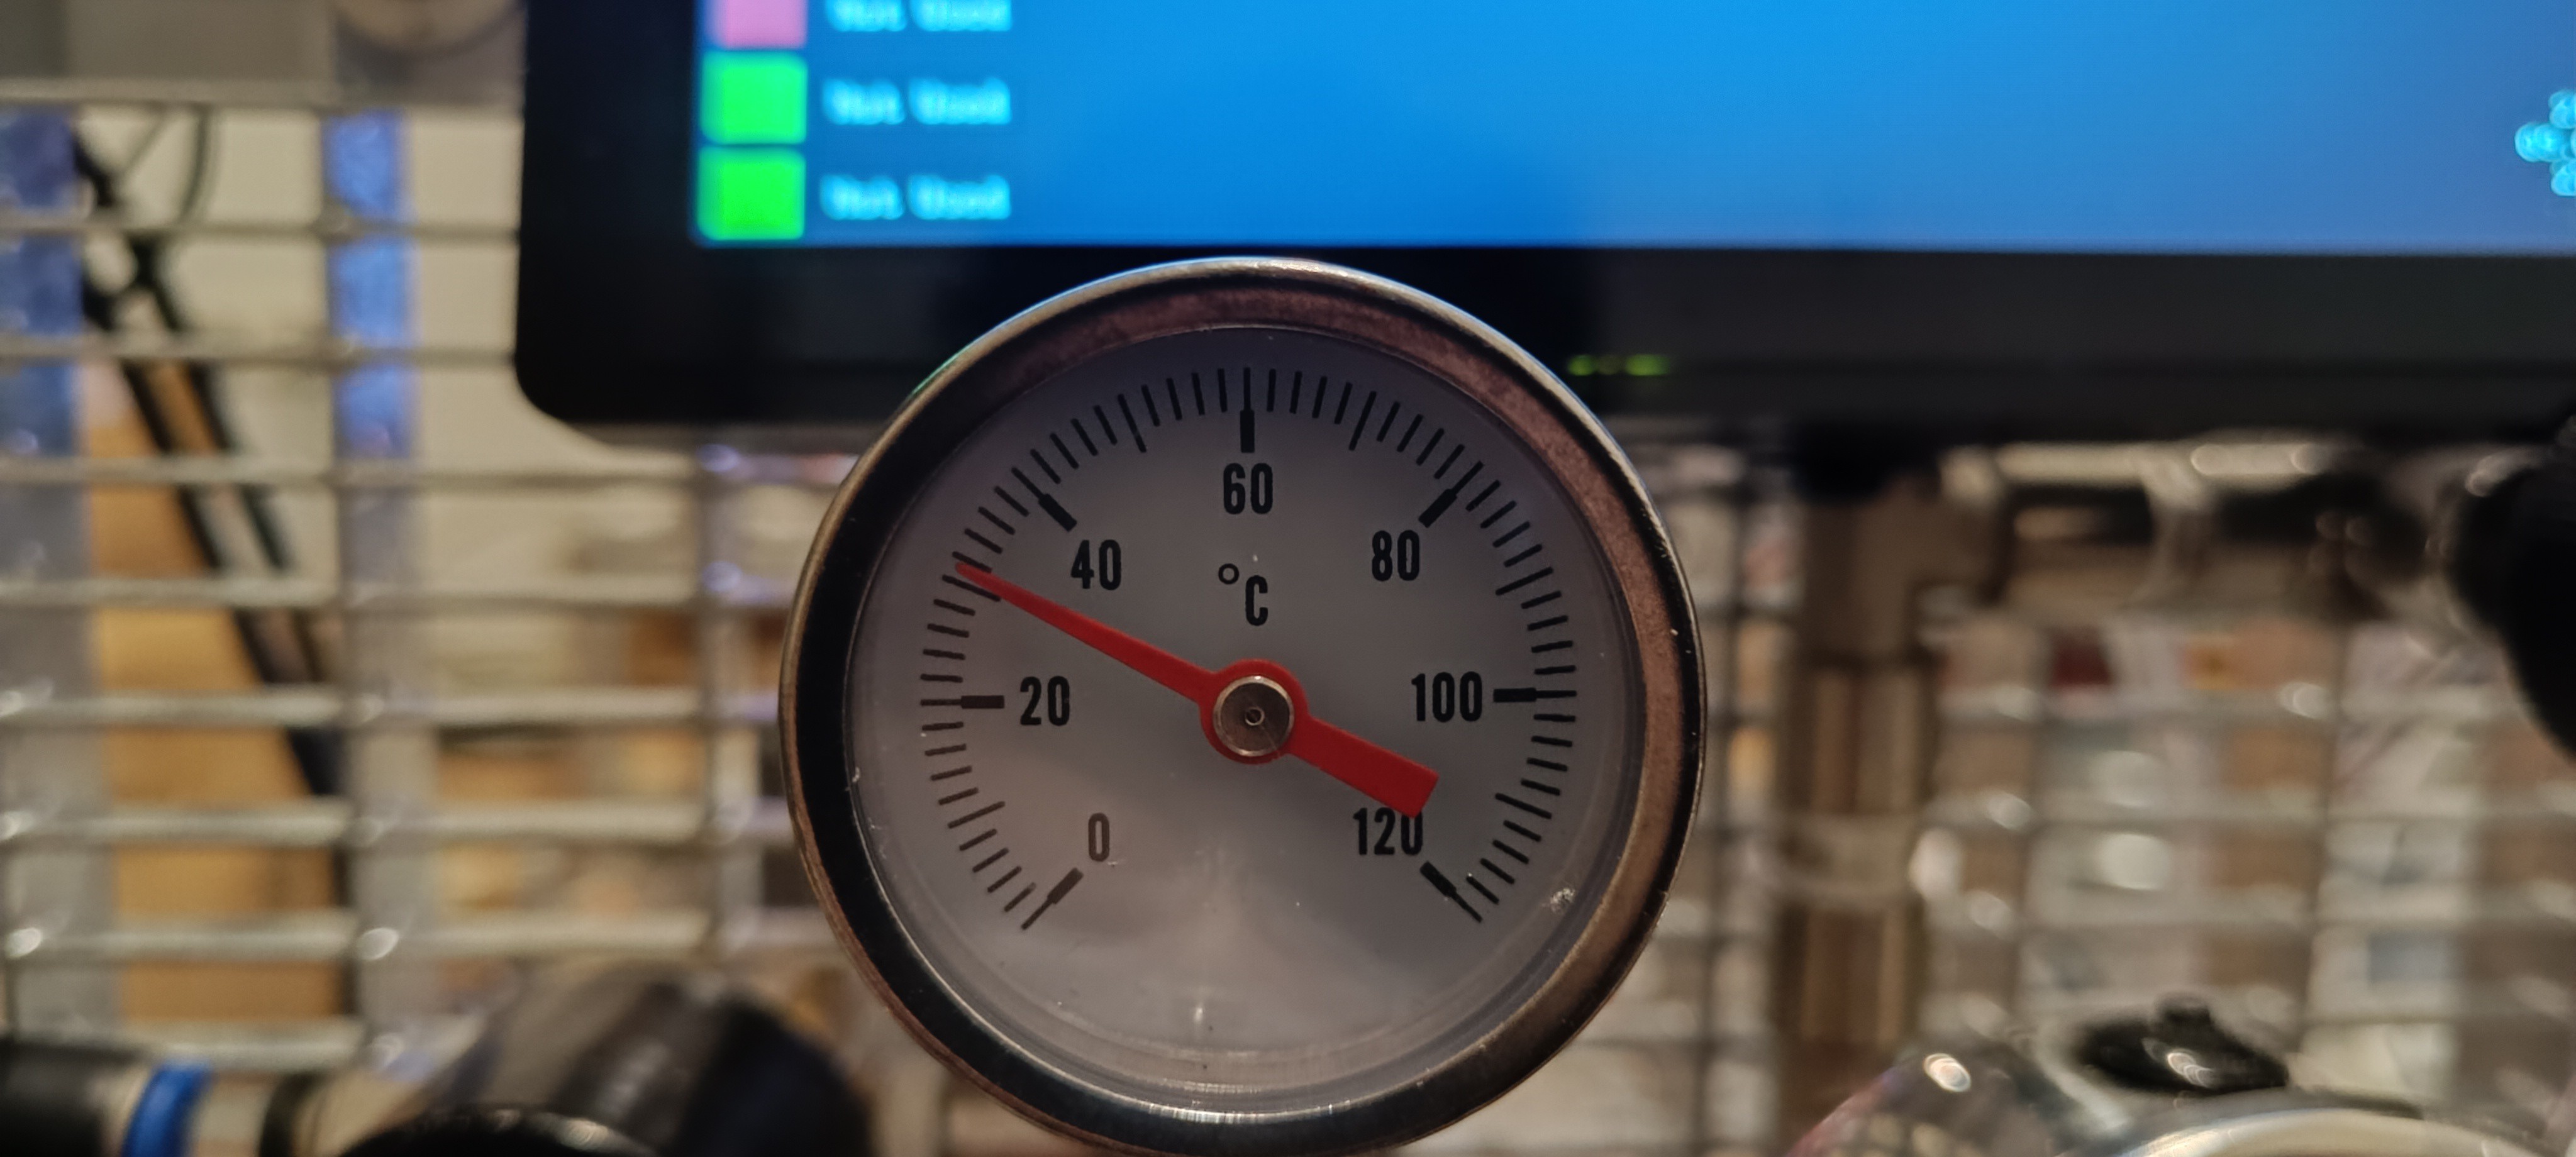
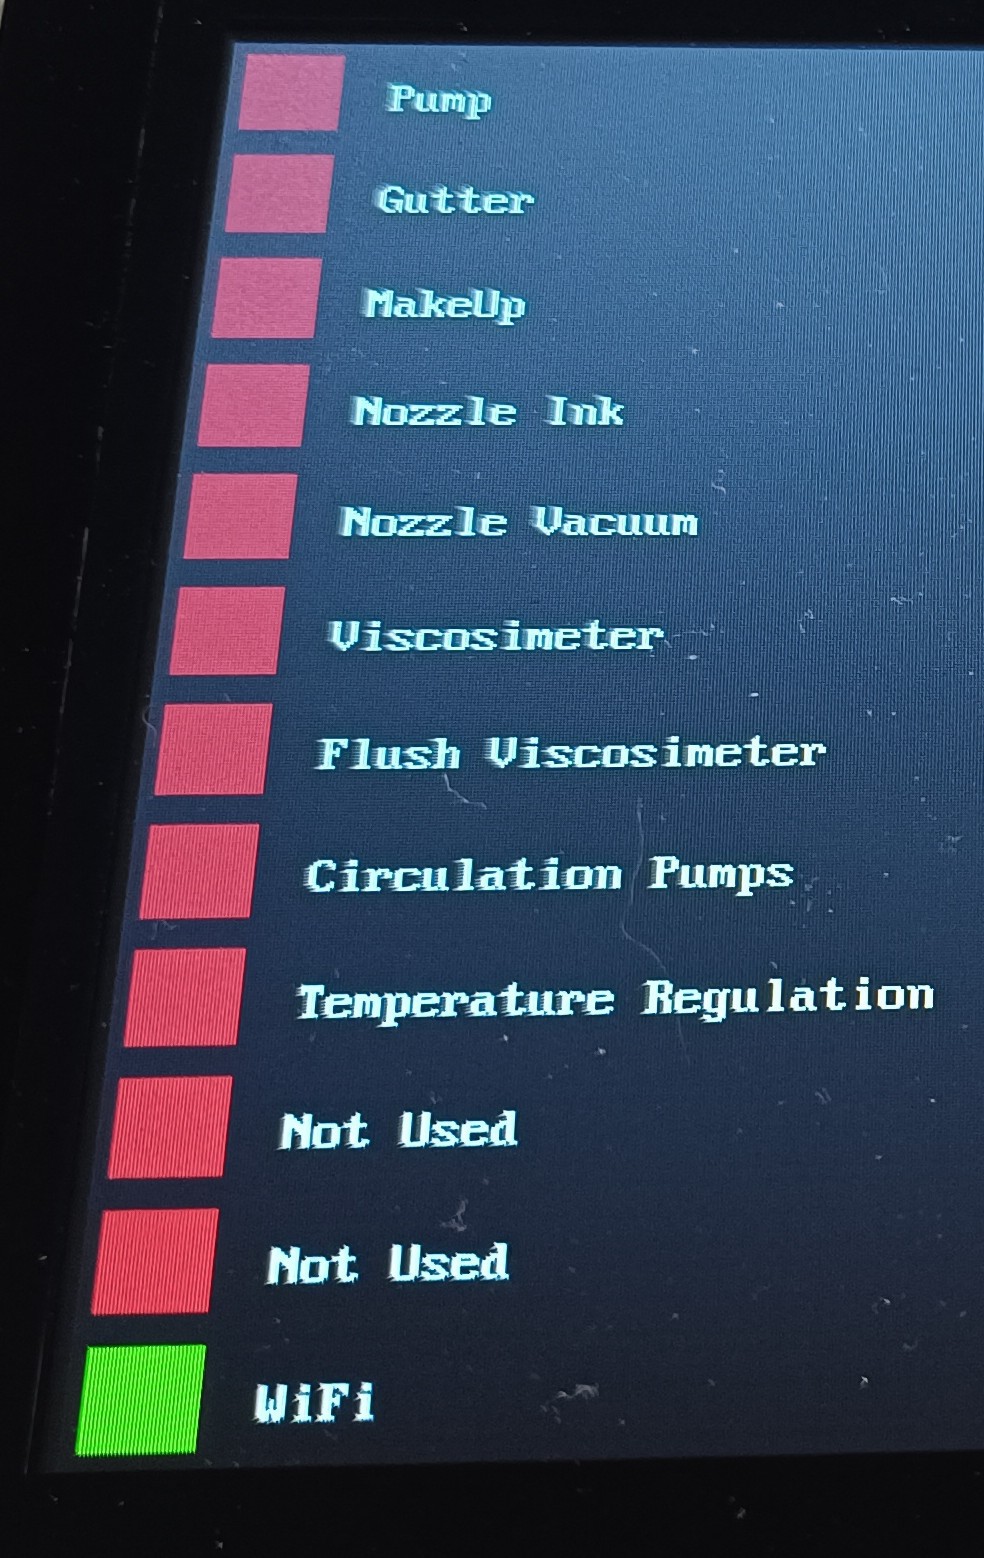
The squares on the left are touch buttons for the printer functions and on the right, you can see the sensor data on the top and the current time, date, day, and room temperature on the bottom.
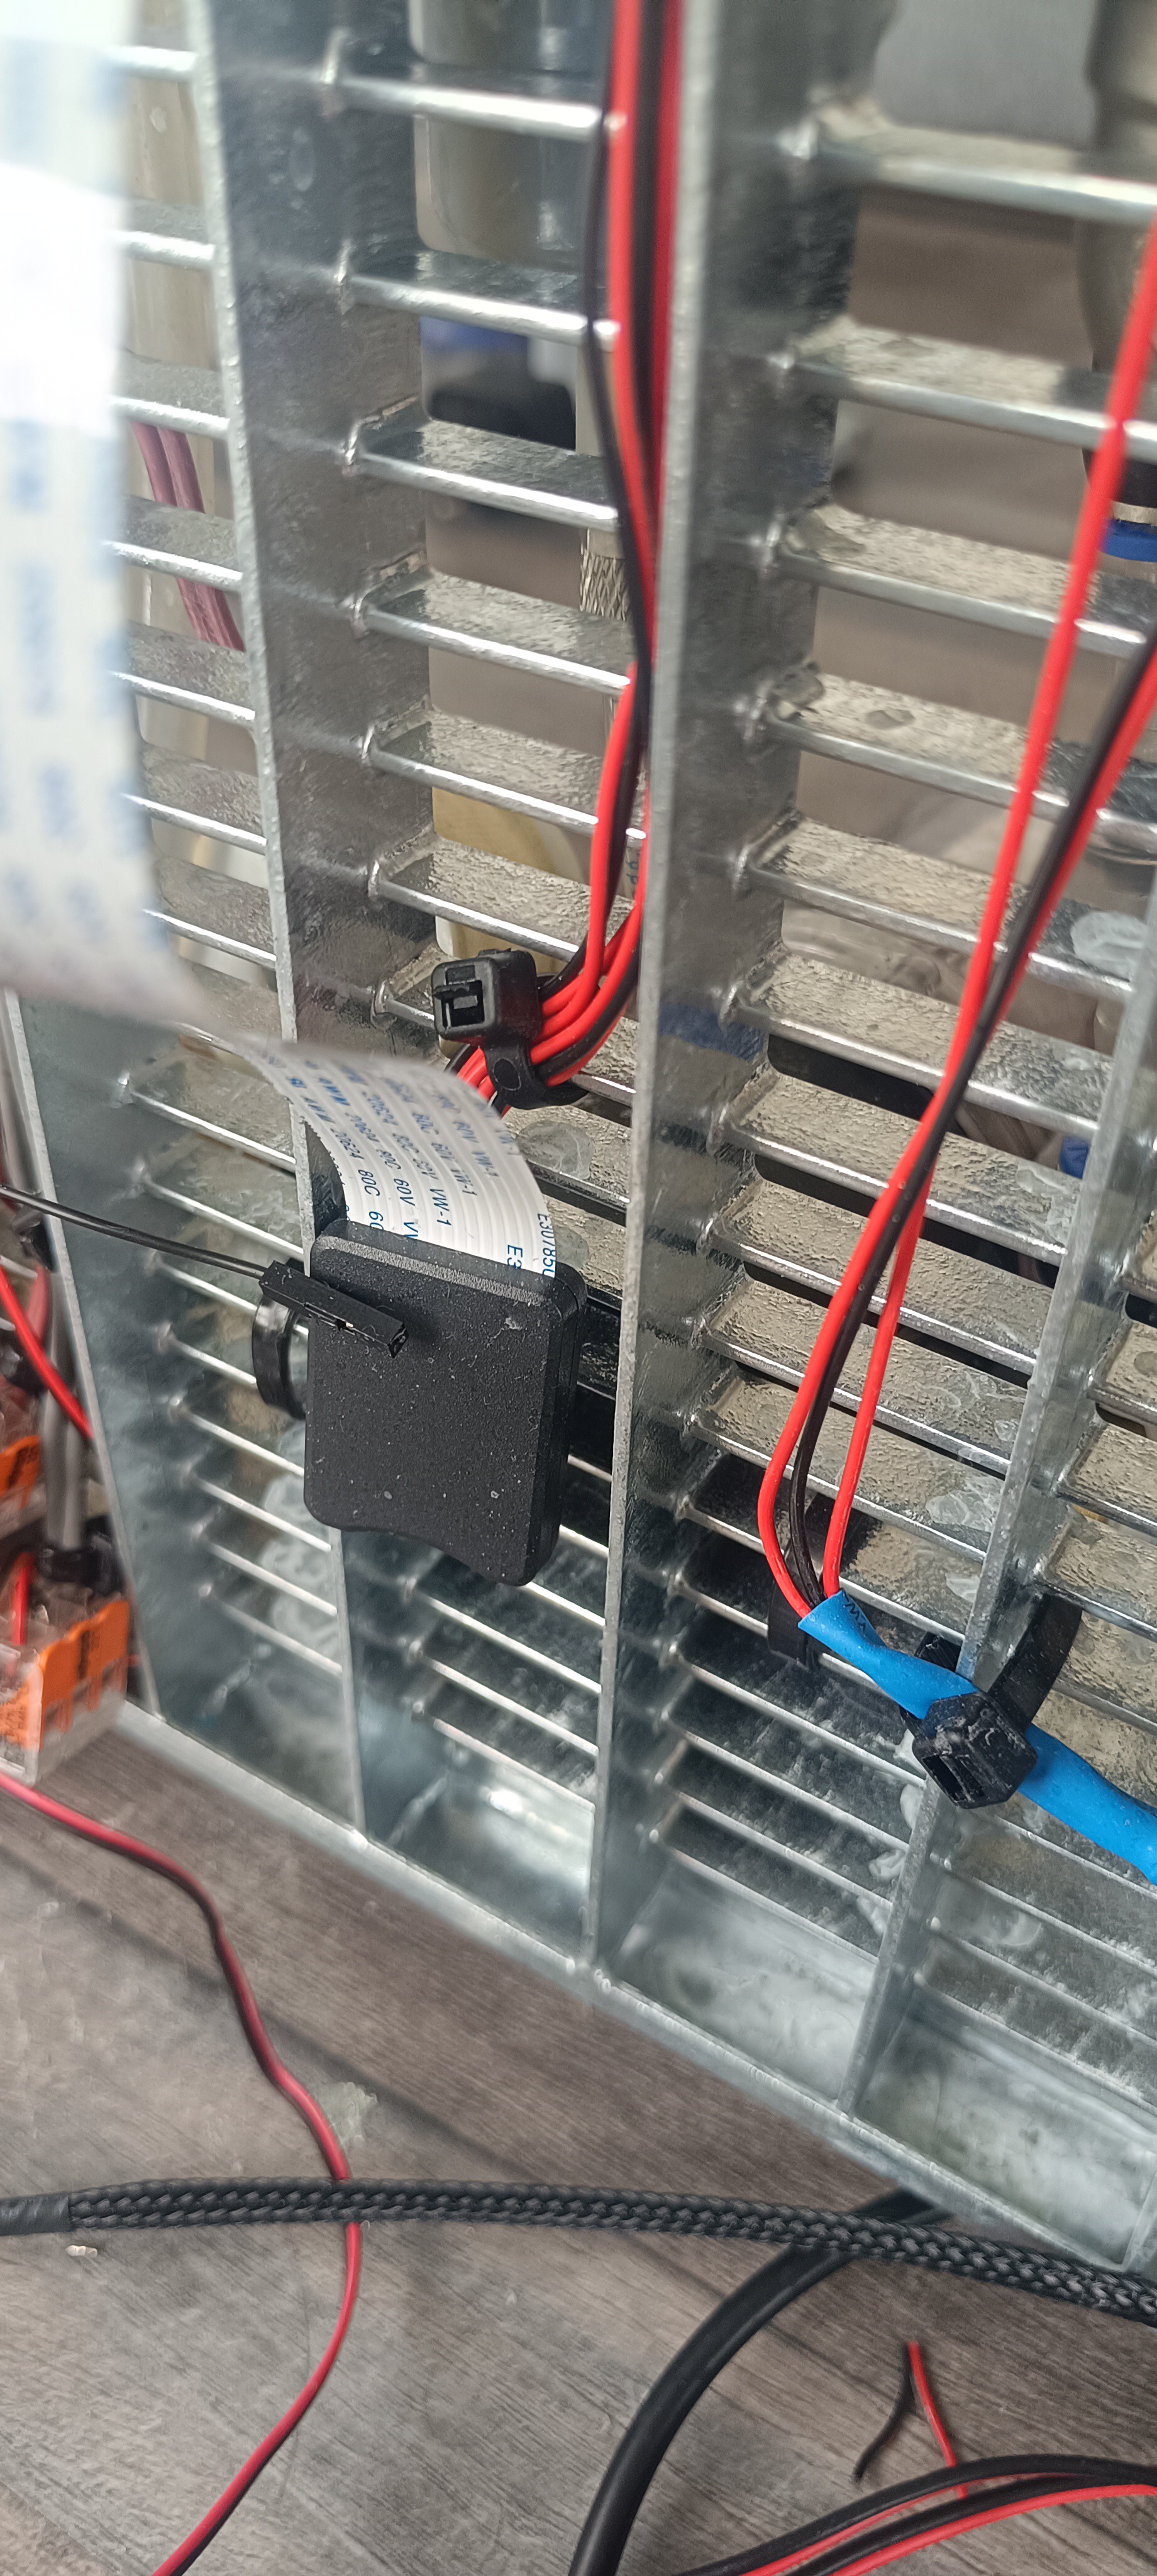
Since the display has no IO pins, I reassigned the 4 pins that were used for the micro SD card to use 2 of them for I2C (SCL and SDA) and the other two for PWM.
To access the pins I soldered wires to a micro SD extension flat-band cable.
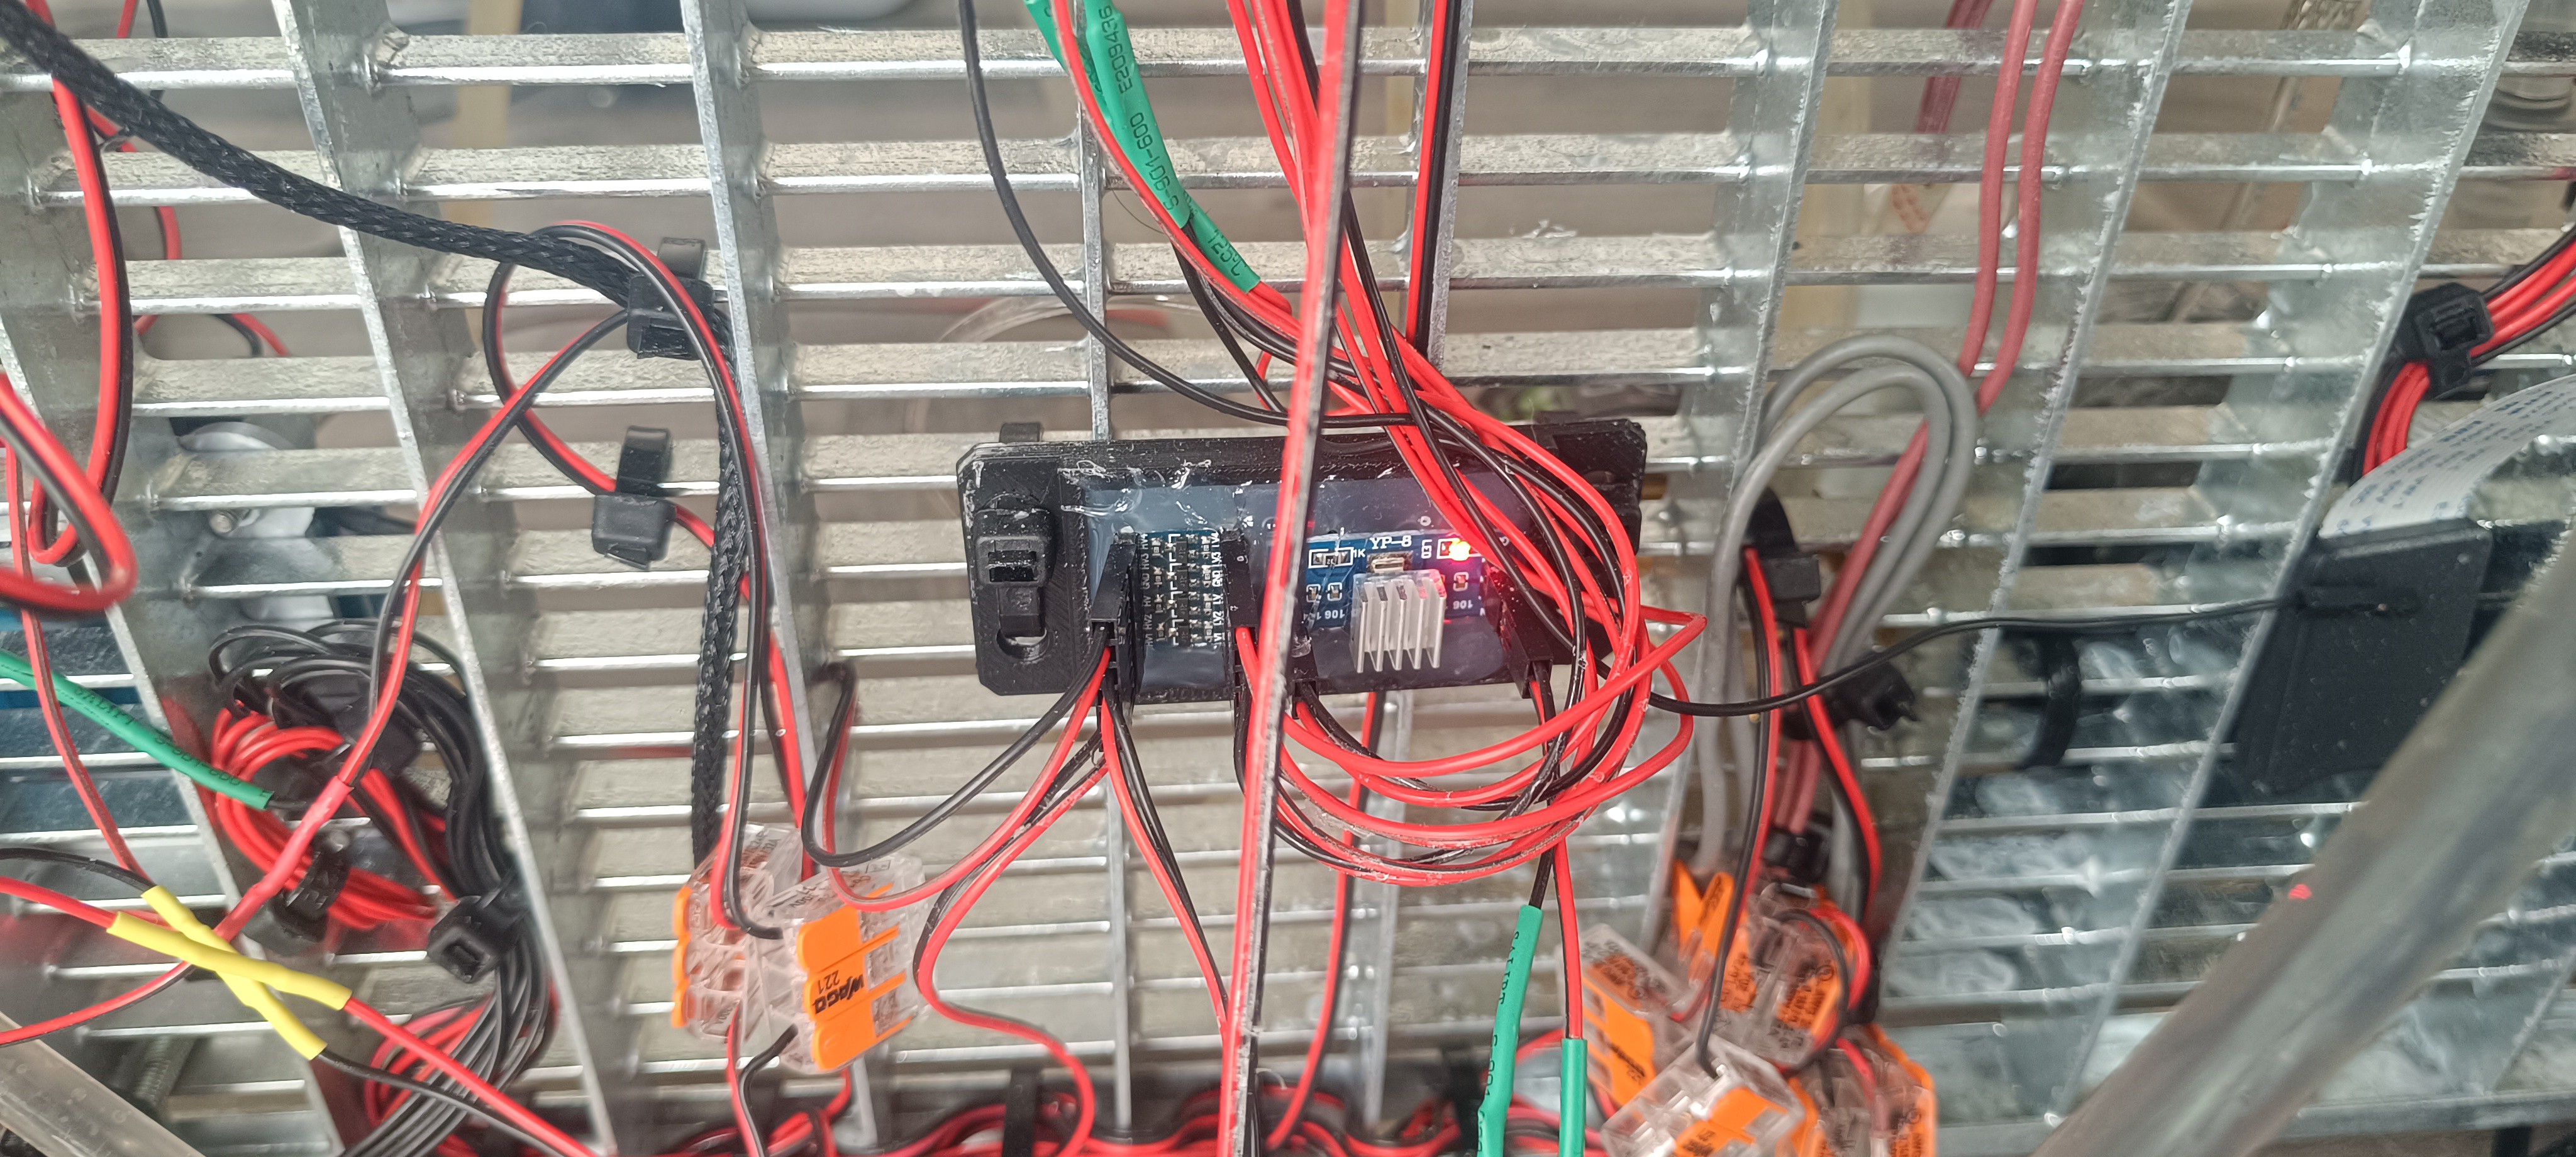
Connected via I2C are a DS3231 real-time clock, an ADS1115 ADC, and an MCP23017 IO extension.

- The MCP23017 is used for switching the relays and valves and reading the inductive sensors of the viscosimeter.
- The ADS1115 is used for reading the analog voltage of the pressure, conductivity, and temperature sensors.
- The DS3231 is used to keep track of the time and measure the room temperature.
The touchscreen is powered by an AMS1117 3.3V regulator.
While the ESP32 is running well on 3.3V the LCD seems to need a higher voltage since it's flickering a bit when powered by 3.3V which doesn't happen when powered by its USB-C connection.
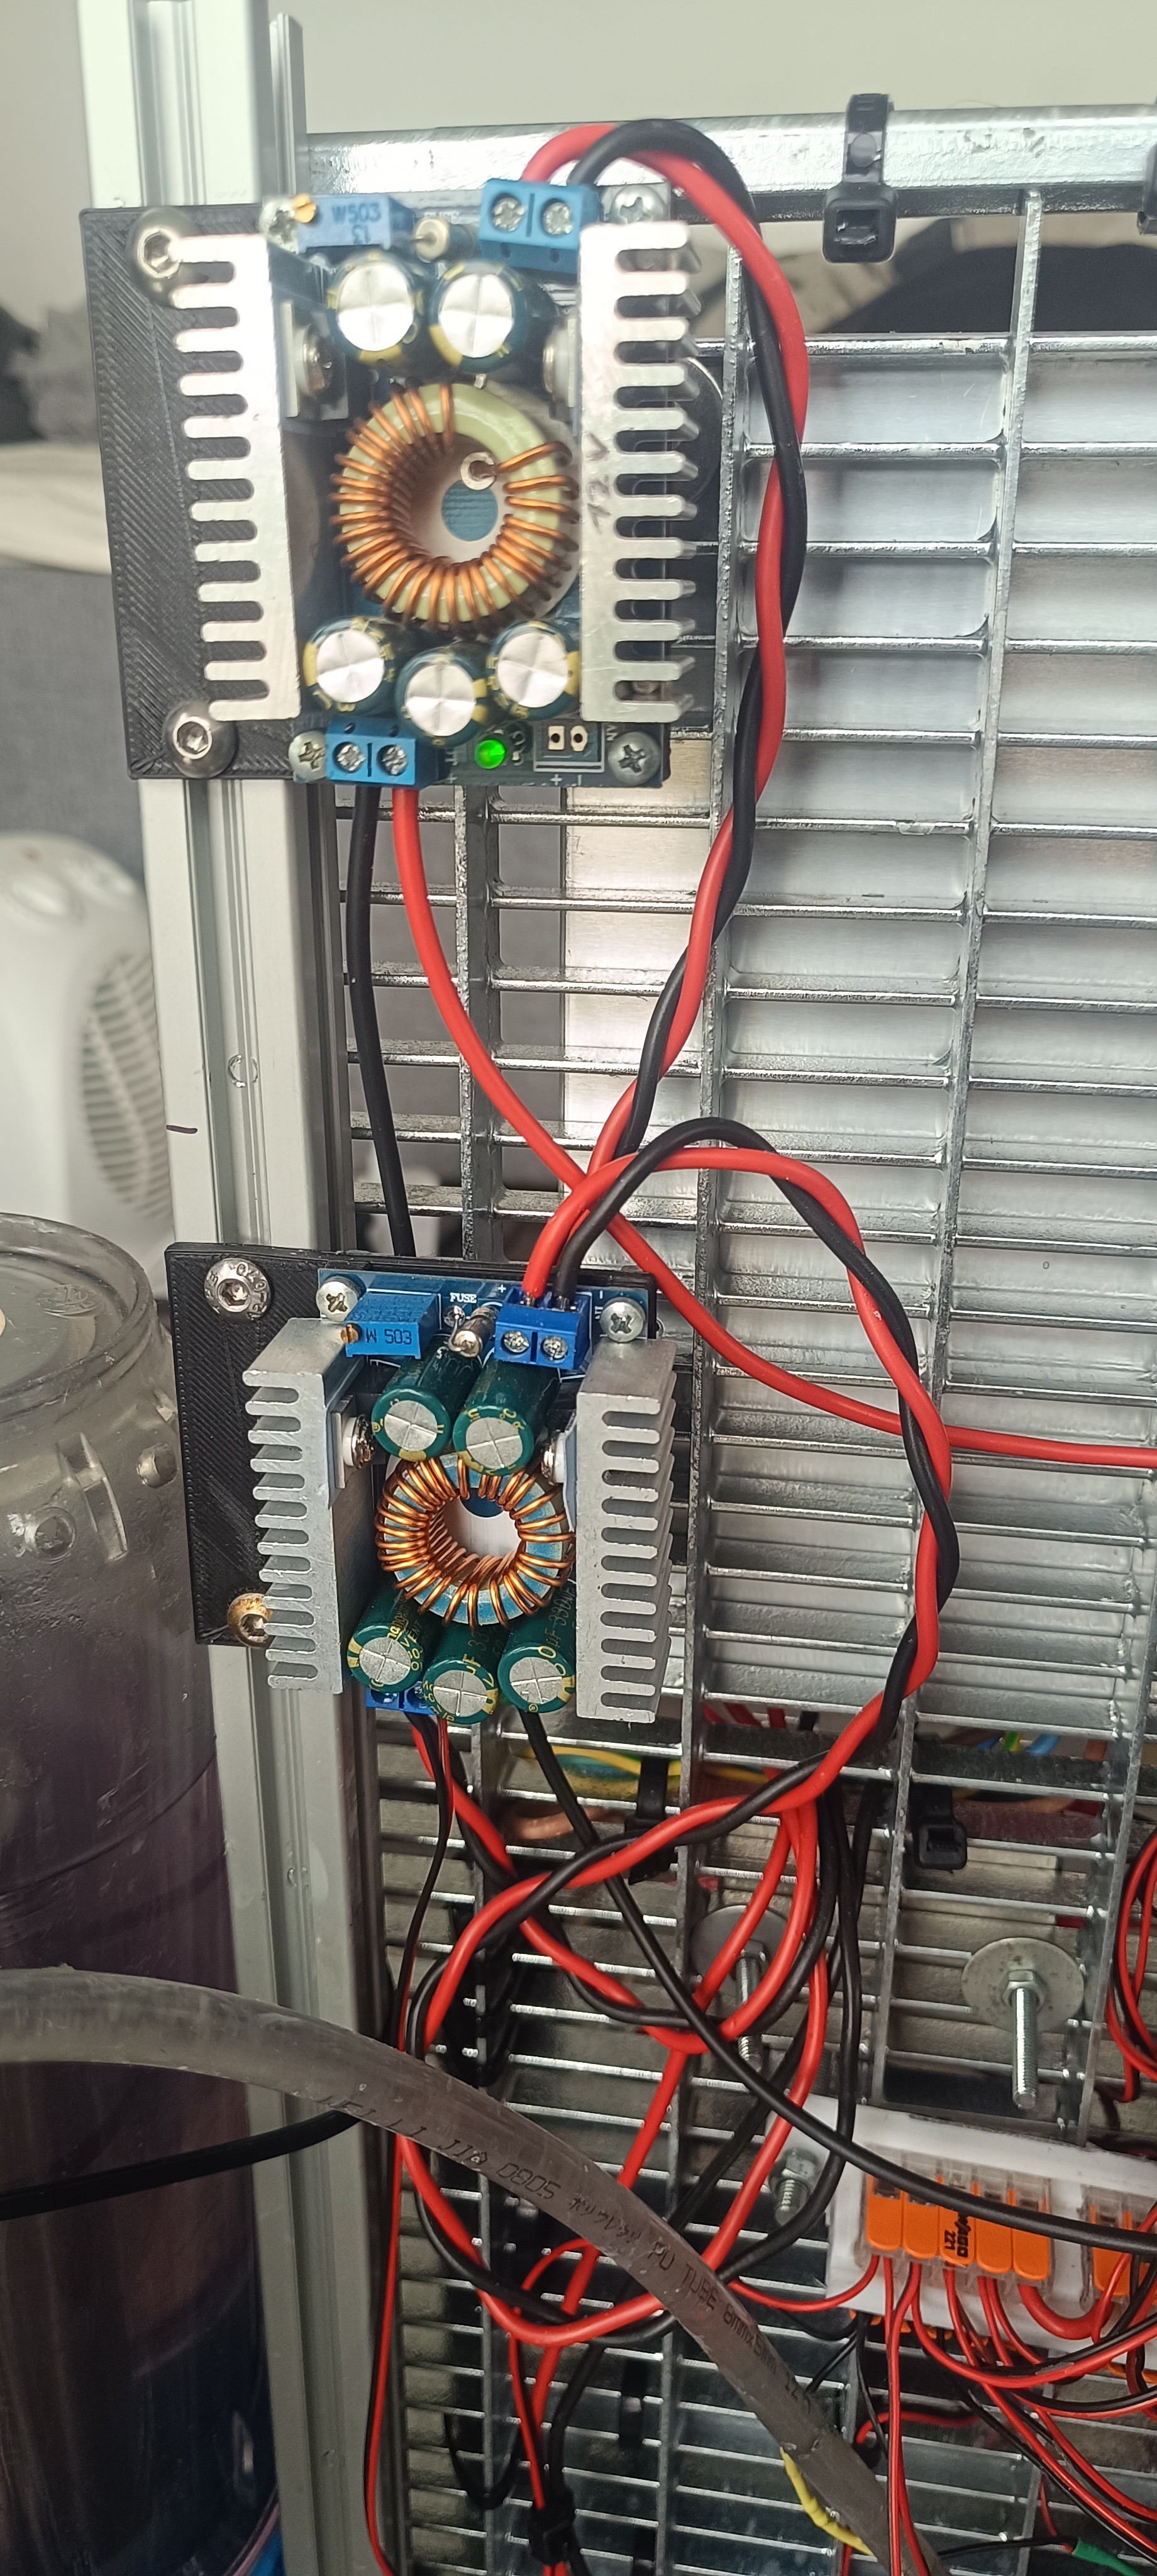
To get rid of the heat from the Peltier module I added a dual-fan radiator, with the fans pointing toward the grid frame of the machine.

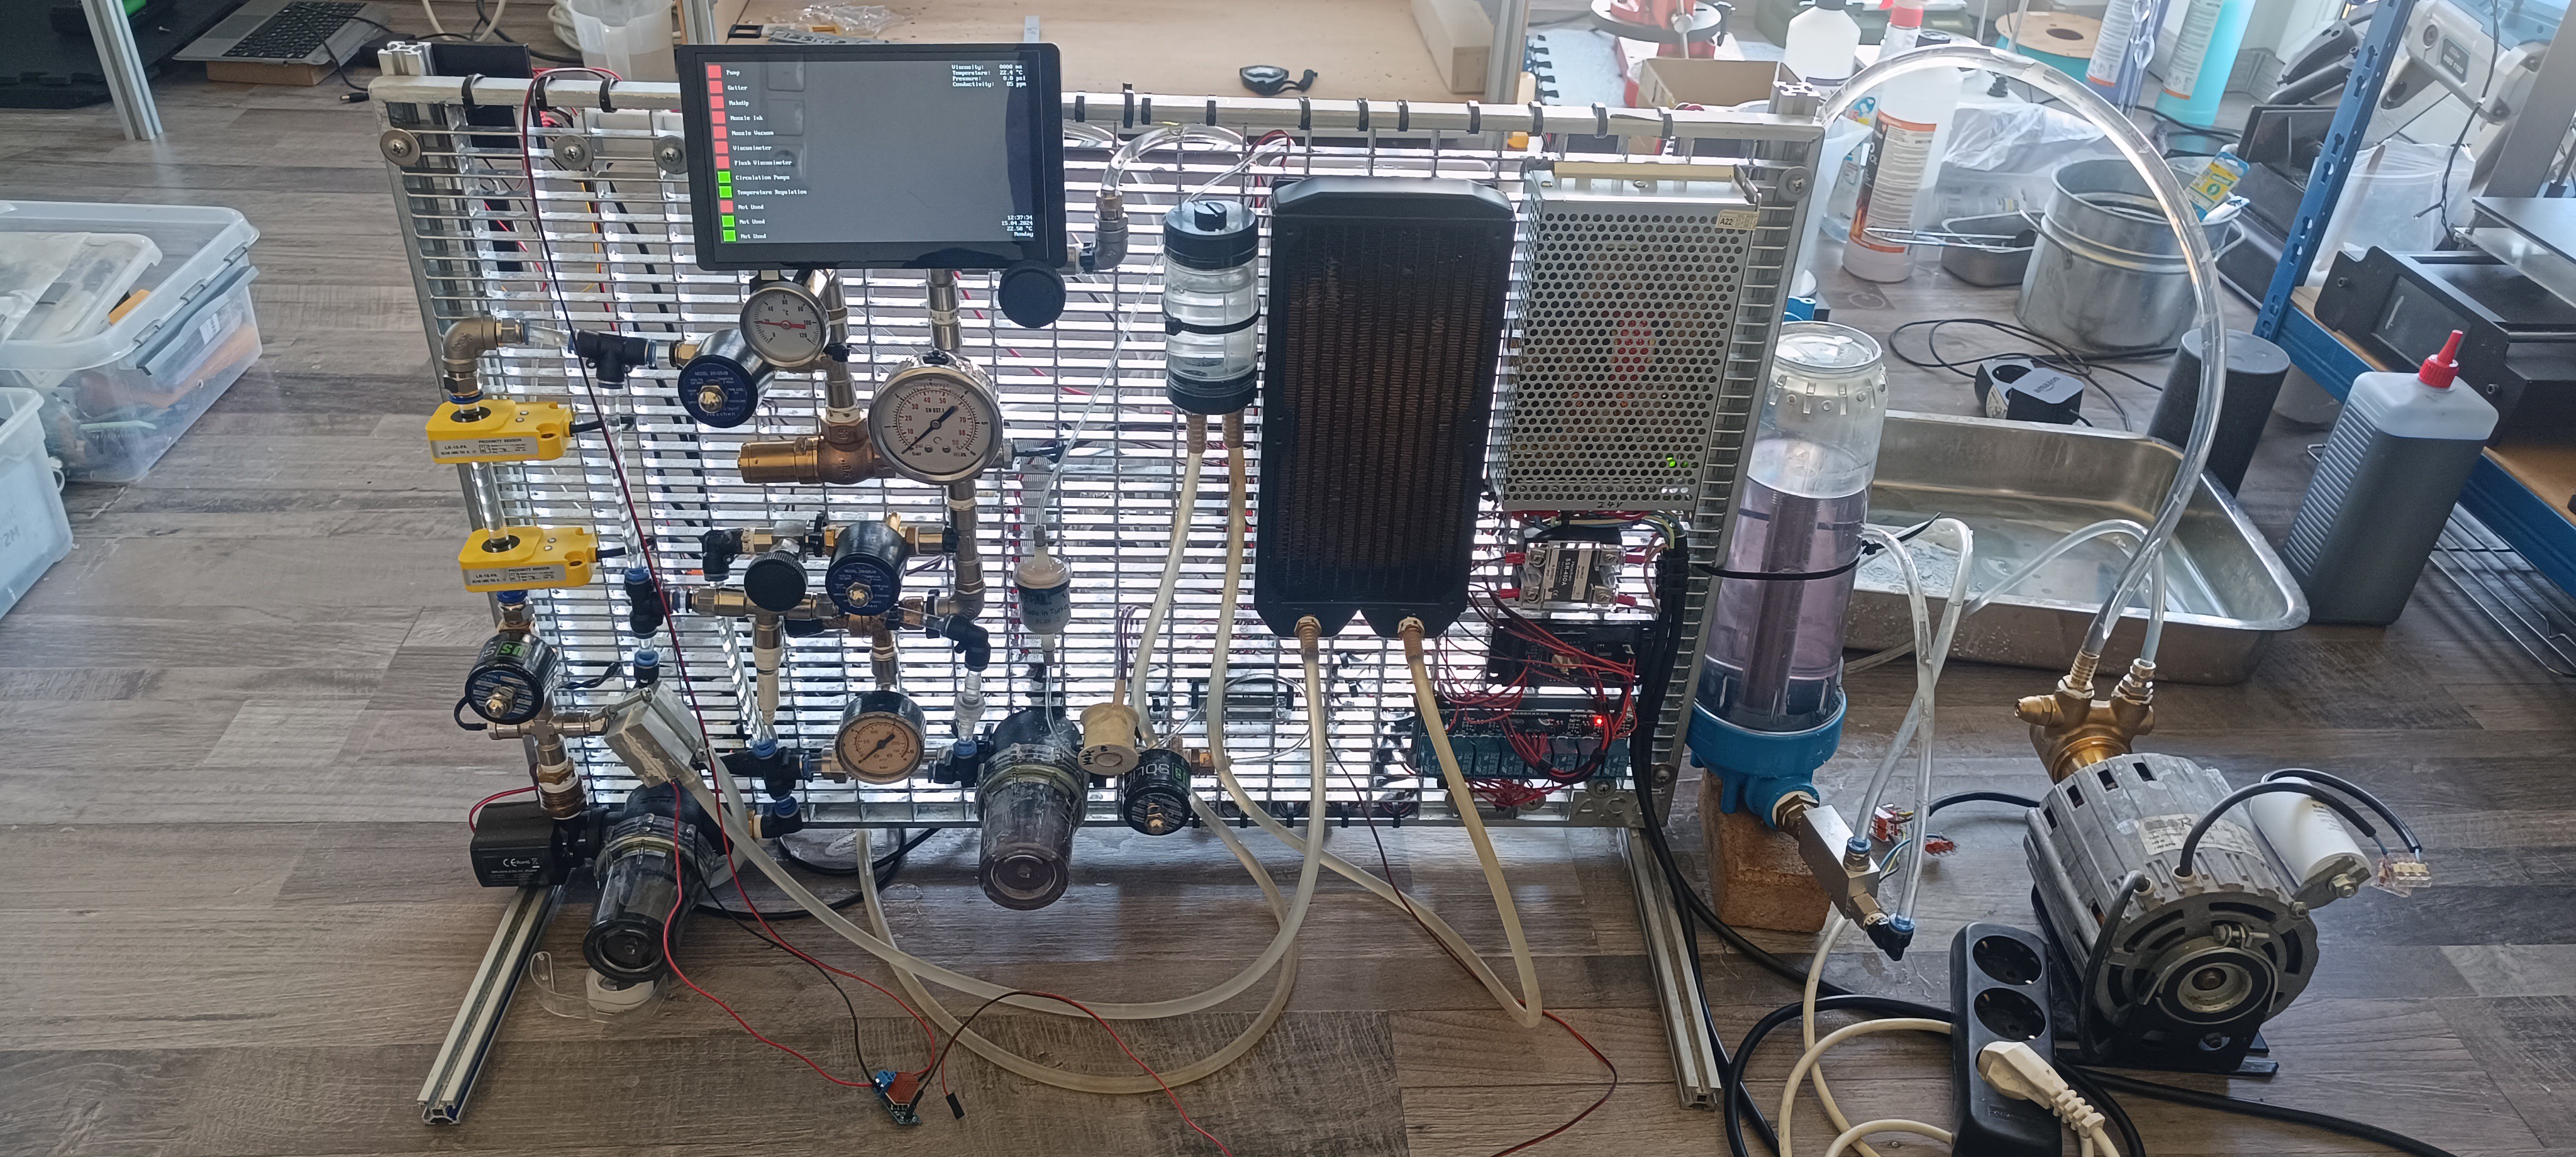
Currently, I'm using two XL4016 step-down converters for converting 24V from the power supply to 5V and 12V.
While the 5V is used for powering the I2C devices and sensors, the 12V is used for the Peltier module and viscosimeter valve.
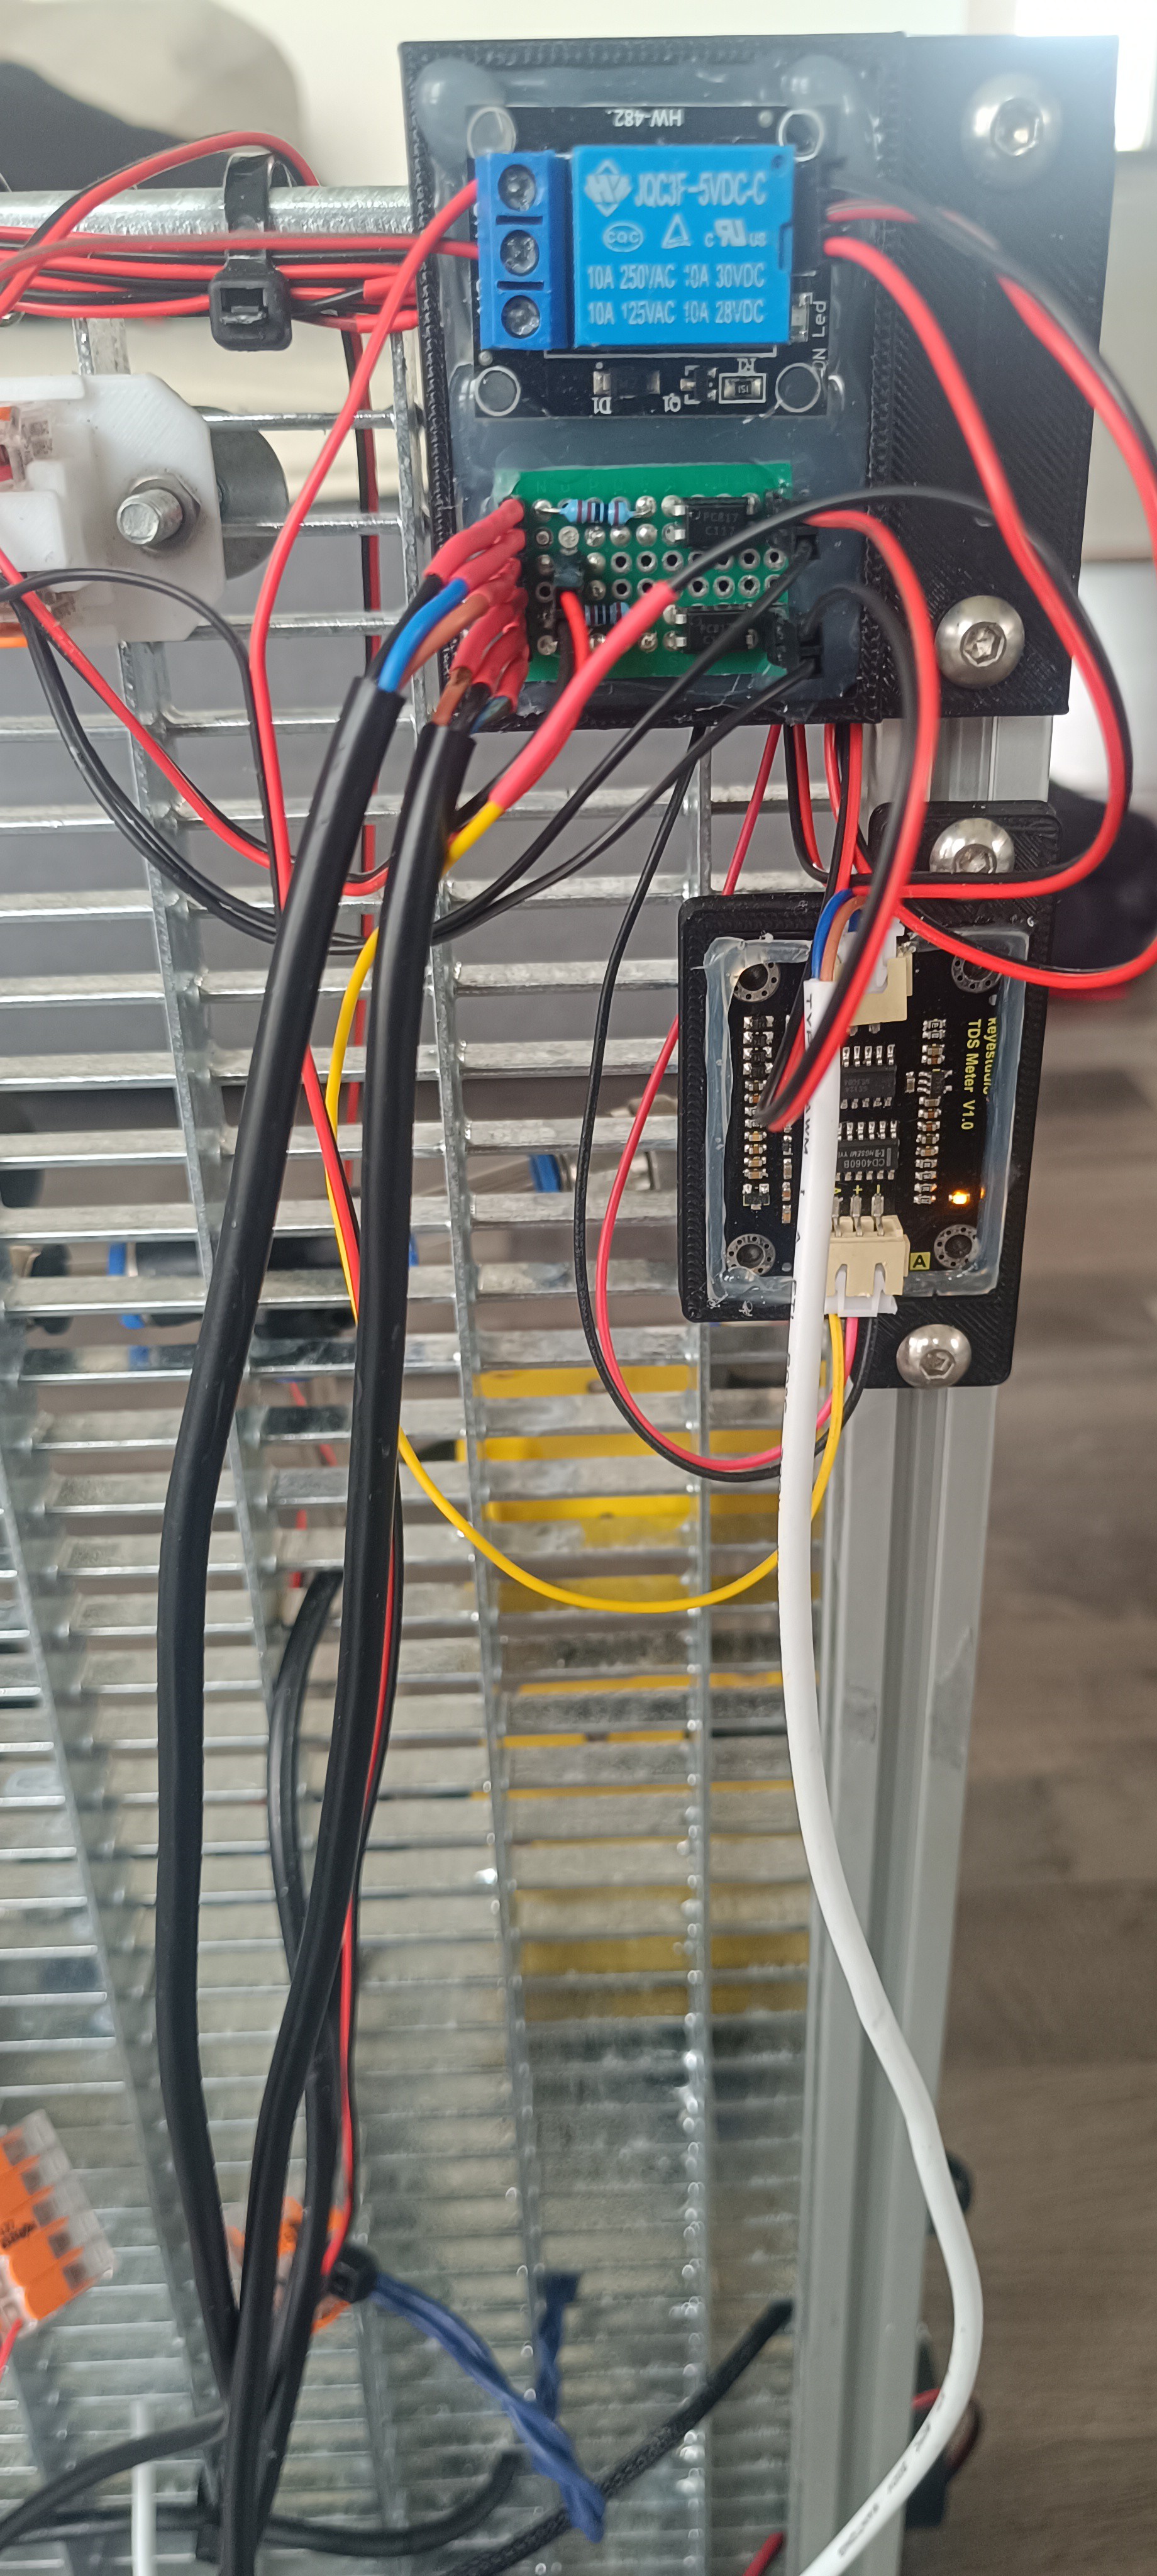
A single relay module is used to open the valve for lifting the 8mm steel ball inside the viscosimeter. The falling steel ball gets detected by 2 inductive sensors.
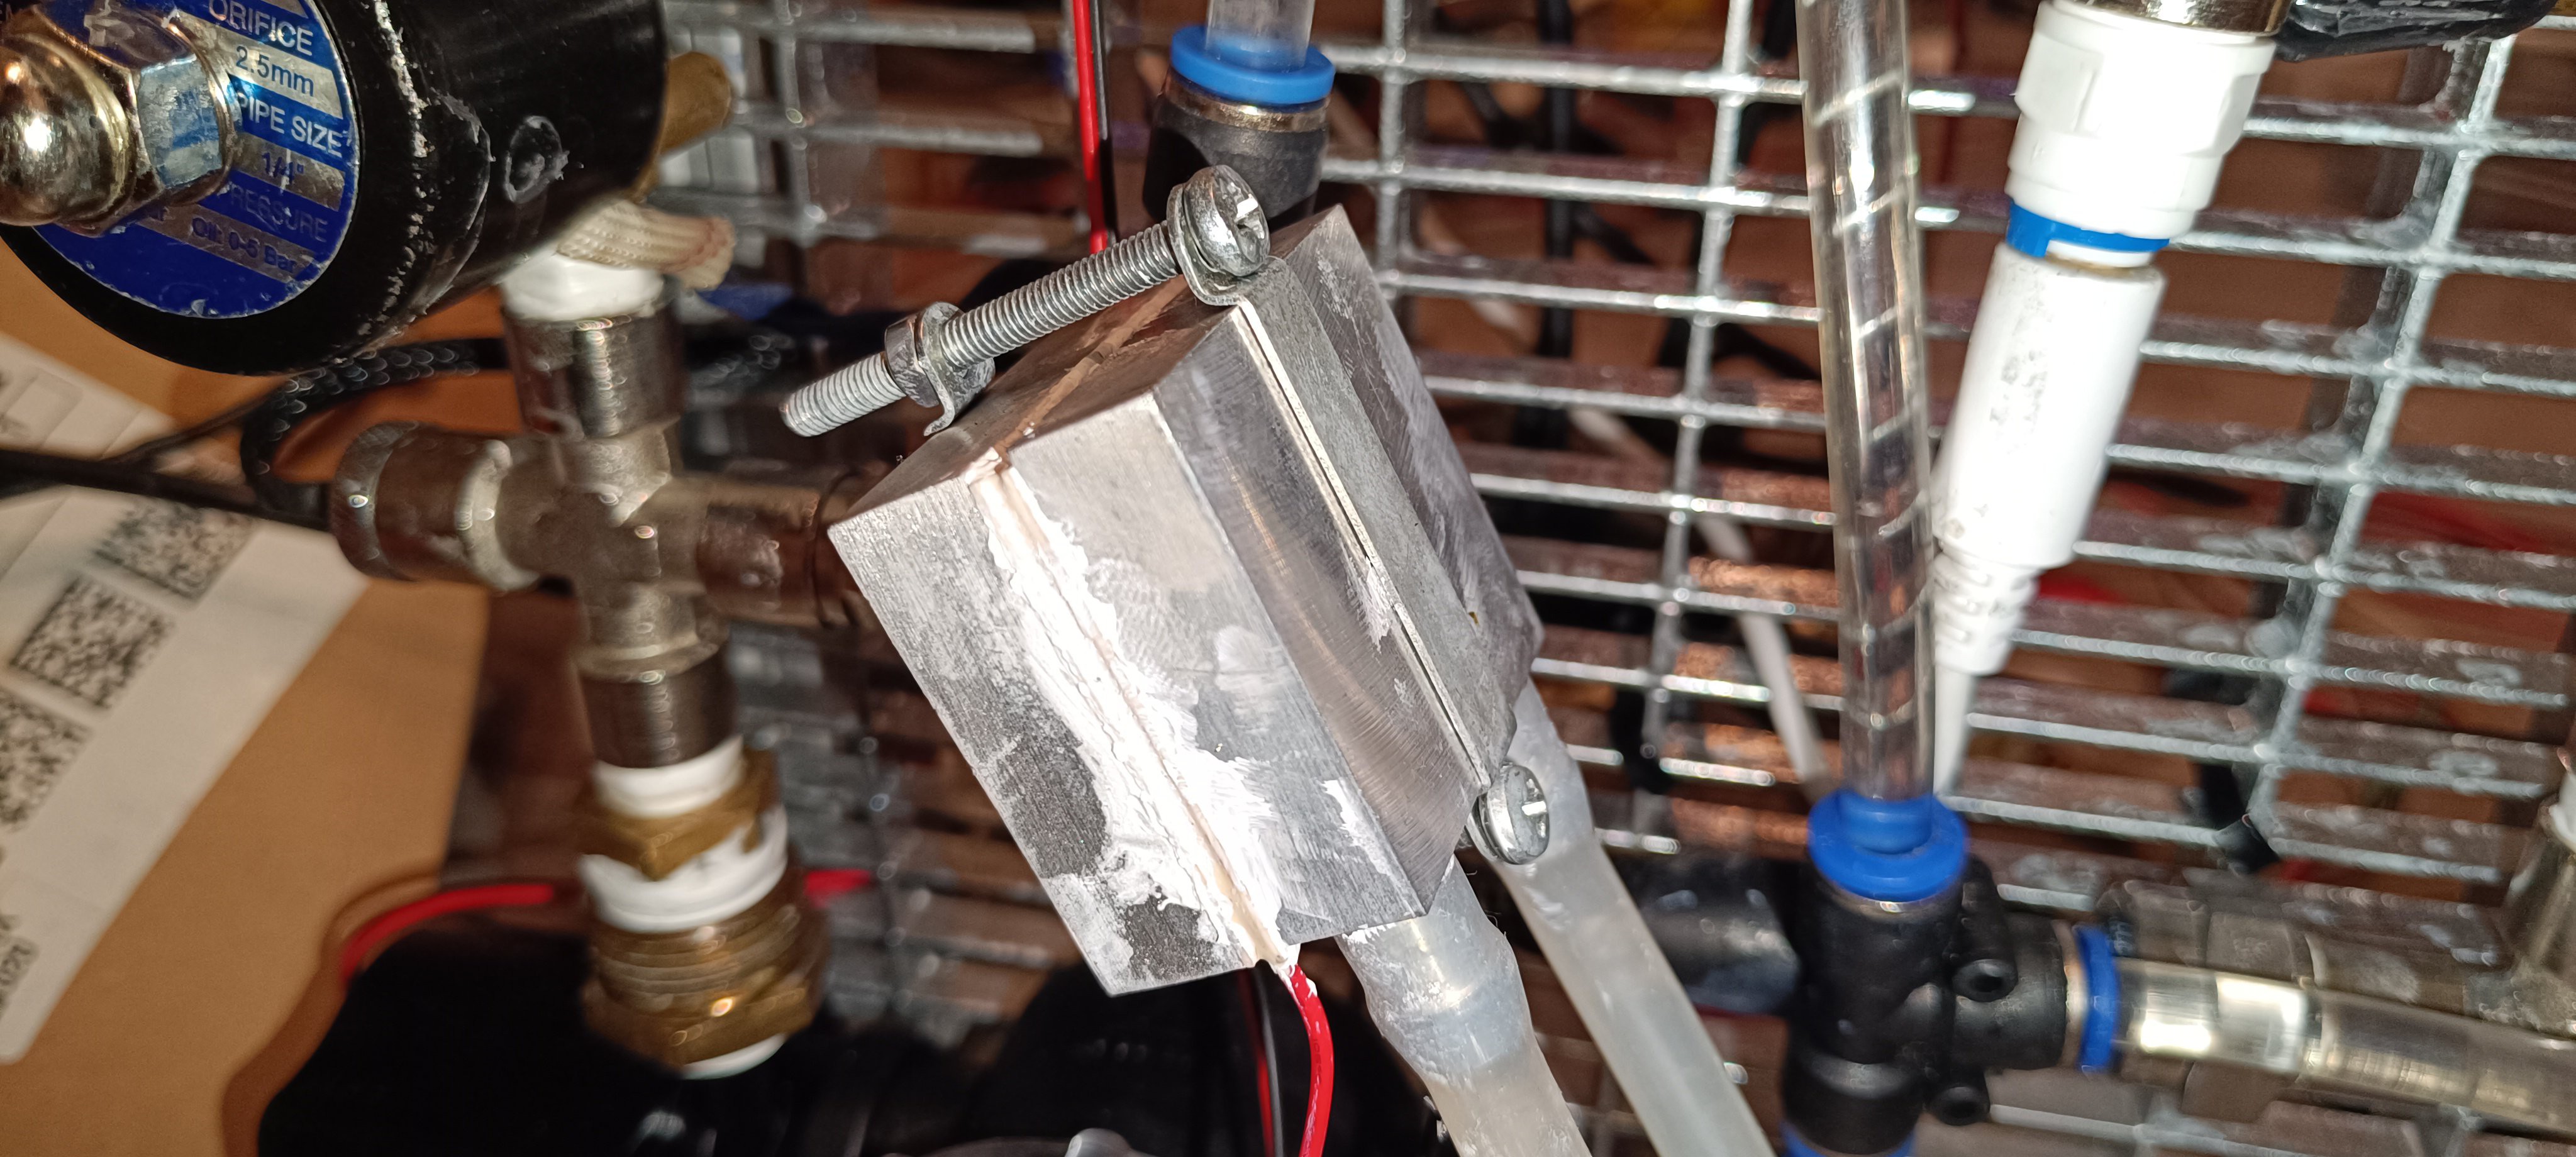
For the viscosimeter, I used a clear polycarbonate pipe with a 10x8mm diameter and 150mm length. The distance between the two sensors is 60mm.

I used a dual MOSFET module for switching the 12706 Peltier module with a 1kHz PWM signal.

The Peltier model draws around 50W during testing and the MOSFET module gets very hot without cooling so I will likely place the MOSFET modules for both Peltier modules next to each other and add a small silent 40mm fan for cooling.
Together with the pump that pumps the ink around inside the viscosimeter and also heats it up, a thermistor in the cross-fitting, and some PID code, the temperature of the ink inside the viscosimeter can be kept constant without oscillation.
In the future, I will add some code to flush the viscosimeter from time to time with fresh ink to check if the viscosity has changed and automatically add solvent if the viscosity has risen too high because of solvent evaporation.
For flushing, the viscosimeter is connected to the main ink cycle by two valves that can be opened to let fresh ink flow through the viscosimeter while the pump is running and the measuring pipe's valve is opened to flush all the old ink out.
I think this will add a lot of value to the machine since it makes the testing results more comparable and will provide a way to share the collected data besides recording videos and taking pictures. In the best case, it would be possible to display the sensor readings as graph lines and have a way to see which machine function was active at a time, e.g. to see that the viscosity decreases with a temperature rise or that the pressure drops when the ink valve is opened and so on.
Thank you for your interest in my project :)
Discussions
Become a Hackaday.io Member
Create an account to leave a comment. Already have an account? Log In.