 Bharbour
Since cold beer is one of the essential food groups, determining whether beer chills faster in a can or a bottle is an important question. An additional aspect to this is whether the cardboard 6 pack holder makes any difference.
At the start of the test, I was expecting the liquid in the can to cool much faster than the bottle because the thermal conductivity of aluminum is pretty high, while glass is lower. Water was used in the test, using beer for this test would have been alcohol abuse! Measuring the time to chill from 24C (75F) down to 10C (50F) seemed like a reasonable method to answer this question.
Retesting with the can and bottles in a cardboard 6 pack holder seemed like it should make some difference in the cool down time, but how much was unknown.
As a way to gather data for this test, I modified 2 of the thermocouples for my 4 channel temperature logger https://hackaday.io/project/159100-4-channel-temperature-logger to tolerate immersion in liquid. Thermocouples that are in nice stainless steel sleeves for immersion are available at a very fancy price. I opted to make my own probes with brass tubing and the plastic dip coating used for tool handles. While not pretty, it seems to have worked OK for this test.
My Temperature Logger sends temperature and time data out of a USB port as lines of comma separated variables with temperatures and time information on each line. That data was captured on my netbook for these tests.
To conduct these tests, the Temperature Logger was placed on top of the fridge (a 20 year old Amana) with a probe in the bottle, the can and a third in the air in the fridge for ambient temperature data. The bottle and the can were filled from the sink and I assumed that the water would be a similar temperature in each as a starting point. The bottle and can were put in the cardboard 6 packer for the first test run and the 6 packer was set on the middle shelf of the refridgerator with the thermocouple wires leading up through the door seal to the Logger on top.

The USB cable is routed to the left, down to the netbook for data capture.

As you might expect, there was some interest in getting this done while my partner was not around, as there was a fair amount of wiring and foolishness in the kitchen. The first test started at about 07:15 local time and ran for about 3 hours. Data was captured at 10 second intervals.

The blue and the red traces show the temperatures of the liquid in the bottle and can respectively. Ambient temperature inside the fridge is the yellow trace. Temperature inside the Temperature Logger is the green trace.
Examining the red and blue traces, you can see that the temperature tracks pretty closely between the liquid temperature in the bottle and the can. Over all, it took about 3 hours for the liquid to cool down from 24C to 10C. The yellow trace shows that the temperature inside the fridge higher than I expected and it was cycling more than I expected. I don't know if this is related to an auto-defrost cycle or a 20 year old fridge.
Prior to starting the second test run, I emptied and rinsed the bottle and can in the sink 3 times to try to get both of them warmed up to about the same temperature as the first test run. The freshly filled bottle and can were placed in similar places inside the fridge, but without the cardboard 6 packer to hold them.

Channel assignments and recording interval are the same as the previous run. Looking at the temperatures at the left edge of the plot, the initial matchup of the temperatures between the bottle and the can were not as good as the first run with a 1.5C difference. By the time the temperature approached 14C, the difference dimminished considerably. At 10.0C, the temperature in the bottle was lagging the temperature in the can by about 3 minutes. This test started at about 10:20 local time, and the fridge was cycling much more slowly and reaching a lower temperature. The total time from 24C down to 10C was about 2 hours.
After running the first two sets of tests, it occurred to me that a larger can (473mL 1 pint) might cool at a different rate than a standard size can (355mL 12 Oz). While searching the net, I came across a comment that wrapping a can in wet paper towel would make it cool faster. @vincent stuchly also mentioned this in a comment here, so I added it to the next test run.
Both of the cans in the next test run were placed in approximately the same place, on the same shelf in the fridge as the previous tests. Data was captured at 10 second intervals again.
The Large Can was tested as a bare can to be similar to the best configuration in the previous test. Assuming that the cooling rate would be proportional to the volume of the can / surface area, and the two cans were almost identical in diameter (6.58cm or 2.590") the larger can should cool at the same rate as the smaller can. The Large Can took about 108 minutes to cool from about 23C down to 10C. Comparing the graph of the Large Can temperature vs time for the bare 355mL can in the previous data, the cool down time is very similar, probably within bounds of the initial water temperature variation.
 Can, Channel 2 Wet (355ml) Can, Channel 3 Ambient Air in the Fridge.")
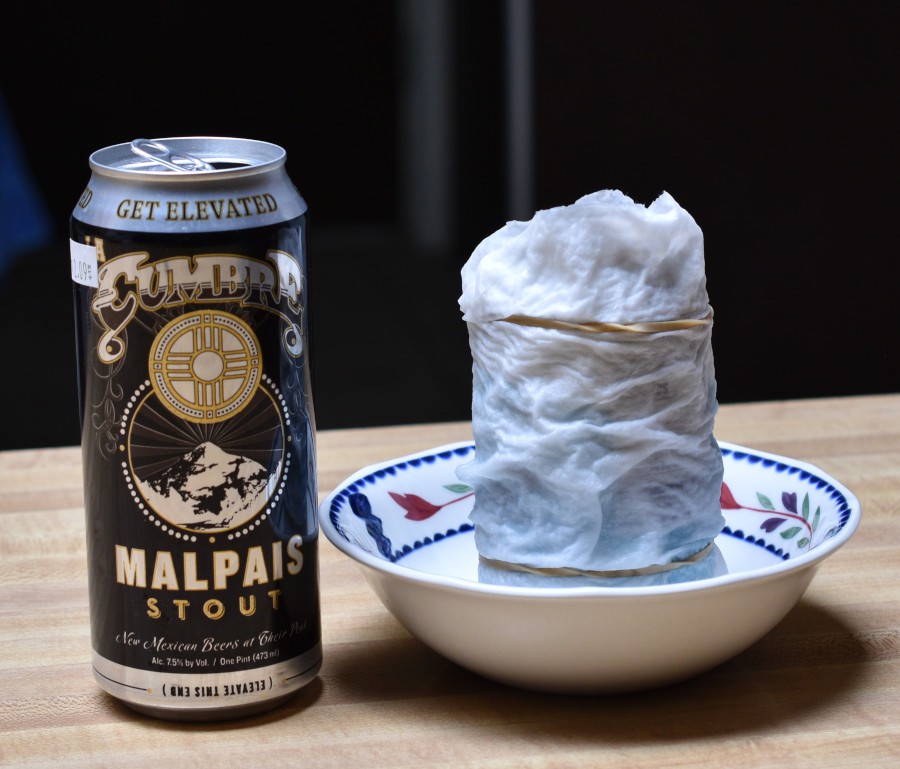
A 355mL can was wrapped in a double layer of paper towel and two rubber bands applied to keep the towel in place. The towel was wetted thoroughly while filling the can. The can and towel were put in a small bowl to minimize the mess in the fridge (and my partners wrath). The Wet Can took about 61 minutes to cool from 24C down to 10C. Comparing the cooldown time of the Wet Can (about 61 minutes) with the Bare Can (about 116 minutes) in the previous test run, the Wet can was very close to a 50% improvement.
Conclusion
The liquid in the bottle cooled at a very similar rate to the liquid in the can. Containers in the cardboard 6 packer took 50% longer to cool than the bare containers. The larger bare can cooled at about the same rate as the standard sized bare can. The best improvement was the wet can, which cooled in 61 minutes, or about 1/3 the time of a can in a cardboard 6 packer.