 Filip Mulier
We had a cold spell so I took the opportunity to add temp sensors to the microphone enclosure to measure how the inside temp varied. The enclosure is foam insulation so I was curious as to how the 0.84W (12v x 0.070A) power usage of the system, which all turns into heat in the end, would keep the inside of the enclosure warm. For Li-ion cells, the lowest temp is -20C (-4F). I wanted to calculate the R-value of the enclosure, which is roughly related to the temp difference between the inside and the outside and takes into account the watts of energy introduced in the enclosure.
Time Series of Temperatures (deg F) and R-value (USA units)
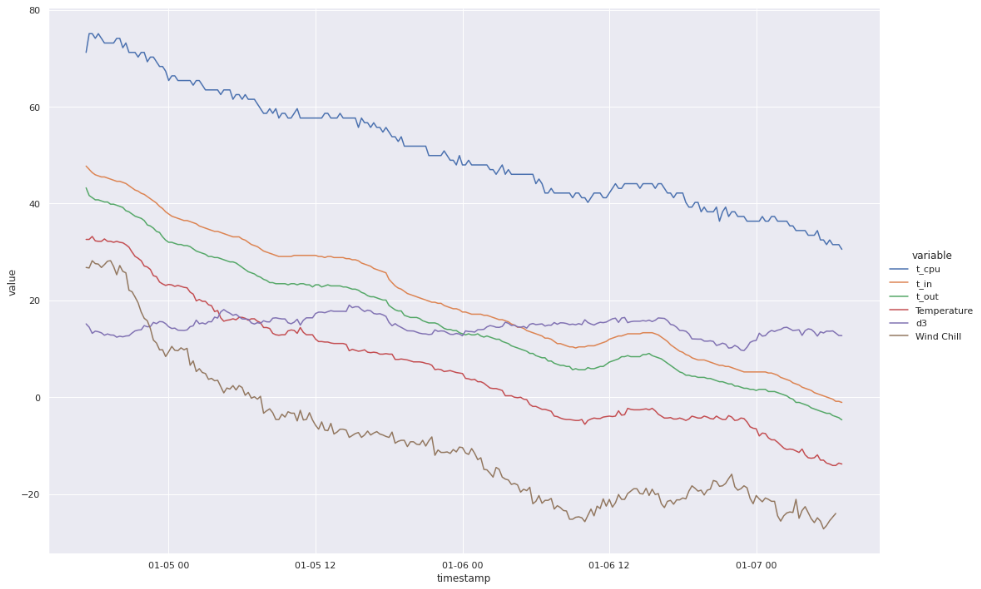
The horizontal axis shows the day and time, with grid lines at 12 hour increments. The details for the traces are:
t_cpu - Temp as reported by the cpu die in deg F
t_in - Temp inside the enclosure in deg F
t_out - Temp outside the enclosure, but inside the wind screen deg F
Temperature - Historical temp from a weather service deg F
d3 - difference between t_in and Temperature deg F
Wind Chill - feells like temp for human exposure deg F
The system started at indoor temperatures and cooled off as the outdoor temperature also decreased.
In perfectly controlled conditions for this type of test, d3 would remain constant. But this test was done outside, so d3 is varying ,probably due to sunlight hitting the enclosure and also wind speed changes over the day. The test was done on the north side of a building so direct sun was blocked, but the air may have heated from a nearby building. Can see a daily bump around noon. Wind speeds varied from calm to peaks of 15 mph. Cloud cover varied from clear to overcast.
d3 statistics- Difference between outdoor temperature and internal enclosure temp
mean      14.649698
std        1.821744
min        9.625000
25%       13.568750
50%       14.787500
75%       15.706250
max       19.025000
The R value (USA units) is calculated as:
{𝑅=3.15459074295484(−𝑇1+𝑇2)𝑤}
So for fixed watts, its related to the temp difference d3 in the chart.
R-value (USA units) Statistics
mean      55.016429
std        6.841497
min       36.146352
25%       50.956968
50%       55.533941
75%       58.984275
max       71.447725
Bottom line based on this experiment:
For this enclosure design, a 'safe' outside temperature limit is about 10 deg F lower than the minimum internal enclosure temp desired. Safe here is 3-sigma from the mean. So a Li-ion battery with a -4F lower temp limit can be used at -14 deg F.
Unfortunately for my area the lower limit is around -20 deg F, so some sort of additional insulation, heating, or alternative battery is required for full unattended usage during winter. One option is to use battery power to heat the enclosure for the cold periods. Since we seek a 16 degree margin between inside and outside temp, a factor of 1.6, we need 1.6 factor in the watts of heat input to the enclosure, or 1.34 watts, instead of the 0.84 watts currently. We could use a 'dumb' resistor, or we could use a CPU to do something better with the energy.
(No Li-ion batteries were harmed in this experiment - it was done with mains power)
Discussions
Become a Hackaday.io Member
Create an account to leave a comment. Already have an account? Log In.