Close
0%
0%

jumplogger 2022

yet another skydiving altimeter/logger using machine learning to identify exit

Similar projects worth following
digital altimeters and jump loggers are plentiful available today. But skydivers of wing suit or canopy formation (CRW) disciplines have problems logging their jumps, since slow or short fall rate makes identifying the exit (= start of tracking) problematic.
This should be changed with this approach:

• part one is a tracking device that collects the data of many jumps in many skydiving disciplines. (current status)

• part two is feeding this data into a edge impulse project to identify distinctive patterns of the exit parameters for the disciplines

• part three is to implement the decision algorithm using tinyML into the Jumplogger tracking device.

The (part one) tracking device is finished. It uses an ESP32 DevKit V4 processor board, a 1100mAh LiPo battery, an BME280 pressure sensor, a microSD card board and Beitian BP220 GPS device. Display is a reflective DOGM 128x64 LCD with no backlight.

jumplogger dashboard

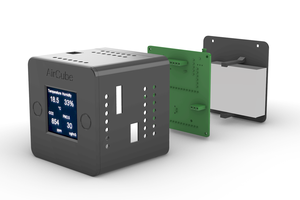
Jumplogger is a next generation skydive jump logger: a combined digital altimeter, GPS tracker, motion sensor and a device that allows detailed afterflight/jump analysis.

Hardware

The unit is based on the versatile ESP32 Wifi processor. This gives not only enough processing power to handle complex math transformation but also offers an elegant web dashboard on your mobile phone, pad or desktop

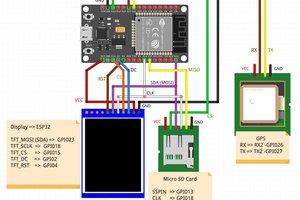
  • ESP32 WROOM dual kernel 32bit processor
  • GPS data is recorded with the BN220 GPS module using the ublox M8 chip generation
  • Pressure – and accordingly altitude – is measured with the BOSCH BMP388 sensor
  • The IMU ADXL345 provides acceleration data
  • A microSD card is added to store all tracking data
  • For displaying data, a 128x64 monochromic transflective LCD is used
  • Powered by a 1100mAh LiPO battery plus charger, giving ca 10hrs continuous operating time

More info on CRWDgs.com

Dashboard app

For displaying the collected data of the jumplogger, a dashboard web-app is used. This opens in a normal web browser on laptops and desktops, for mobile devices a browser or a natively compiled app can be used.

In the current prototype, the device acts as a webserver, generating and delivering the complete HTML code to the user browser. Because of the limited resources, this doesn't make sense. This web-app should bring all data interpretation to the server and only communicate with the device via WIFI and Ajax calls to collect the necessary data. More data should be collected from external websites and aggregated in the dashboard.

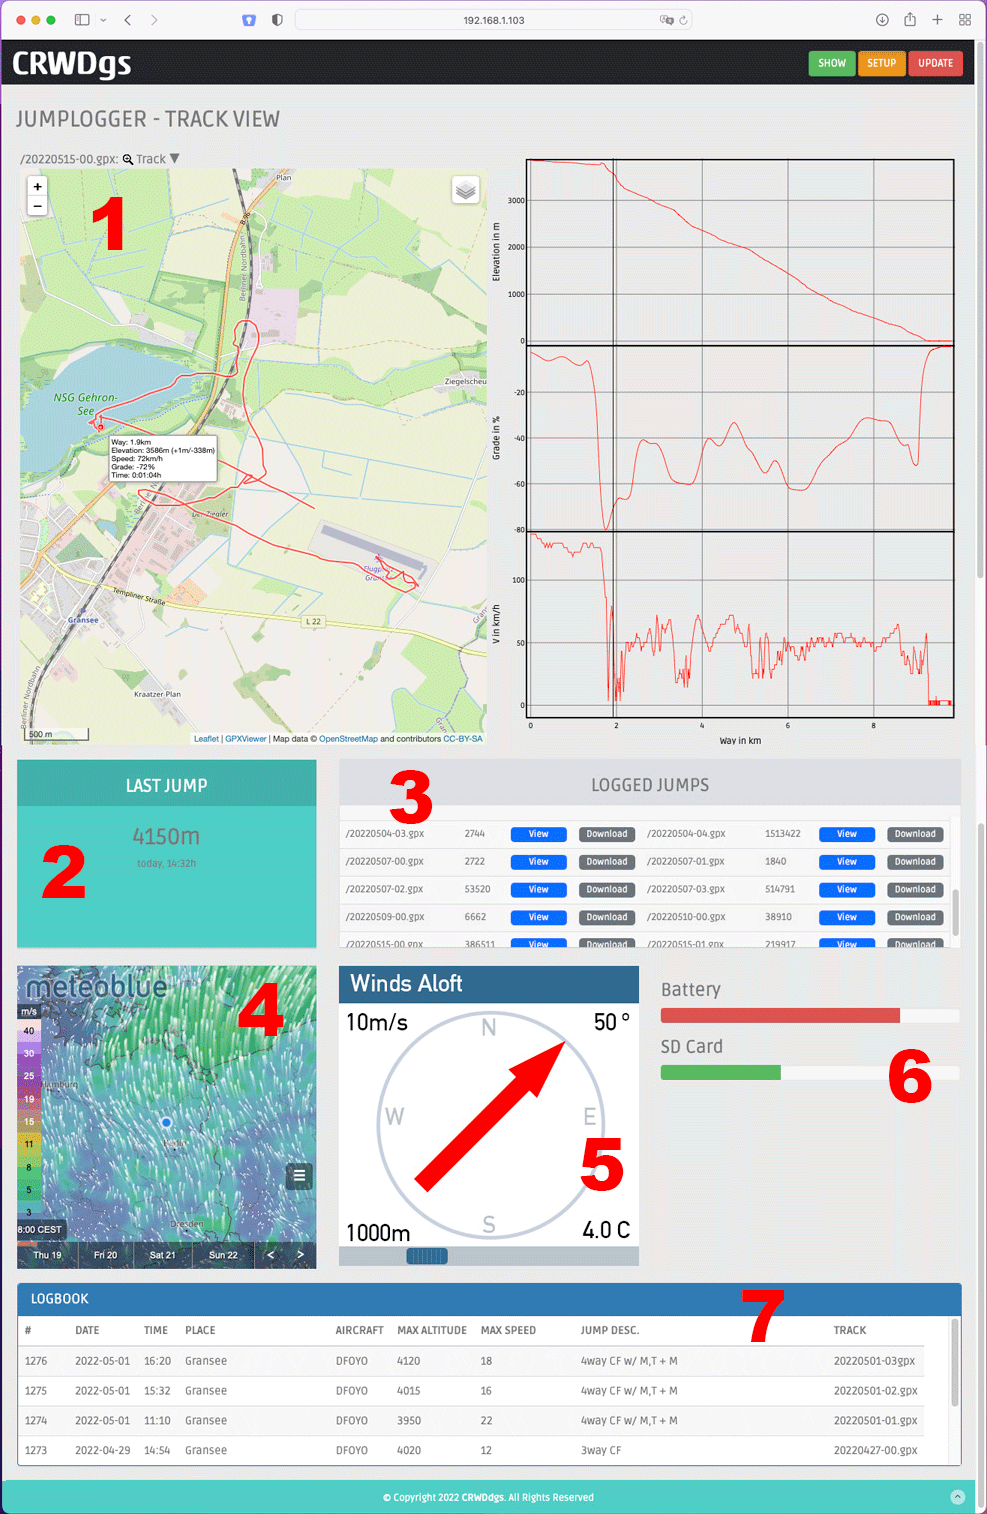
GPX track visualization (1)

One main function is the GPX track visualization. This owns the upper half of the screen. The track visualization is done by the ready-made javascript GPX Viewer. Tracking file from the SD Card file is transferred to this script and the graph is generated in a < div > container.

This javascript should be used as-is and integrated in the dashboard.

track file list (3)

All logged GPX tracks are located on the jumplogger SD-card. A directory of the SD-card files is presented in a list on the dashboard (sent from the jumplogger Webserver via Ajax call). For each file a download or the display on the dashboard can be selected.

logbook function (7)

On the main dashboard screen, the logbook (a list of all jumps that have been made) with elementary track data is shown (jump-number, location, date/time, aircraft, max altitude, max speed, link to detailed logging file). This info comes from a "logbook.csv" file on the jumploggers SD-card. This file is read from the app after each connection, all new file are uploaded to the dashboards cloud- database. The latest entry is shown on a dashboard card (2). The lat/lon location info in the file needs to be reverse-geolocated to display a city.

Not all info in the log file can be retrieved from the device, so it needs a record- editor to add more fields and data, adding descriptive texts, photns etc. In a Firebase implementation, the cloud database plus picture storage comes into place.

last jump card (2)

The card uses information from the log book, displaying info from the last entry. The data can be retrieved from the logbook file.

winds aloft graph (5)

The site windsaloft.us/ gives wind direction and windspeed for a specific location over altitude. This is displayed as an interactive graph on the dashboard. The location info comes from the jumplogger GPS device via an Ajax call.

weather forecast (4)

The weather forecast widget is currently an iframe with ready-made javascript from meteoblue This javascript should be used as-is and integrated in the dashboard. Also for other requirements an API is also available.

JPEG Image - 4.81 MB - 02/16/2022 at 20:16

Preview
Download

JPEG Image - 4.02 MB - 02/16/2022 at 20:16

Preview
Download

JPEG Image - 3.36 MB - 02/16/2022 at 20:16

Preview
Download

JPEG Image - 2.39 MB - 02/16/2022 at 20:16

Preview
Download

  • 1 × ESP32-DevKit-Lipo OLIMEX ESP32-DevKit-LiPo is a DEVKIT V4 compatible board with integrated LiPo charger
  • 1 × Beitian BN-220 Dual GPS Glonass Modul small GPS unit with antenna
  • 1 × BMP 280 GY-BMP280 barometric pressure sensor 3.3V compatible
  • 1 × EA DOG-M 12864 LCD module https://www.lcd-module.com/eng/pdf/grafik/dogm128e.pdf
  • 1 × SD Card Reader Module Micro Sd Card Reader Arduino 3.3V compatible (no level shifter)

View all 7 components

  • altimeter reading and jump experience

    ajanky11/01/2021 at 10:11 0 comments

    • Correct altimeter reading is a bit tricky. In a vacuum-chamber test the Jumplogger, an analog Barigo and the X2 showed different results: Barigo and X2 pretty close 4000m, the jumpLogger ca 4500m (baro).

    This although the BOSCH BMP280 (probably the same as in the X2) is pretty precise plus temperature compensated. 

    Temperature seems to be the problem: the "international barometric formula" for calculating altitude from pressure refers to a temperature gradient of 0,65 K per 100m. The BMP280 library calculates altitude by measuring the temperature of the sensor, in my vacuum chamber around 20ºC - this is not a temp that you see in 4000m altitude, so it reports a wrong altitude!

    Problem is, that the temp of the sensor never reflects the actual situation, since jumping out of a heated aircraft will keep it warm until you reach the ground...

    I didn't use the altimeter function of the library but just measure the pressure and convert to altitude with a fixed theoretical temperature of 0ºC = 273K - this gives me results pretty close to the other altimeters (+- 50m)


    #####
    [EDIT APR2022] above was WRONG. Altimeters typically conform to ICAO standard atmosphere. That is 15ºC at sea level, -0.65ºC per 100m altitude gain. So to display consistent corrected altitude, I start at 15ºC in the barometric formula and use the last corrected altitude to adjust the temp factor by the "-0.65ºC per 100m" -  this gives correct readings parallel to X2 and Barigo :-)
    #####

    • using the jumpLogger on the aisle side arm in a Cessna Caravan had problems with continuous GPS reception. Having it on the window-side arm seems to resolve this problem. Probably the same behavior as all the other GPS devices

    • I added a video of a test jump with the jumpLogger on YouTube:

  • first jump log today

    ajanky10/23/2021 at 19:27 0 comments

    (Oct, 23. 2021) - unfortunately end of season in most of Europe. more work on the software and waiting for next year!

    On the display of the device ist shown the current altitude (meters), rounded to 10m increments (logged is full precision).

    The coordinates of the DZ (or landing point) are stored with a push button before the jump.

    The display shows the distance and relative bearing to this point. So for jumps in unknown areas or sudden clouds your way back to the drop zone is shown with direction to go and distance. 

    currently, the unit logs a trackpoint every second, containing LAT, LON, ALT (baro), ALT (GPS) and speed in GPX format. The ALT sensor measures every 125ms (8 per second). For analysis of exit point its probably better to store all 8 altitude measurements per second. this will be done outside the GPX format, since its XML and very verbose. files get easily several MBytes. I believe a line of cdv values ist sufficient, since this data is necessary only for the ML training phase.

View all 2 project logs

Enjoy this project?

Share

Discussions

Similar Projects

Does this project spark your interest?

Become a member to follow this project and never miss any updates