 strange.rand
Here is a short (hopefully) log about the recent updates.
Time sync (NTP)
During searching for an optimal NTP library for ESP32, I've found out that the time syncing functionality can be added simply by including <time.h> header.
First, we need to configure time. It can be done in two ways:
- using configTime(<GMT offset>, <DST offset>, <NTP server>)
- using configTzTime(<timezone>, <NTP server>)
The second option is a great way to automatically handle switching to daylight saving time. The required timezones can be found here: zones.csv. Then we can use getLocalTime method to retrieve a local time. Time syncing will be executed automatically every hour (by default).
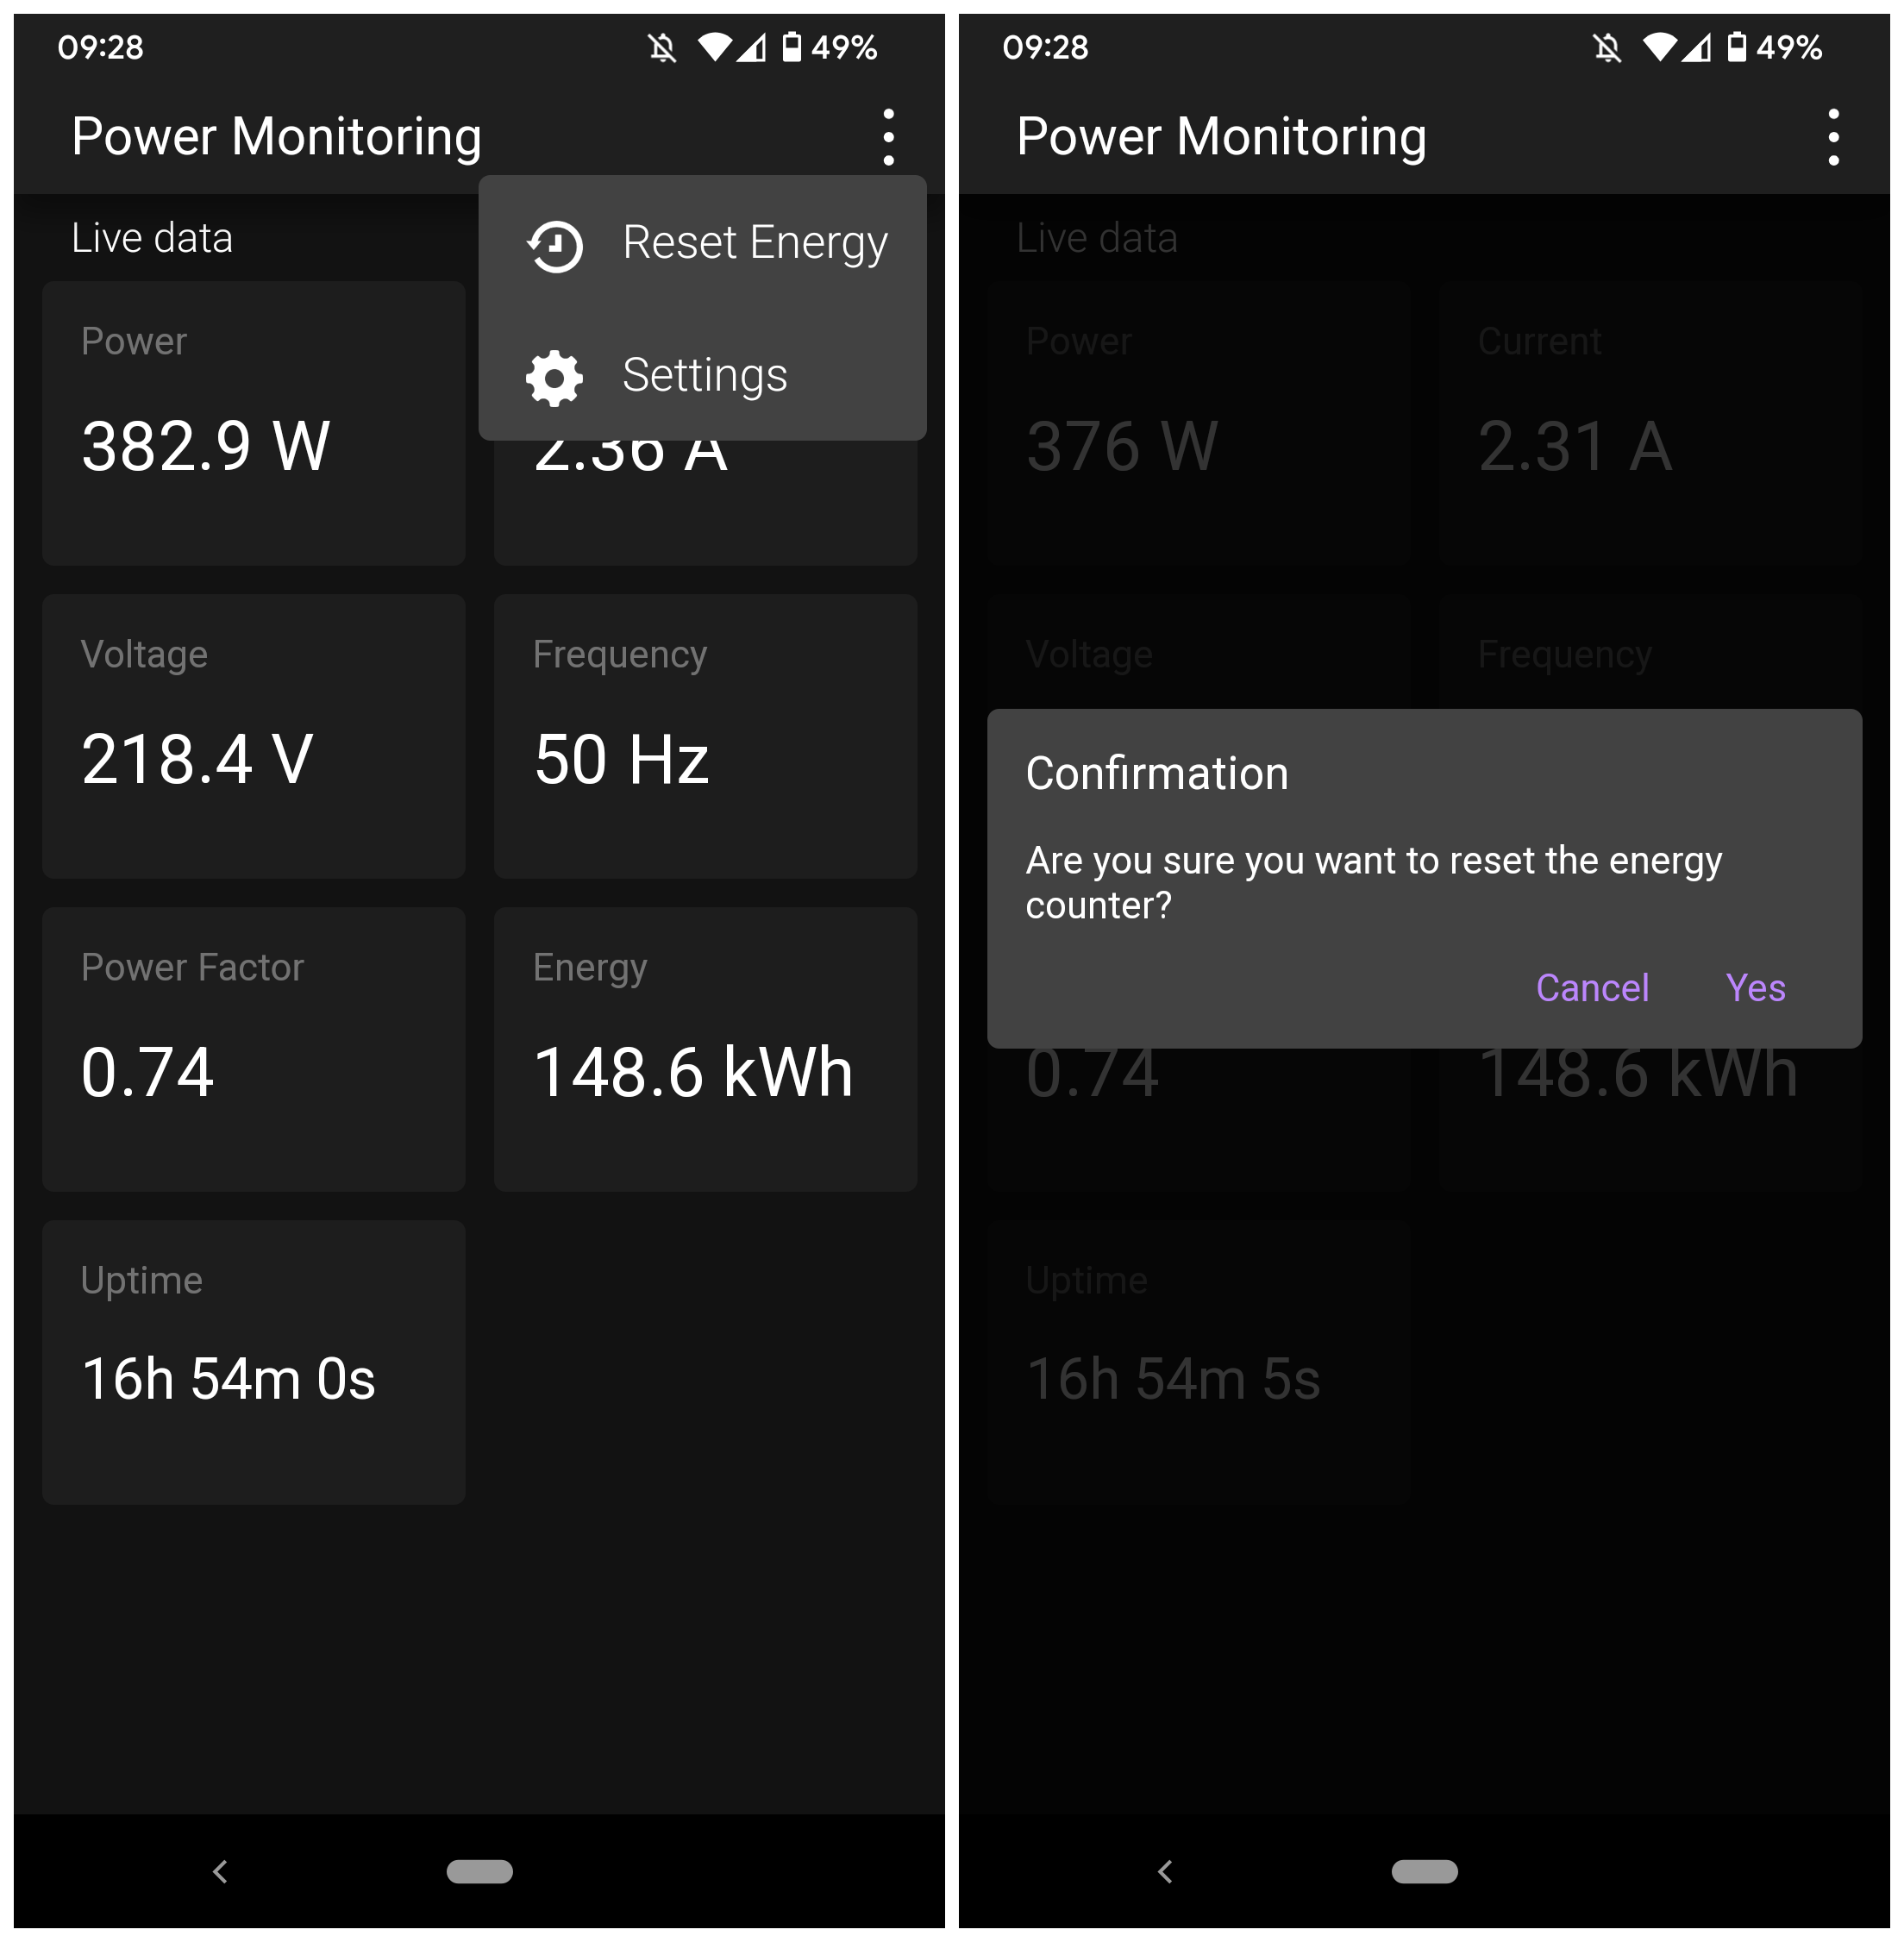
Reset energy
It can be done using a new menu:
Charts
This is the most controversial functionality (or the most useless one). I wanted to store and show power and voltage for the last 12 hours (it's enough for basic stuff). Let's do quick math:
12 × 60 × 60 = 43200 datapoints
(4 + 4 + 4) × 43200 = 12 × 43200 = 518400 bytes
It is a lot, so I decided to aggregate data per minute, that's reduces needed memory to 8640 bytes. After additional thinking, the decision to store min and max was made, so the final structure looks like this:
struct ChartData
{
    uint32_t date;
    float minVoltage;
    float maxVoltage;
    float minPower;
    float maxPower;
};
Two circular buffers are used to store the values. One is processed and cleared every minute, and one is for "permanent" storage.
CircularBuffer<ChartData, 720> chartBuffer;
CircularBuffer<TempChartData, 60> tempChartBuffer;
ArduinoJson library is not used to build the final JSON response to additionally reduce memory consumption.
Selecting a proper chart library was hard. I started from Google Charts, then tried ChartJS, one or two other libs, and then finally uPlot. It is small, fast, and has enough features to display what I want though, it also has a big disadvantage – pure documentation.
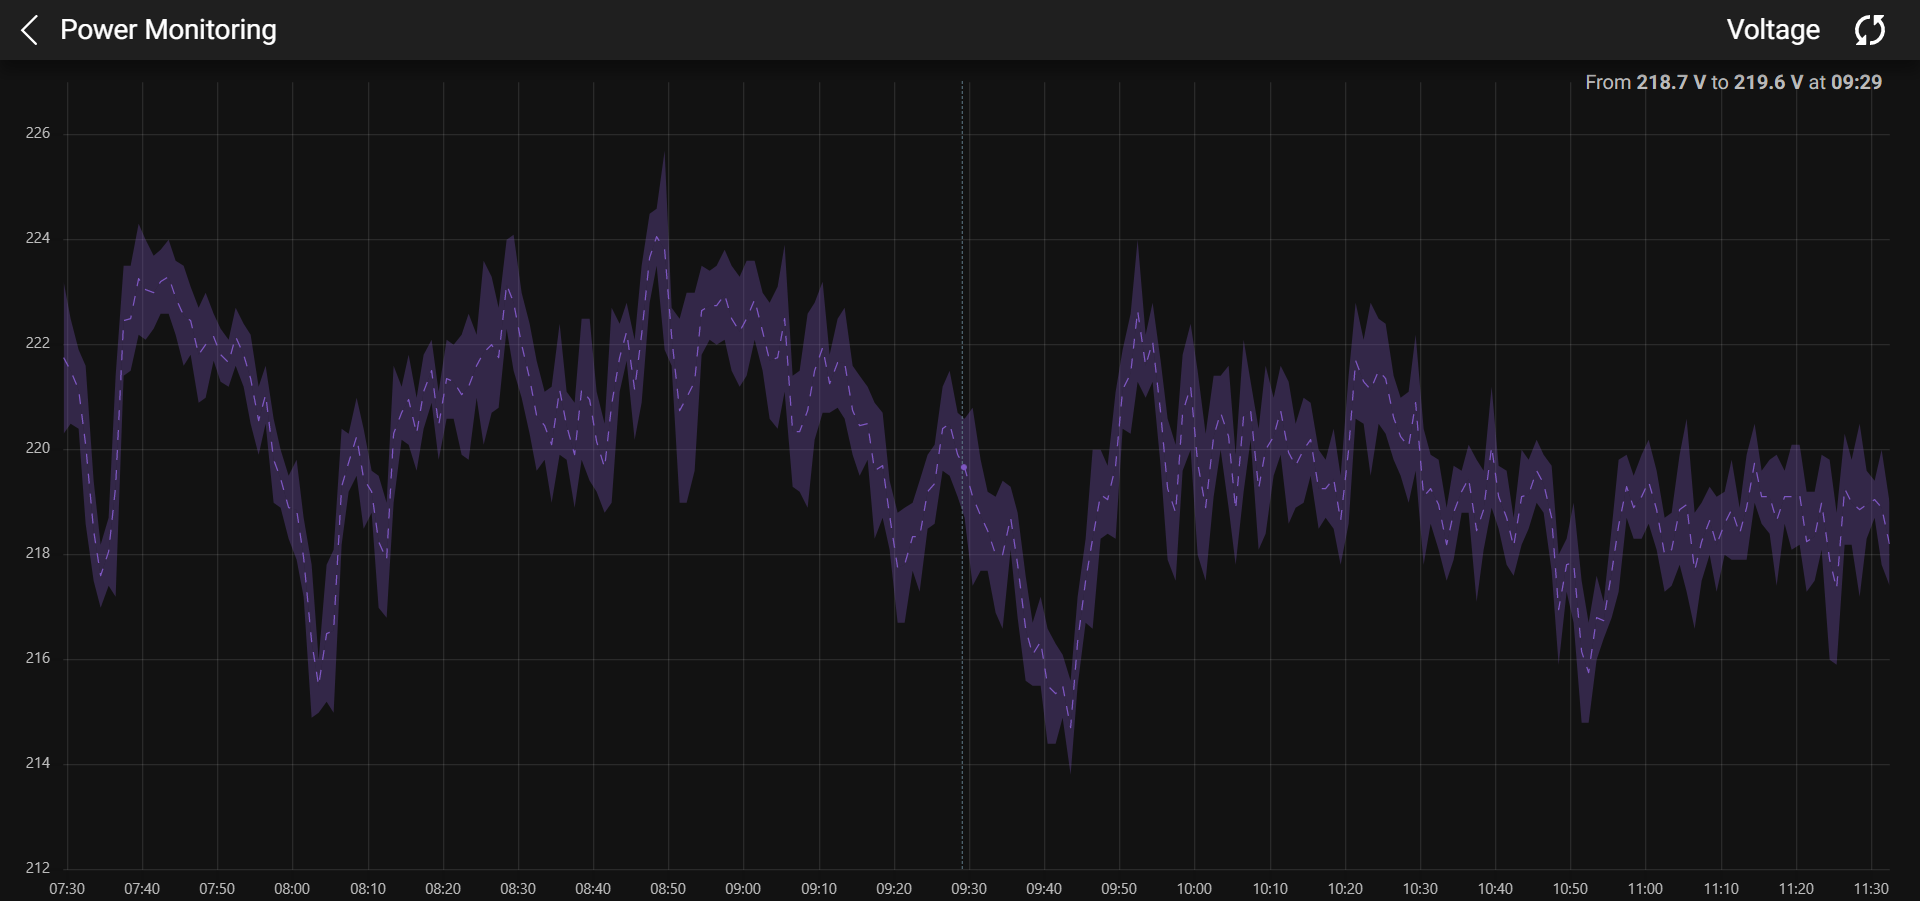
Even considering that the chart supports zooming and panning, using it on the smartphone isn't comfortable. But it was an interesting process to build it. One additional thing I like to try here – streaming data directly from the circular buffer without an intermediate char array (it'll drastically reduce memory consumption).
Next steps
- An automatic reset of the energy counter
- Refactoring
- Bugfixes
Discussions
Become a Hackaday.io Member
Create an account to leave a comment. Already have an account? Log In.