 Sagar 001
Hello everyone, Oscilloscope is mandatory for every electronics student or hobbyist. Keeping the budget in mind, I suggest you use Mobile as an oscilloscope. But we can’t interface the signals directly to mobile phones. So here we are using Raspberry pi Pico as the brain of this project. The signal from Pico goes to Mobile through USB to get a decent waveform. Let’s make this project step by step.
Note** This project is only for educational purposes, and this Oscilloscope can measure small signals only. Not for commercial purposes, just a project to know the capabilities of this board.
Features of Oscilloscope:
- 200Khz bandwidth
- 2-channel supported
- 500KS/s sampling rate
- Time/div: 5micro Second to 20 Sec
- Needs a very few components
- Accuracy: +-10>#/span###
- Onboard 1khz wave for testing
- Low power consumption
- USB Interface
Raspberry pi Pico:
This Microcontroller has an RP2040 ARM Cotex-M0 dual-core processor and a flexible clock up to 133MHz. 264KB of SRAM, 26 GPIO pins- 3 Analog from them. 2 UART, 2-SPI, 2-I2C and 16 PWM channels. Also, have on chip clock and temperature sensor. Supply ranges from 1.8- 5.5 volts.
Pinout:

Setting up Pi-Pico:
First, download the below-given code, Then Plug your Raspberry Pico into your PC holding bootsel button to on position. Raspberry Pi will appear as a mass storage device in the local disk manager. Copy this code in raspberry pi storage, and it’s done.

Code and Firmware:
Press the bootsel button on your Pico and connect it to your computer. Copy the uf2 file onto your Pico. The onboard LED should start blinking.
Circuit diagram
Here, GPIO26 is channel one, and GPIO27 is channel 2. Giving a signal of 0 to +3.3 volts to any channel and GND of signal to GND of Pi, connecting USB to the smartphone through USB completes all the connections.
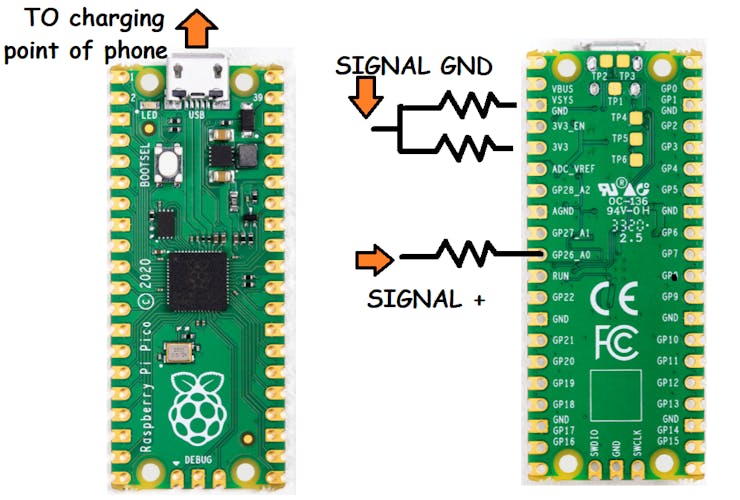
For High voltages, we can add a 100k resistor to channel pins. To measure negative voltages and signals (say -3.3 to +3.3 volts), we can make a resistor divider network using a 1k resistor between 3.3v and ground that can do the job perfectly.
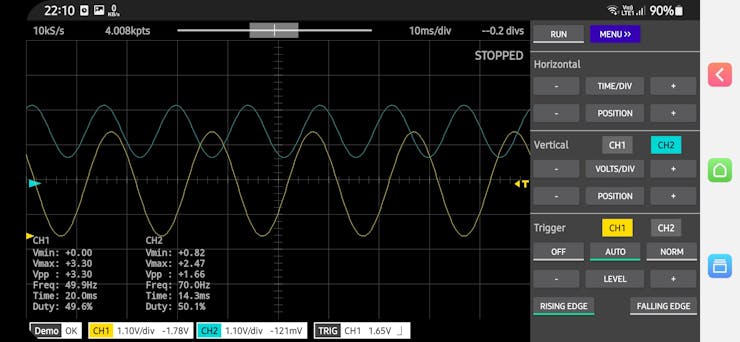
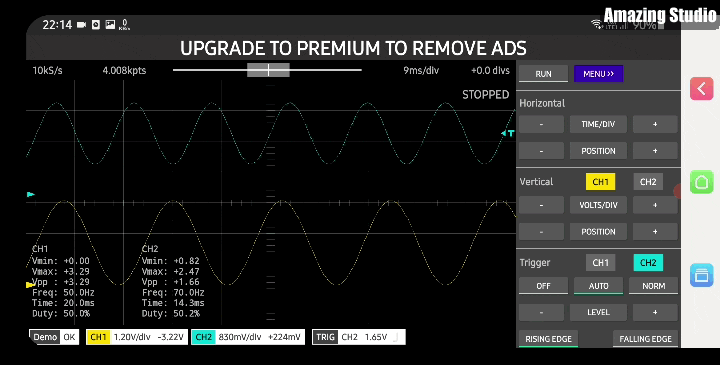
The screen of Oscilloscope:
Here, a dedicated application is provided to show the waveforms and signals received from the Pico board. Named SCOOPY, this is free to use, and through this, we can access one channel. For the second channel, we have to pay a small amount to the creator of this App.

It comes with an excellent interface to analyze the waveform. We can adjust the position of the wave in the X-Y direction. Increase/ Decrease the time per division and volts per division. This application can run on an android smartphone (Minimum requirements are Lollypop 6 or a 1.2GHz equivalent).

A sine 50Hz Demo signal with a duty cycle of 50% is provided to check the channel or do calibrations in the application. Touchscreen also makes the moves more easier.

Also, the real-time readings of the signal are displayed in the corner, which consists of Voltage, Frequency, time and duty cycle.

Applications also have the signal generator and logic analyzer features, which comes with the free version of the App. The signal generator supports only sine and square waves with a frequency range of 1.25Mhz.

Connections with mobile phone:
Raspberry pi board has a micro USB port, To analyze the waveform of signal, we are using mobile phone. Connections can be setup easily between Pico and mobile through charging jack.

Mobile charging jack also has Micro usb, so either we have to buy the supported cable or through OTG jack may do the job. After this, make sure to select Input signal to USB.
Oscilloscope:
Here I tried few it with few demo signals and some test signals with USB. It is cable to show waveform up to 100MHz. And we can measure frequency and duty cycle of signal up to 250KHz.
It is useless to higher frequency signal, but in this cost I think this is best one.


 KM4EFP
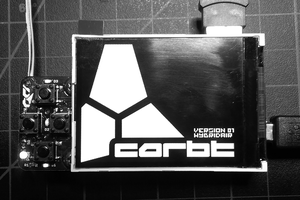
 HybridAir
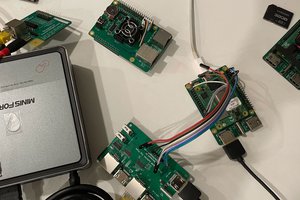
 vileer
It's a pretty oscilloscope for this small amount of component.
But you should clamp the input signal with at least by zeners by the way if you want to use it and think about a (small) filter and multisampling to increase precision and maybe even max out the bandwidth. It's very possible I think.