 Antoine
Our last objectif was to link the sensored data to a website updating in live. In order to do it, we used two different free services :
- Google Firebase to host the database
- Netlify to host the website on a server
First, we opened a new database on Google Firebase to store our values. We only had to get the link of the database to start communicating with it.
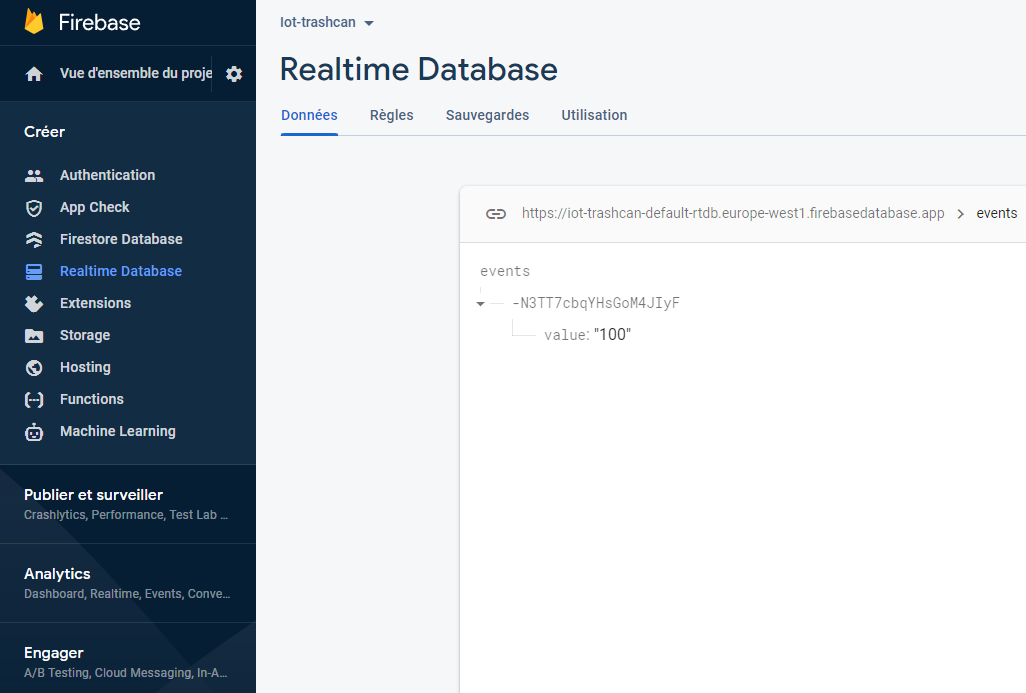
Then we had to communicate from the python script to the database. For this we used the "requests" library. We added a few lines at the end of the script to : delete the previous value, send the new one and display some status codes of the requests in the console.
Here is the final code :
import RPi.GPIO as GPIO
import time
import requests

""" < VAR DEF > """
TRIG=18
ECHO=24
RED=2
BLUE=8
GREEN=25
ln_trash = 50 #Length of the trash
ln_avg = 5 #Number of values used to calculate the avg length
values = []


""" < SETUP OF THE GPIOs > """
GPIO.setmode(GPIO.BCM)
GPIO.setup(TRIG,GPIO.OUT)
GPIO.setup(ECHO,GPIO.IN)
GPIO.setup(RED,GPIO.OUT)
GPIO.setup(GREEN,GPIO.OUT)
GPIO.setup(BLUE,GPIO.OUT)


""" < RESET OF THE LEDS > """
GPIO.output(RED, False)
GPIO.output(BLUE, False)
GPIO.output(GREEN, False)


""" < MAIN PROCESS > """
while (True) :

        #CALCULATING THE DISTANCE
        GPIO.output(TRIG,False)
        time.sleep(0.5)
        GPIO.output(TRIG, True)
        time.sleep(0.00001)
        GPIO.output(TRIG,False)

        while GPIO.input(ECHO)==0:
                pulse_start = time.time()

        while GPIO.input(ECHO)==1:
                pulse_end=time.time()

        pulse_duration=pulse_end-pulse_start
        distance=pulse_duration*17000
        distance=round(distance,1)

        #Calculating the avg value
        if len(values) == ln_avg :
                values.pop(0)
        values.append(distance)

        avg_value = 0
        for val in values :
                avg_value += val
        avg_distance = avg_value/len(values)

        print("Distance : ",avg_distance,"cm")

        #UPDATING THE DATA AND THE LED
        if (distance < ln_trash*0.3) : # < 30% remaining
                GPIO.output(RED, True)
                GPIO.output(BLUE, False)
                GPIO.output(GREEN, False)
                print("LED color : RED")
                value = 100

        elif (distance < ln_trash*0.6) : # <60% remaining
                GPIO.output(RED, True)
                GPIO.output(BLUE, False)
                GPIO.output(GREEN, True)
                print("LED color : YELLOW")
                value = 60

        else :                           # >60% remaining
                GPIO.output(RED, False)
                GPIO.output(BLUE, False)
                GPIO.output(GREEN, True)
                print("LED color : GREEN")
                value = 30

        #SENDING DATA TO THE SERVER PART
        response =  requests.delete("https://iot-trashcan-default-rtdb.europe-west1.firebasedatabase.app/events.json")
        print("> Delete data : ",response.status_code)

        params = {'value': value}
        headers = {'Content-Type': 'application/json'}
        response = requests.post("https://iot-trashcan-default-rtdb.europe-west1.firebasedatabase.app/events.json", json = params, headers = headers)
        print("> Send data : ",response.status_code,"\n")


GPIO.cleanup()
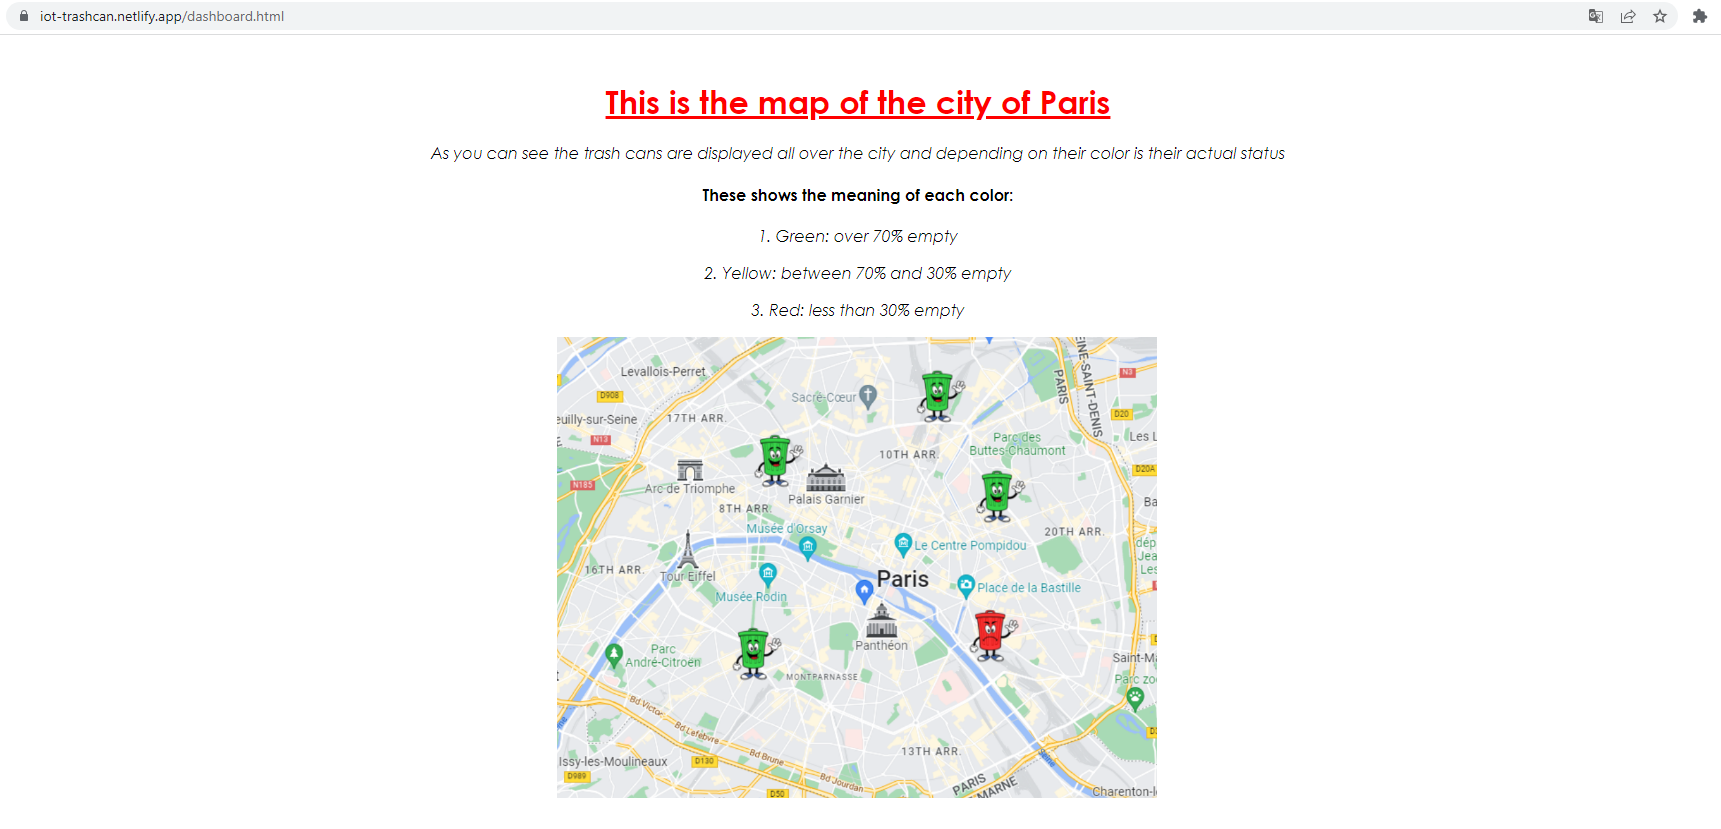
Last thing, we had to open a server on Netlify and put our code on it. We linked our github account to Netlify, put our code on Github and selected it on Netlify. We had to change the HTML code the add an updating part in order to have a real time changing display according to the data. So we added a JSON script and a CSS stylesheet at the beginning of the code and here is the final result for the dashboard page :
<HTML>
<HEAD>
<style>
.red-square {
  height: 461px;
  width: 602px;
  background-image: url("./map rouge.png");
  background-repeat: no-repeat;
}
.green-square {
  height: 461px;
  width: 602px;
  background-image: url("./map vert.png");
  background-repeat: no-repeat;
}
.yellow-square {
  height: 461px;
  width: 602px;
  background-image: url("./map jaune.png");
  background-repeat: no-repeat;
}
</style>
</style>
<script src="https://ajax.googleapis.com/ajax/libs/jquery/3.6.0/jquery.min.js"></script>
 <script>
    $( document ).ready(function(){
        setInterval(function(){
            $( "#results" ).empty();
            $.getJSON("https://iot-trashcan-default-rtdb.europe-west1.firebasedatabase.app/events.json", function(data, status){
                $.each(data, function(key, val) {
                    if(val.value == 30) {
                        $("<div class=\"green-square\"></div>'").appendTo($("#results"));
                    }
                    else if(val.value == 60)    {
                        $("<div class=\"yellow-square\"></div>").appendTo($("#results"));
                    }
                    else if(val.value == 100) {
                        $("<div class=\"red-square\"></div>").appendTo($("#results"));
                    }
                });
            });
        }, 500); // 0.5 secondes
    });
    </script>

<TITLE> Trash can map </TITLE>

<META name="description" content="ejemplos de editores">

</HEAD>

<br>

<H1>
    <CENTER>
    <U>
    <FONT FACE="Century Gothic" COLOR="#FFOOOO">
    This is the map of the city of Paris
    </FONT>
    </U>
    </CENTER>
</H1>


<BODY>

<CENTER>
<FONT FACE="Century Gothic">
<p> As you can see the trash cans are displayed all over the city and depending on their color is their actual status </p>
</FONT>
</CENTER>

<CENTER>
<FONT FACE="Century Gothic">
<h4> These show the meaning of each color: </h4>
<P> </P>
<P> 1. Green: over 70% empty </P>
<P> 2. Yellow: between 70% and 30% empty </P>
<P> 3. Red: less than 30% empty </P>

<div id="results">
</div>

</FONT>
</CENTER>

</BODY>

</HTML>
In the end, we managed to have on online website you can access with this link.
Discussions
Become a Hackaday.io Member
Create an account to leave a comment. Already have an account? Log In.