 peter jansen
A quick update, with what is essentially the first data from Iteration 8!
To say this project has been progressing slower than I'd hoped is an understatement. Raising a little one and being on the tenure track takes up nearly every waking hour of each day, but I'm starting to be able to squeak in an hour after the little one goes to bed every now and again. And with that -- substantial progress, finally!
Thermal Images from the FLIR Lepton
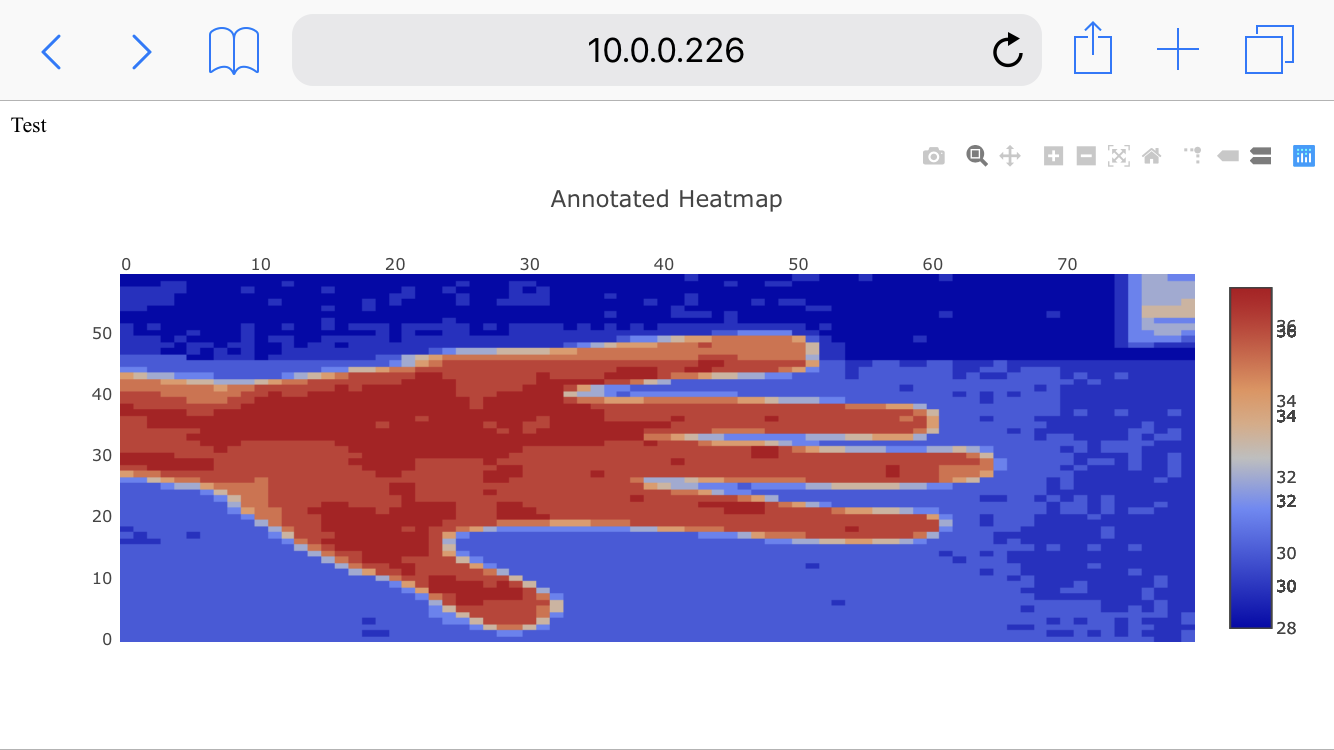
Above is a picture from the FLIR lepton, plugged into the GroupGets PureThermal2 USB breakout, interfaced to the Raspberry Pi Zero W. I made use of disasterarchy's very helpful thermalZero example code to acquire frames of raw temperature data, and modified the example to pipe these out to stdout as a JSON string that any calling program can read. I put together a very quick server using node.js on the backend, with some of the plotly node.js widgets to display data, and everything seems to be mostly working.
One of the issues with interfacing high-bandwidth sensors with a phone has always been how to get the data in. While Android phones sometimes allow a physical connection piping data, this is fairly challenging to do with an iPhone. Bluetooth initially seems like a viable alternative, but the bandwidth is also generally rather limited. And even if either of those alternatives were viable, they would still require writing native Android or iPhone applications to read and display the sensor data, which would be a skill that I unfortunately don't have the time to learn. The (proposed) solution with Iteration 8 has been to have the device take the form of a small web server mounted to the back of an arbitrary phone, so that the user has only to point their web browser to the device address, and they'll be able to interact with the sensing device using a standard web interface. I am primarily a researcher and engineer, but I have had the opportunity to acquire somewhere between mediocre and barely-passable web programming skills over the past few years, so I think I have enough skill to make something that looks reasonably well (or, is at least functional) without having to invest a huge amount of time using this sort of sensing-device-as-a-web-server programming/interaction paradigm.
The above screenshot is a capture from my phone (an iPhone 8), using a regular browser (safari), displaying a thermal image from the FLIR camera using the plotly heatmap widget. The framerate being captured by the device is about 10fps, but the web client is only updating about once every 2 seconds -- so much slower than the data is being captured. I think this is a limitation in my knowledge about sending data streams -- right now I'm sending data in a non-streaming, regular get-request fashion, and sending it as JSON, all of which are likely slowing things down a great deal. So this part is currently working as a proof-of-concept, but at a much slower framerate than is ideal. Even still, that's a much better problem to have than having no data at all.
Magnetic Imager Tile
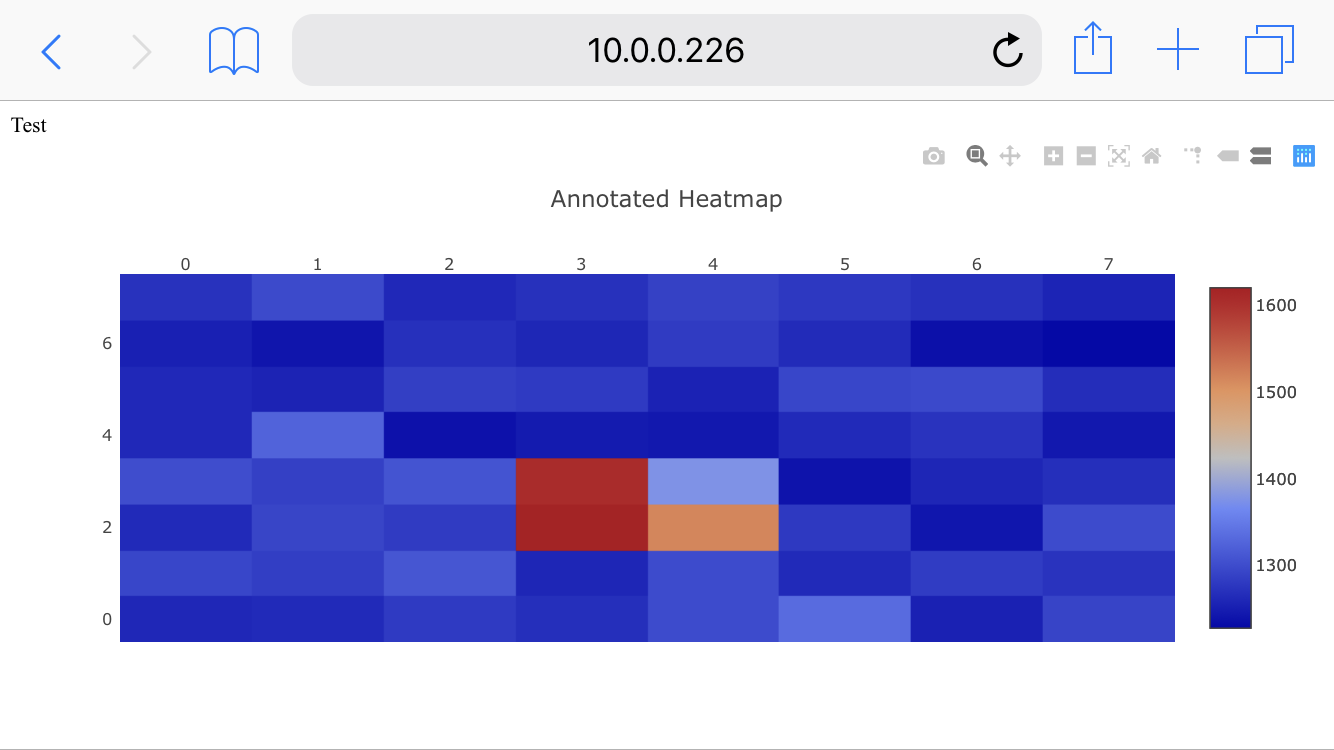
By far one of the sensors I'm most excited about is my magnetic imaging tile, which is essentially a low spatial resolution (8x8 pixels), high temporal resolution magnetic field camera. Though I've only run it at about 2000 frames per second, the DRV5053VA magnetometers used as pixels appear to have a theoretical maximum of about 20Khz, and I'm eager to try and run it at such high speeds and see what I can see. While 2000 fps is enough to see the magnetic fields of transformers oscillating or fan motors spinning, I'm curious if 20Khz would allow one to image the coil of a speaker rendering audio frequencies, which would be very interesting (and cool) if possible.
One of the issues with the magnetic imager tile is that while I had written an Arduino driver for it, I had not yet written a Pi driver -- and I'm much more of a low-level person, so writing a user-space driver for an SPI device with extra GPIO clocking was something I had been putting off.
The tile has been available from Sparkfun for some time, so I decided to do a quick Google a few weeks ago to see if someone had written Raspberry Pi drivers for it. Thankfully, someone had put in much of the work already, and posted their progress to Github. It was me. Towards the end of 2017. Shortly before our baby was born. It's somewhat embarassing, and reminds me of the rate I was able to get work done pre-sleep-deprivation when my brain was well rested each day. I was able to port the rest of the Arduino driver quickly, and now we (finally!) have a Raspberry Pi driver for the magnetic tile v3. The use of the Python GPIO library limits the framerate to about 100-200fps, but that's more than enough for testing, and should be able to be improved substantially by porting the code to the C GPIO library. The Pi also has the advantage of being able to store extremely long captures, where as the memory in a microcontroller (like on the Chipkit Max32 board I was using to interface with the tile) tends to max out at a few thousand frames, limiting the use cases.
My cobbled-together web serving of the magnetic imaging tile (above) still lacks many of the basic features of the Processing example, and also updates rather slowly, but it's still plenty good for a proof-of-concept. The above image is of a magnetic screwdriver bit (the red pixels) standing on edge on the tile, which is a quick essentially static image for testing.
High-Energy Particle Detector (i.e. Radiation Sensor)
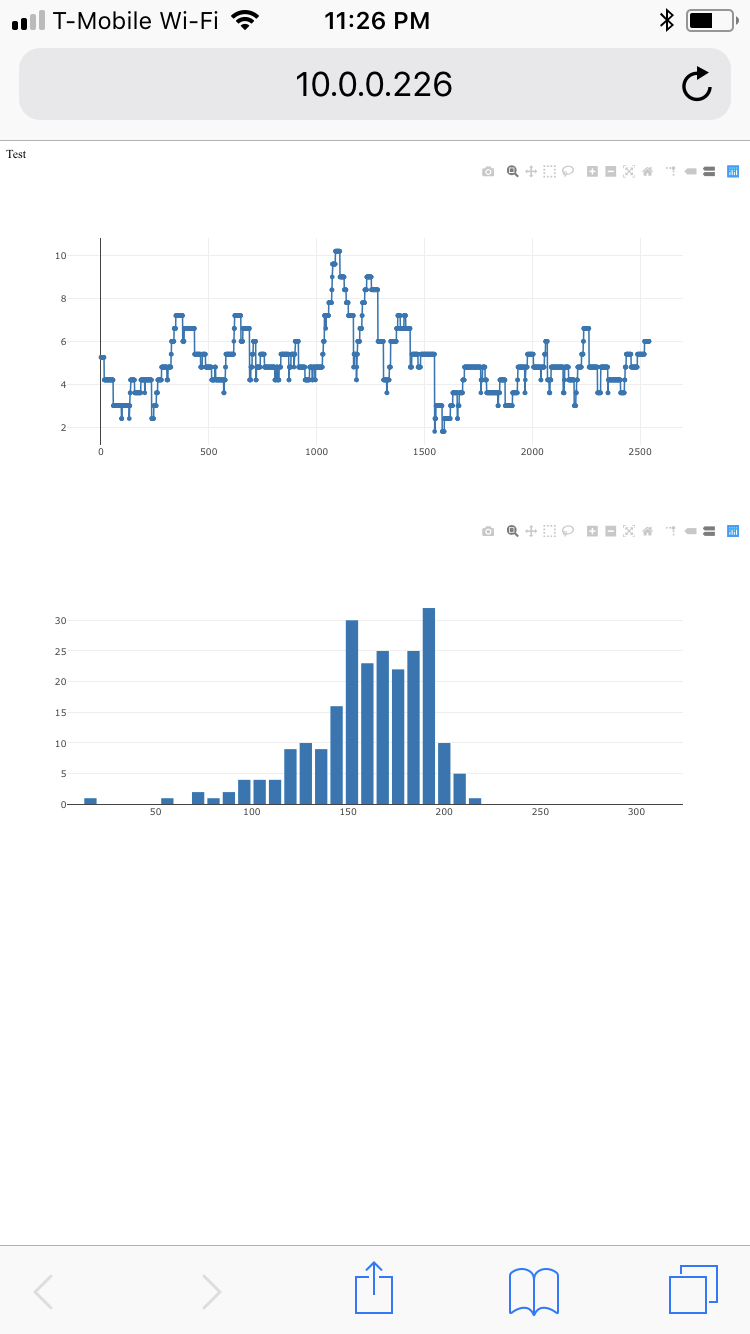
I also put together a quick visualization for the radiation sensor (a Radiation Watch 5 modified with my digital potentiometer backpack), displaying the average counts-per-minute (top), and a histogram of the pulse widths from the detector (bottom). I think that the pulse widths correlate with the energy level of the particles striking the detector -- I previously observed different distributions on the histogram for Cd109, Ba133, and background radiation -- and once observed a large number of counts in the highest bin around the same time there was a lot of solar activity. Unfortunately I don't have the facilities to really characterize this, and I think at best it's a very rough correlation -- ideally one needs to design a more sophisticated detector intended for characterizing energy level.
Above is the result of about 45 minutes of data collection, representing normal background radiation.
Carbon Dioxide (CO2)
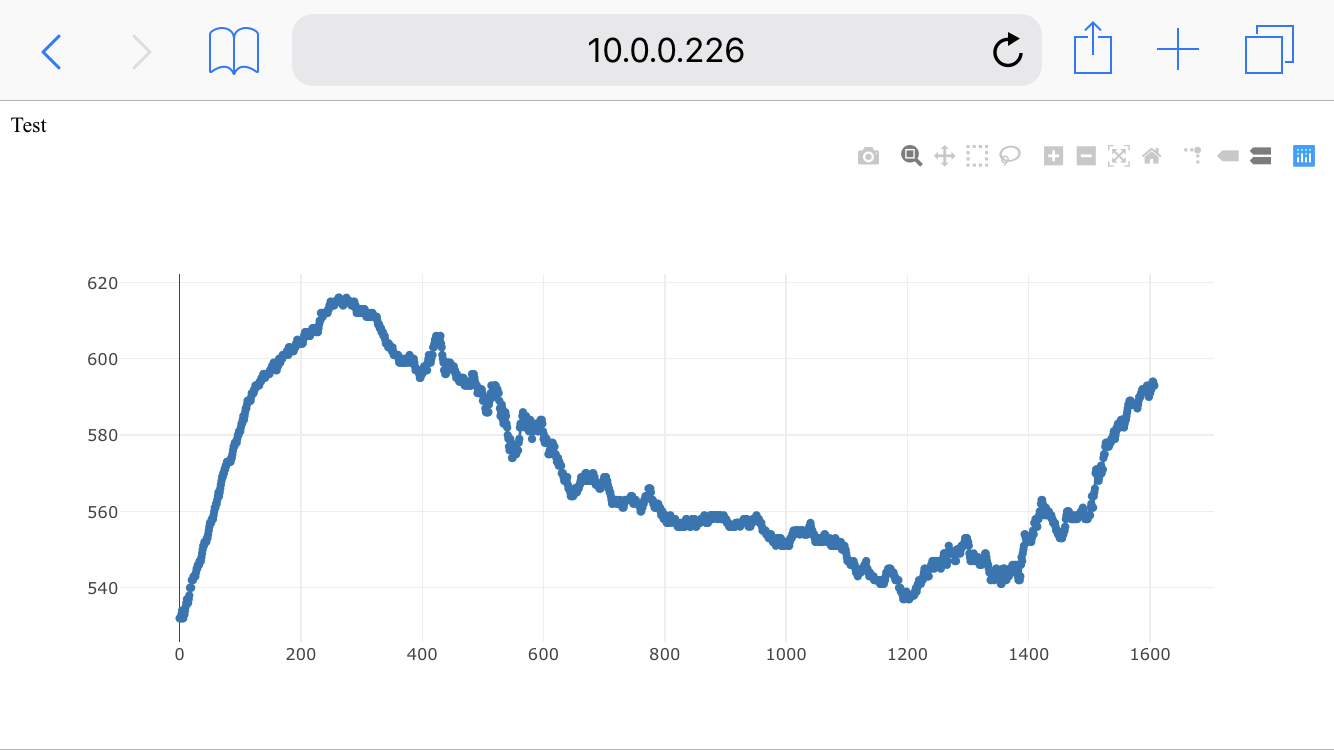
Above is the trace for the CO2 sensor, a Sensiron SCD30 sensor that uses infrared light rather than heaters (like most low-cost gas sensors) as a detection mechanism. Above shows CO2 over about 45 minutes, where I entered the room briefly to turn on the unit to collect data (samples 0-200), left for about 30 minutes (200-1200), and then came back in (1200+). I had no idea that my presence affected the CO2 in the room so much, but I've seen news articles recently mentioning that small, enclosed, poorly-ventilated meeting rooms can increase average indoor CO2 levels as well -- so perhaps this shouldn't be a surprise. Below is a longer capture:
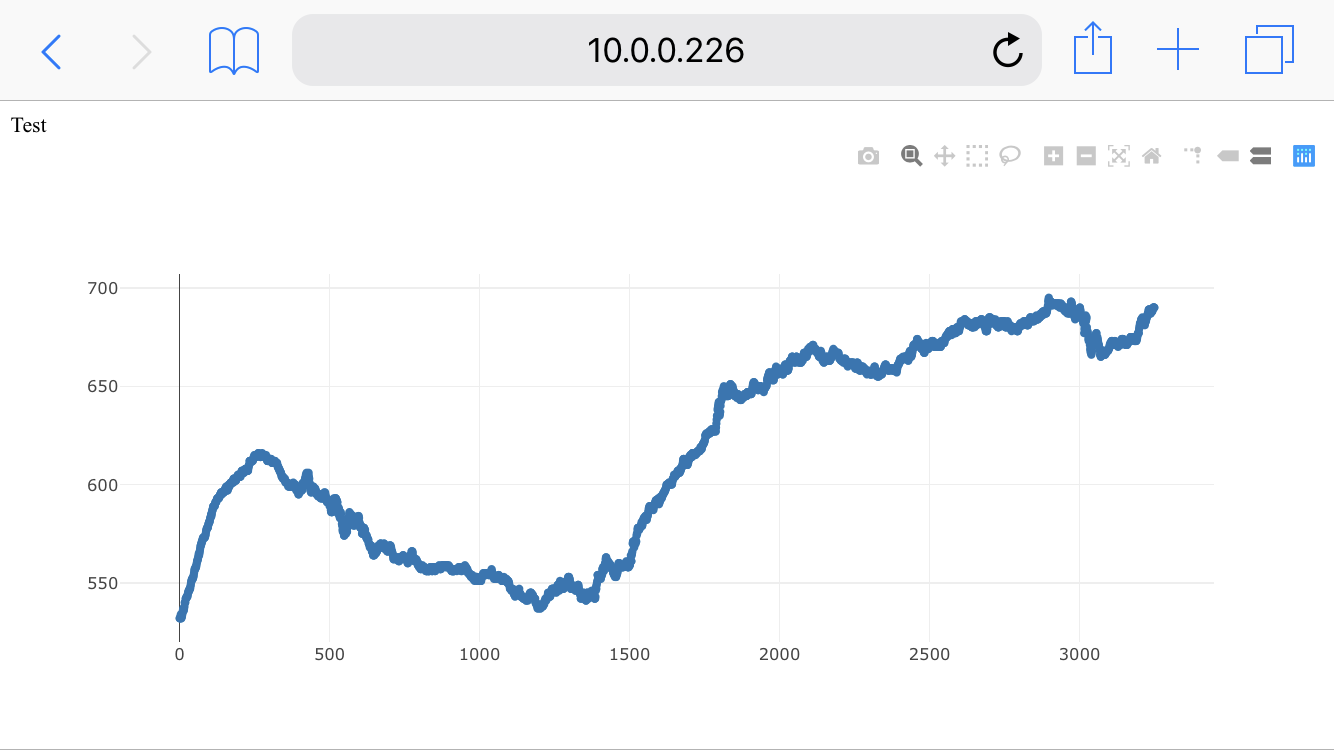
The samples from 1200 onward represent me (and our cat) being in the office for about an hour, with levels starting to reach close to 700ppm, according to the sensor.
Air Particles
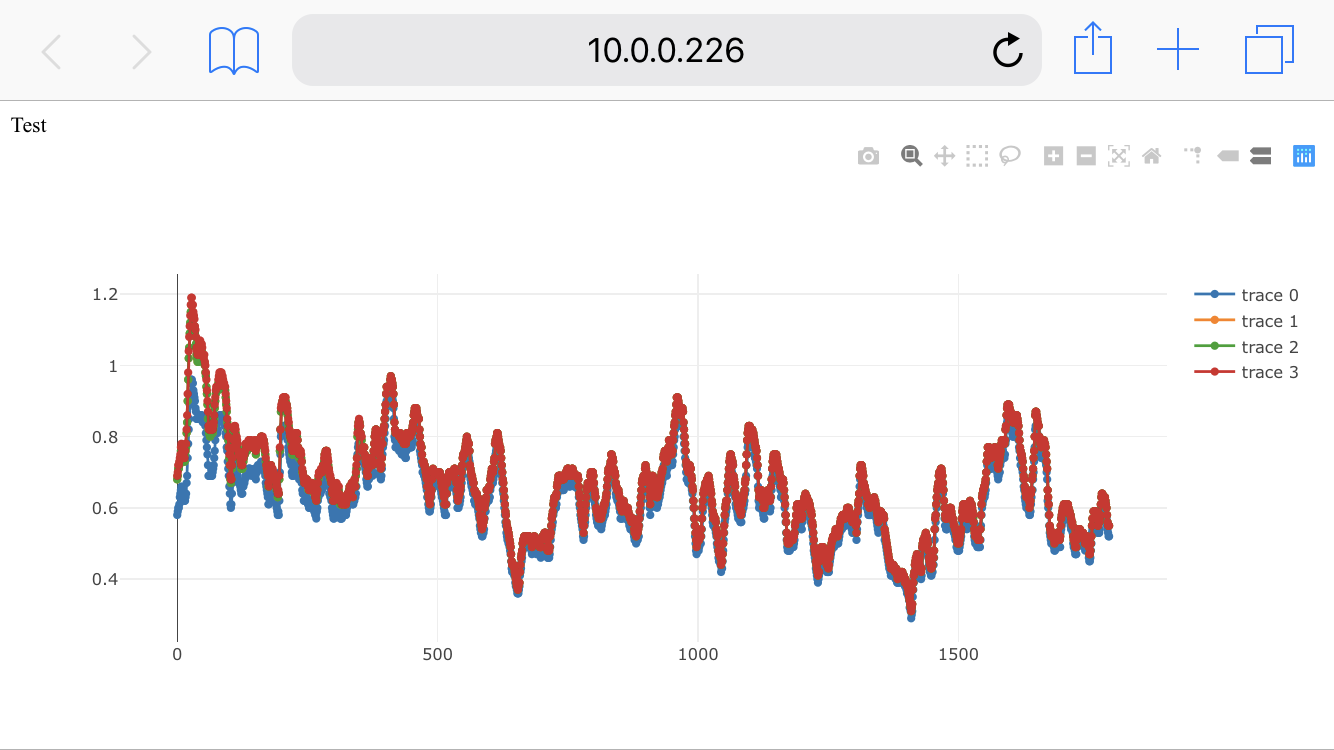
Above are measurements from the 4 channels of the Sensirion SPS30 air particle detector, which optically senses particulate matter in the air in four common bin measurements: PM1.0, PM2.5, PM4.0, and PM10.0 . I was originally using a Plantower A003 air particle sensor together with a custom board that I put together that includes additional atmospheric sensors, but to make Iteration 8 more easily replicable, I've tried to restrict myself to parts that are easily purchased or hand-soldered, and the (somewhat challenging to find) Plantower A003 sensor combined with some very tiny surface mount soldering for the BME280 and CCS811 would make replication much more difficult for most folks. I have a BME680 breakout on it's way, which should hopefully fill in the gap for the functionality of the previous design, but be a lot easier for most folks to source.
One thing I will mention is that it seems to be challenging for me to get the SPS30 to show different readings. With the Plantower sensor, I could put a soldering iron beside it and start to solder, and notice a quick difference. I've repeated that test three times today with the SPS30 and only noticed an increase once, so it's not clear to me what the issue or difference may be. The traces for the different readings also seem to be very close to each other, and it's not clear to me whether that's an issue, or just an artifact of the overall readings being very low.
Next steps
It's been wonderful to finally see some data from the device, and have an end-to-end system working going from sensor to device to phone to visualization (minor bugs/issues notwithstanding). Aside from adding a few more sensors, for which I think the workflow should generally be reasonably straight forward given the work with the above sensors, I'd like to start working on mounting the device to the back of the phone. I designed Iteration 8 to fit on the back of an iPhone, but ultimately figuring out a mounted enclosure of some kind with mount points for all the sensors is non-trivial, and will determine exactly how much space is left over for additional sensors.
Slowly but surely, progress is being made. Thanks for reading!
Discussions
Become a Hackaday.io Member
Create an account to leave a comment. Already have an account? Log In.
Have been following your progress since 2013 and I'm really glad you are still working on this. Do you feel working on this has become easier over the years as more small components have become available? Cheers from the Netherlands. edit: If you ever do create a guide with a model ready for replication I am looking forward to attempting to create one :)
Are you sure? yes | no