 Timo
TimoWorking principle
The sensor consists of a piece of Tin Dioxide (SNO2) which acts as a resistor. If the resistor is in an atmosphere which contains alcohol, molecules diffuse into the resistor and the resistence decreases. If no alcohol is present in the atmoshere, the molecules inside the resistor diffuse to the outside and the resistence increases.
To accelerate this process the resistor is heated. Higher temperatures increase the speed with which the molecules diffuse in and out off the resistor.
As you would expect the reapeatability is medium. Also the manufacturing tolerances and drift are quite high. Because of this the datasheet does not give a dependence of gas concentration to resistence but rather gas concentration vs change of resistence. Also in the datasheet under section "Sensitivity Adjustment" the manufacturer saies at least one point calibration is neccessary.
Cross sensetivity is also quite bad, but will be ignored for now.
Charactreistic Curve
Fig. 1 from the datasheet shows the characteristic curve of the sensor. Rs is the resistence of the sensor depending on the concentration of alcohol in the atmosphere. R0 is the resistence of the sensor at the calibration point. To get R_[0] you have to calibrate the sensor.
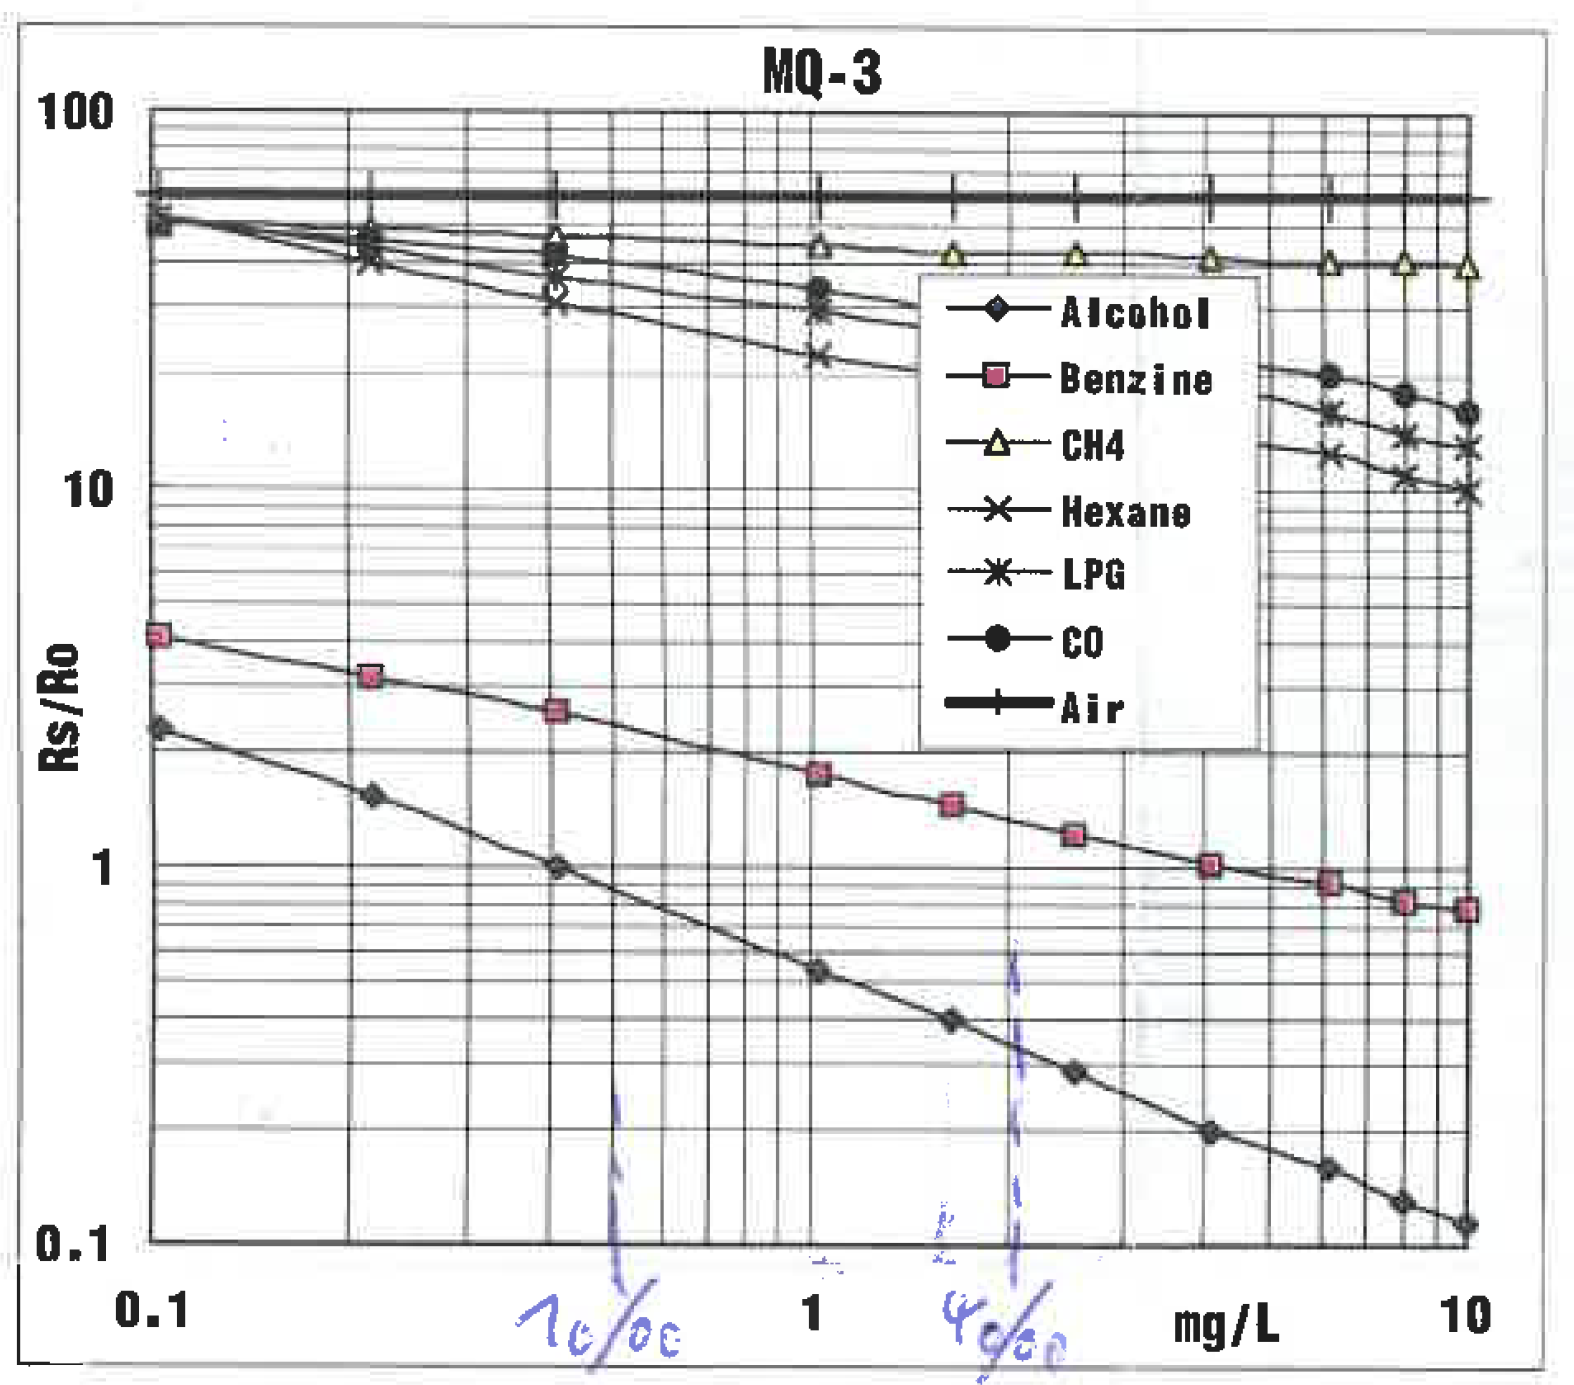
The characteristic curve can be discribed by this equation:
Temperature dependency
As can be seen from the datasheet in Fig. 2, the dependency of the sensor to air temperature and humidity (and god knows what else) is quite bad. Errors between -20% and +60% are possible.
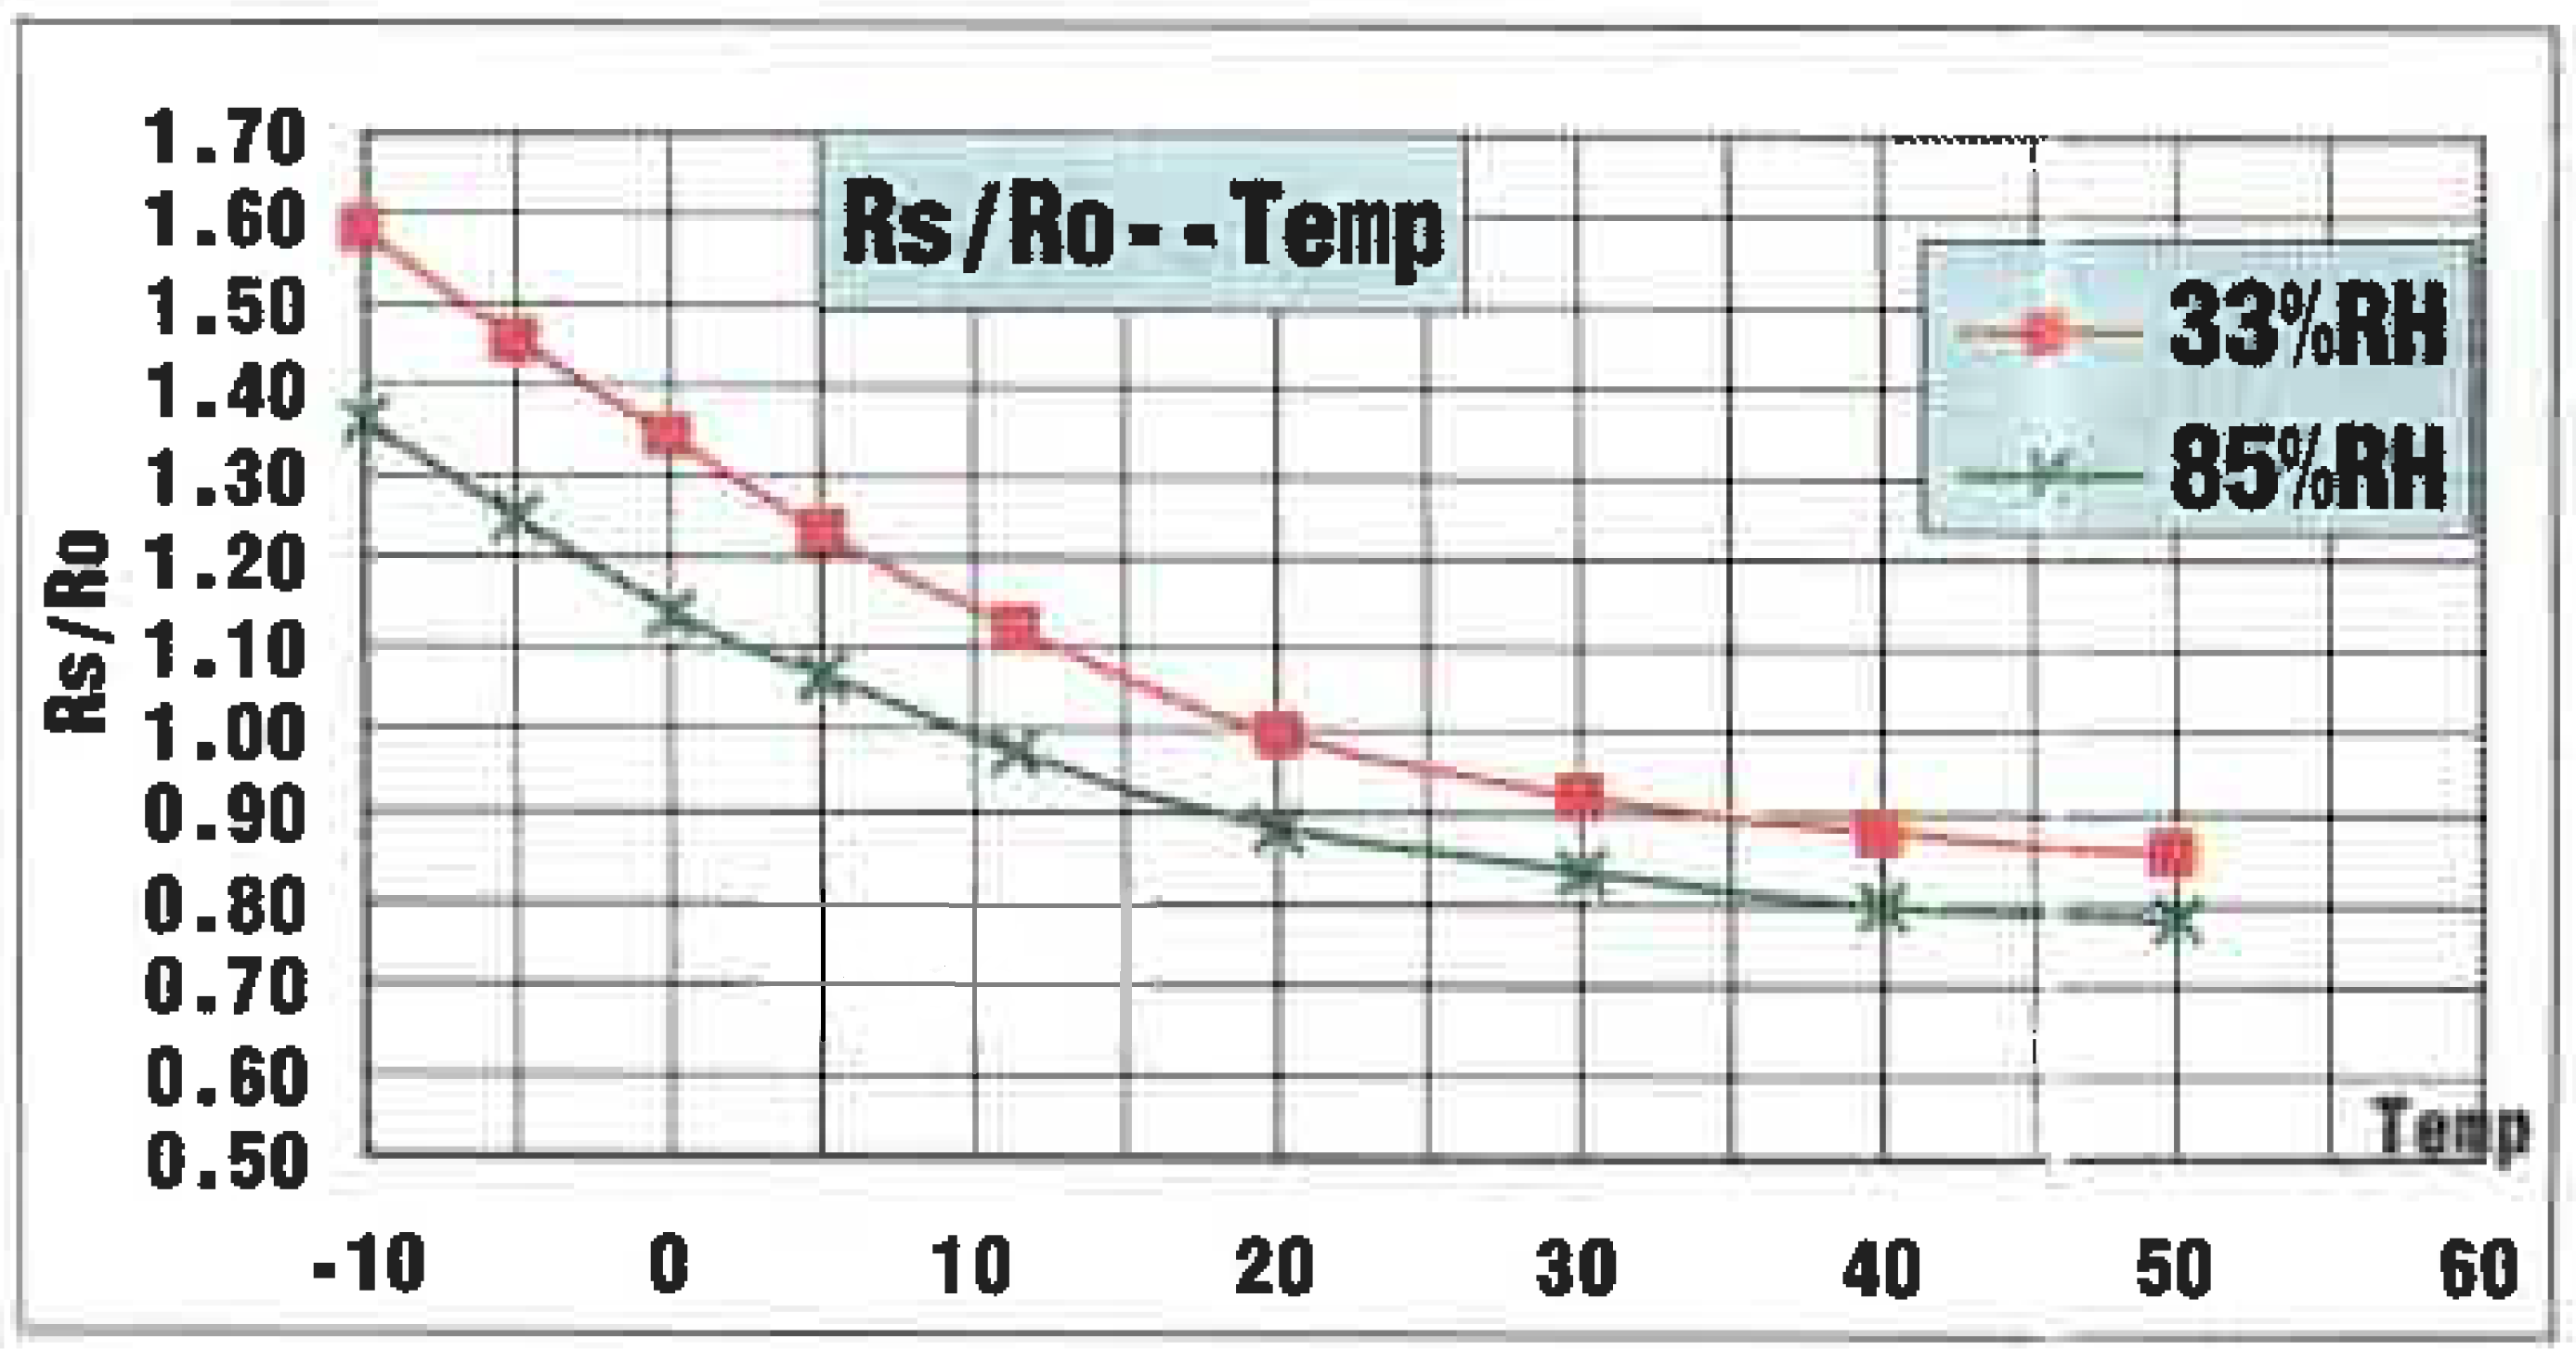
For the moment just focus on the temperature dependency at 33% of relative humidity (RH) in Fig. 2. The graph shows Rs/R0 at a constant concentration of alcohol at different temperatures.
The influence of temperature can be modeled by multiplying the characteristic curve with a temperature dependend factor \beta(T). \beta(T) can be read from Fig. 2. at 33%RH. For example at -10°C \beta(T=-10°C) is roughly 1.6.

The parameters were found by just trying what fits best. Much scientific, very knowledge.
Sensetivity to Humidity
From Fig. 2. the plot in Fig. 3. can be derived. It shows the ratio of Rs/R0 at 33%RH and at 85%RH. With a little bit of fantasy you see that the ratio is nearly constant and therefore is independent of the temperature.
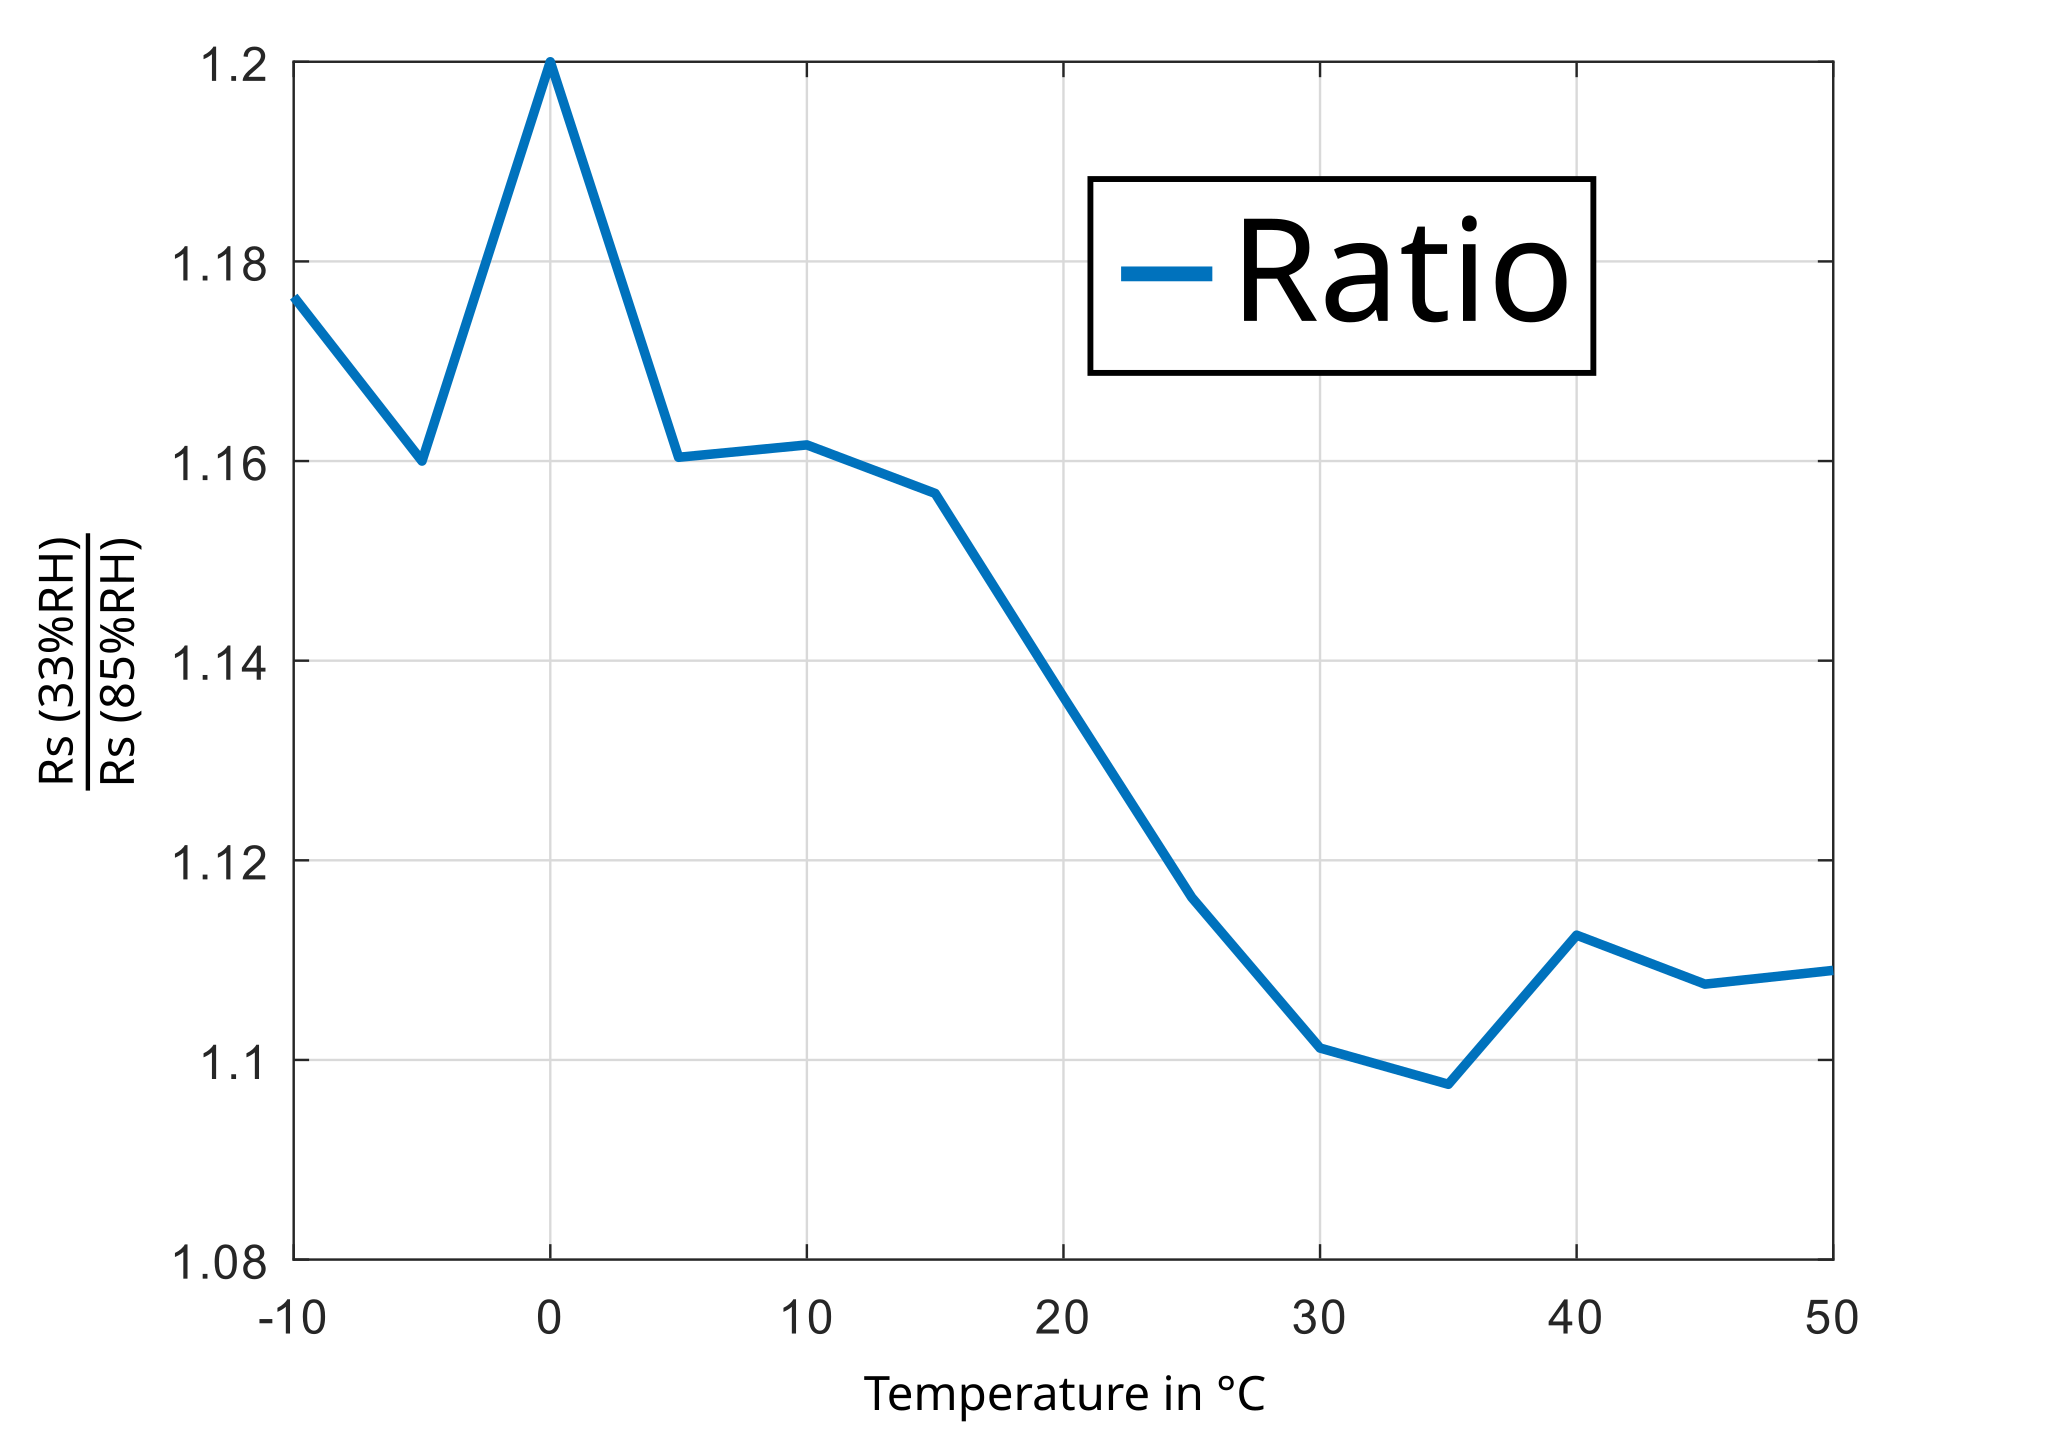
There are only measurement values for two different humidity levels, so i can only assume there is a linear dependency between Rs/R0 and relative humidity. The characteristic curve can be extended like this:

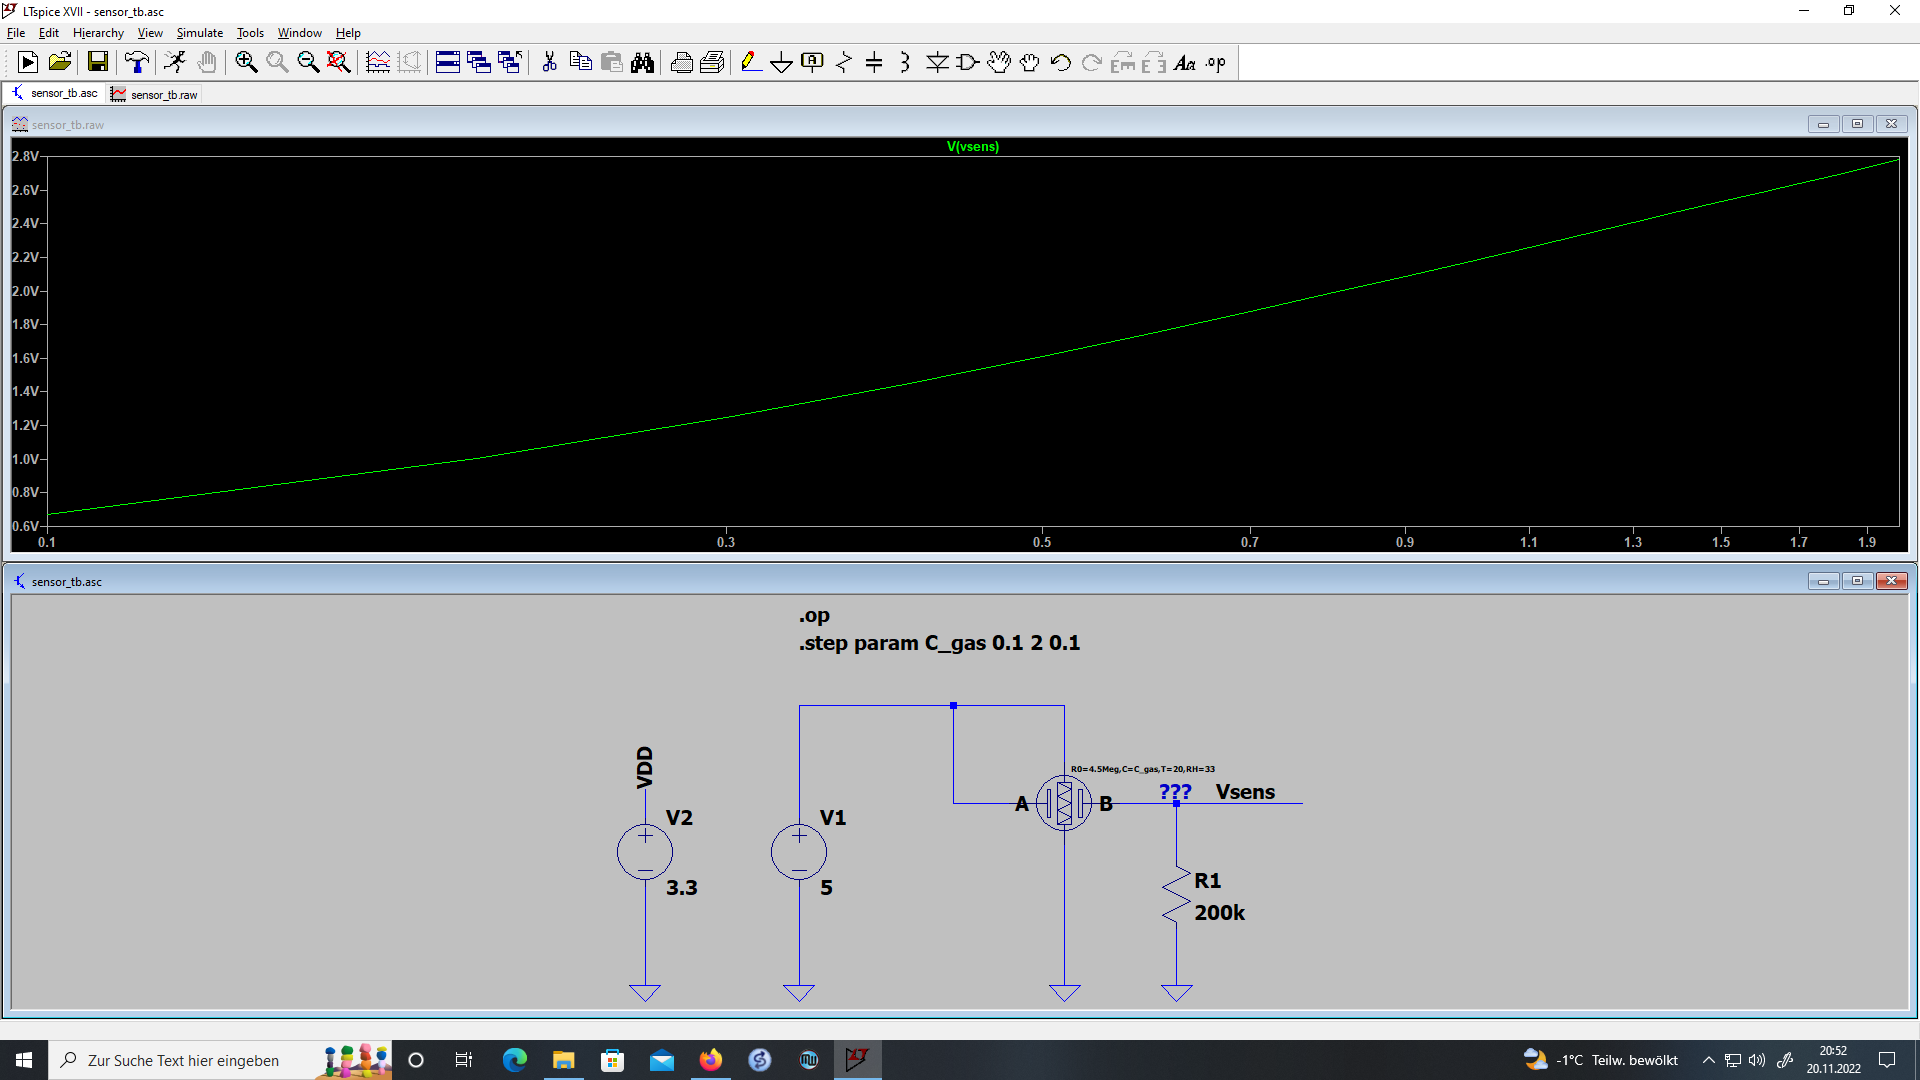
LT Spice Model
The model of the sensor is now complete and a LT Spice model can be generated. The model and an example circuit can be found in the project files. Fig. 4. shows the example application circuit and the output voltage Vsens over concentration.
Sensor and R1 behave like a voltage devider. With that knowledge the sensor resistance can be calculated from Vsens.
Micro Python Library
The Micro Python library only provides the means to calculate the gas concentration from the resistance and correct the measurement for temperature and humidity dependency.
Resistance, temperature and humidity have to be determined by other means, i.e. by the example application circuit in Fig. 4.
An example how to use the library is shown in this Listing:
from mq3 import MQ_3

sensor = MQ_3()
R0 = 4.75*pow(10,6)
C0 = 0.4
sensor.trim(R0, C0)

temperature = 20
humidity = 33
sensor_resistance = 2.375*pow(10,6)

concetration = sensor.get_concentration(sensor_resistance,temperature,humidity)
print("alcohol concentration in the air: " + str(concetration) + "mg/L")
concetration = sensor.get_blood_concentration(sensor_resistance,temperature,humidity)
...
Read more »

 Olivier Godfroid

 Turo Heikkinen
 Piotr Sperka