Context
When I start a project, I like to do a first quick iteration to estimate if my idea have potential to succeed. The goal of this first iteration is not to go too deep in the detail of the implementation, but more to estimate the potential and feasibility of the project. For this first version, I designed a first proof of concept and tested it with a road test.
Methodology
Material
- Arduino nano
- 10 DOF IMU (WAVE-100)
- Custom build mount (see hardware mount section below)
- Cellphone for GPS data tracking (using geo tracker application)
Note: I went with a cheap IMU here to reproduce what is mostly available in common massively available device. I know there much better device out there specialize in vibration measurement.
Electronic / software
The WAVE-100 is communicating with the arduino Nano using I2C protocol. The connection diagram is presented below:
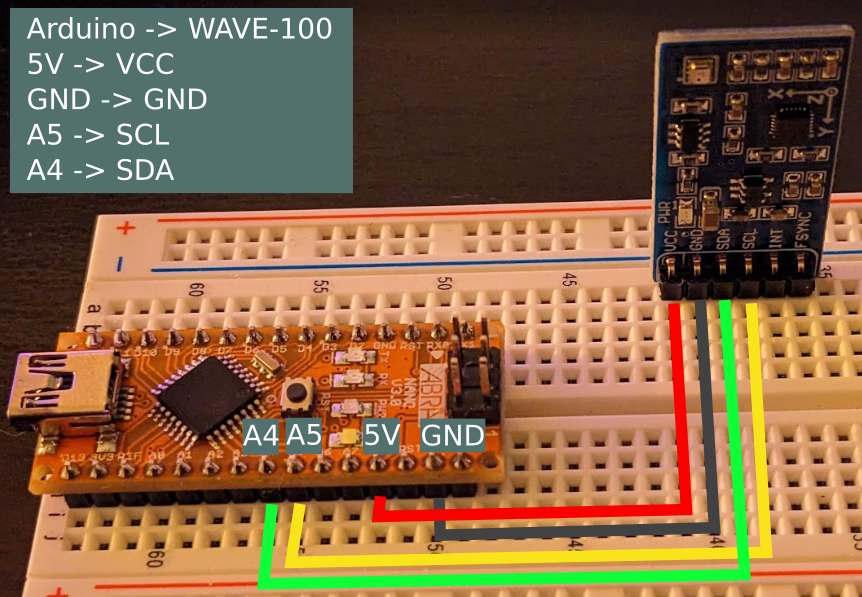
I used one of the examples of an open-source library to log the data out of the IMU sensor using Arduino. Then I use putty to log the serial data from port /dev/ttyUSB0 into a text file. Each set of IMU data is timestamped with millisecond accuracy. For now the IMU data are log at 10Hz (quite low).
Hardware mount
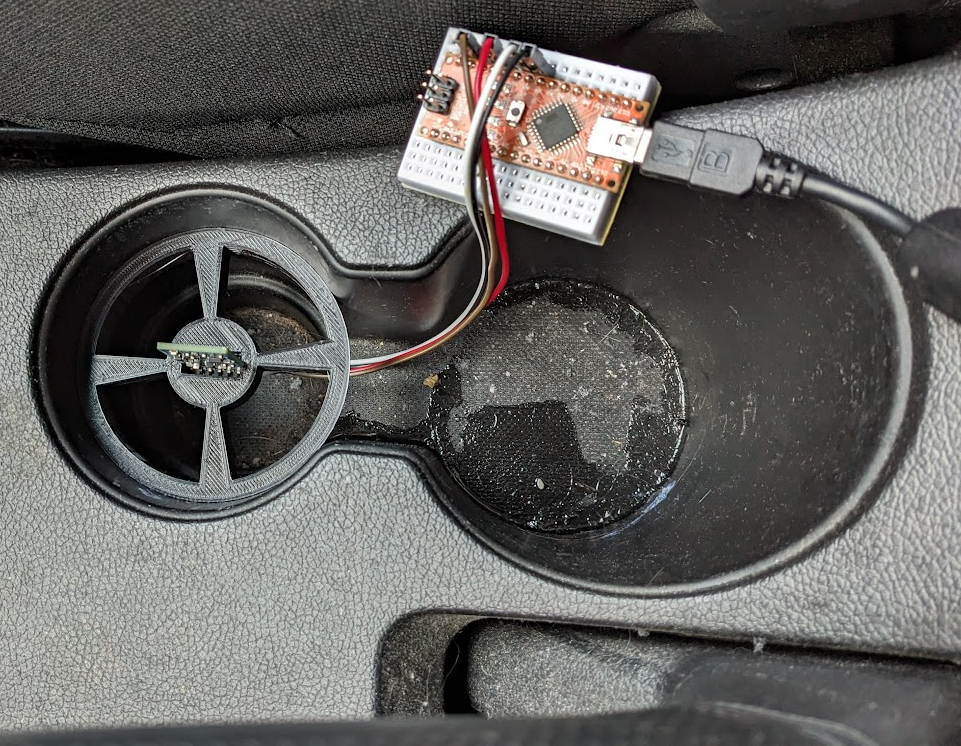
To be able to get reliable measurements of the accelerator inside the car, the sensor must be fixed still inside the vehicle. I designed a mount that could fit in the cup holder using Freecad and print it with my creality ender v2. The mount is designed such that the y axis of the accelerator sensor is pointing down..
Data processing
Time alignment
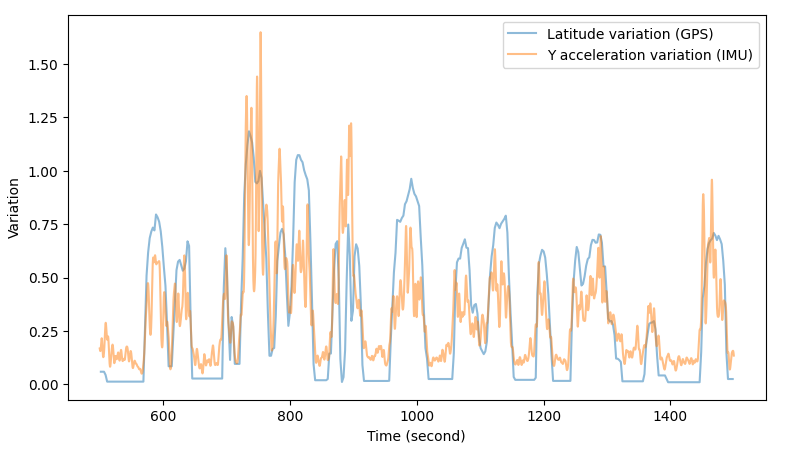
One of the first step was to align the IMU and GPS on the same time axis. The GPS timestamps are provided by the GPS itself. The IMU data are simply a clock increment to millisecond precision from the start of recording of IMU data. For this first proof of concept, I simply found the offset between the GPS and IMU manually based on the principle that GPS and IMU data are not changing when the vehicle is at a stop.
Vibration metric
These are the steps of the post process that were applied to the raw acceleration data to retrieve a metric to estimate road quality.
- Differential of y axis acceleration
- Scale the result to the power of n>1
- This will increase the contrast between low and high vibration
- Then we can applied a threshold to scale down all the lower vibration
- There are a lot of vibration inside a car and we only want to isolate the vibration that stand out from the others.
- Scale back up the result to a power of m<1
Result
The map below is showing the processed acceleration data overlay on top of the GPS data. Green colour showing part of the road where the road quality metric was good and red the part were it was particularly bad.
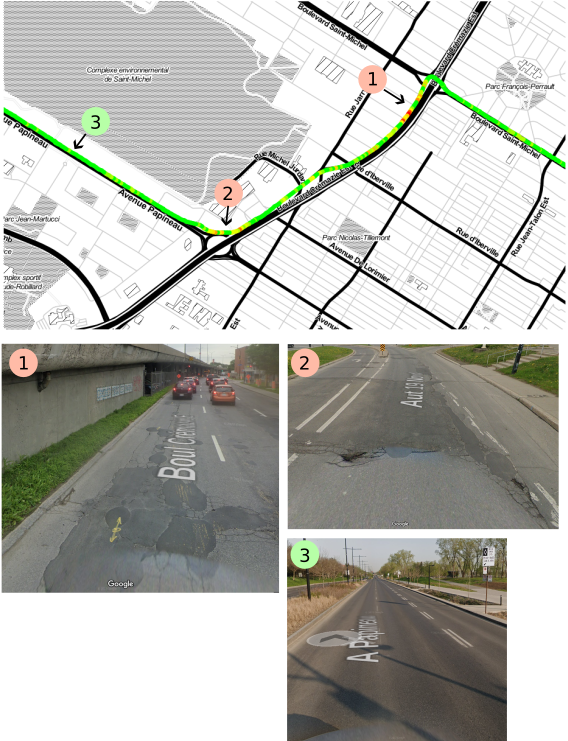
During the ride, I identified two main areas where the road was particularly bad (1, 2) and one area where the road was good (3). As depicted in the above figure, the metric was able to identify those with the right metric value.
Next step
- I will share the CAD, process file and raw data on Github (ETA: 15 March 2023)
- Improve process of data
- My next iteration of the electronic module is ready (I am planning testing on the road in March)
- Better acquisition rate > 200Hz
- Standalone electronic module
- GPS integrated
![]()
Discussions
Become a Hackaday.io Member
Create an account to leave a comment. Already have an account? Log In.