Features
- The overview page allows you to visualize the current values of various environmental data, such as current temperature, humidity, PM 2.5 and CO2 concentration.
- Switch between pages with left and right touch button.
- Historical trend data for each data item, by recording the last 12 hours of data and showing the trend of environmental data in a graph.
- Detailed data of specific sensors, for example, Pantone PMS5003 can detect PM 1.0, PM 2.5 and PM 10 at the same time, which cannot be fully displayed in the overview page, so it can be displayed in the details page.
- The device information interface can display basic information such as the name of current device, Wi-Fi connection, operation time, etc.
- Data reporting capability, you can report data to Domoticz or Home Assistant via MQTT.
- Batch deployment capability, deploy device firmware in batch by script.
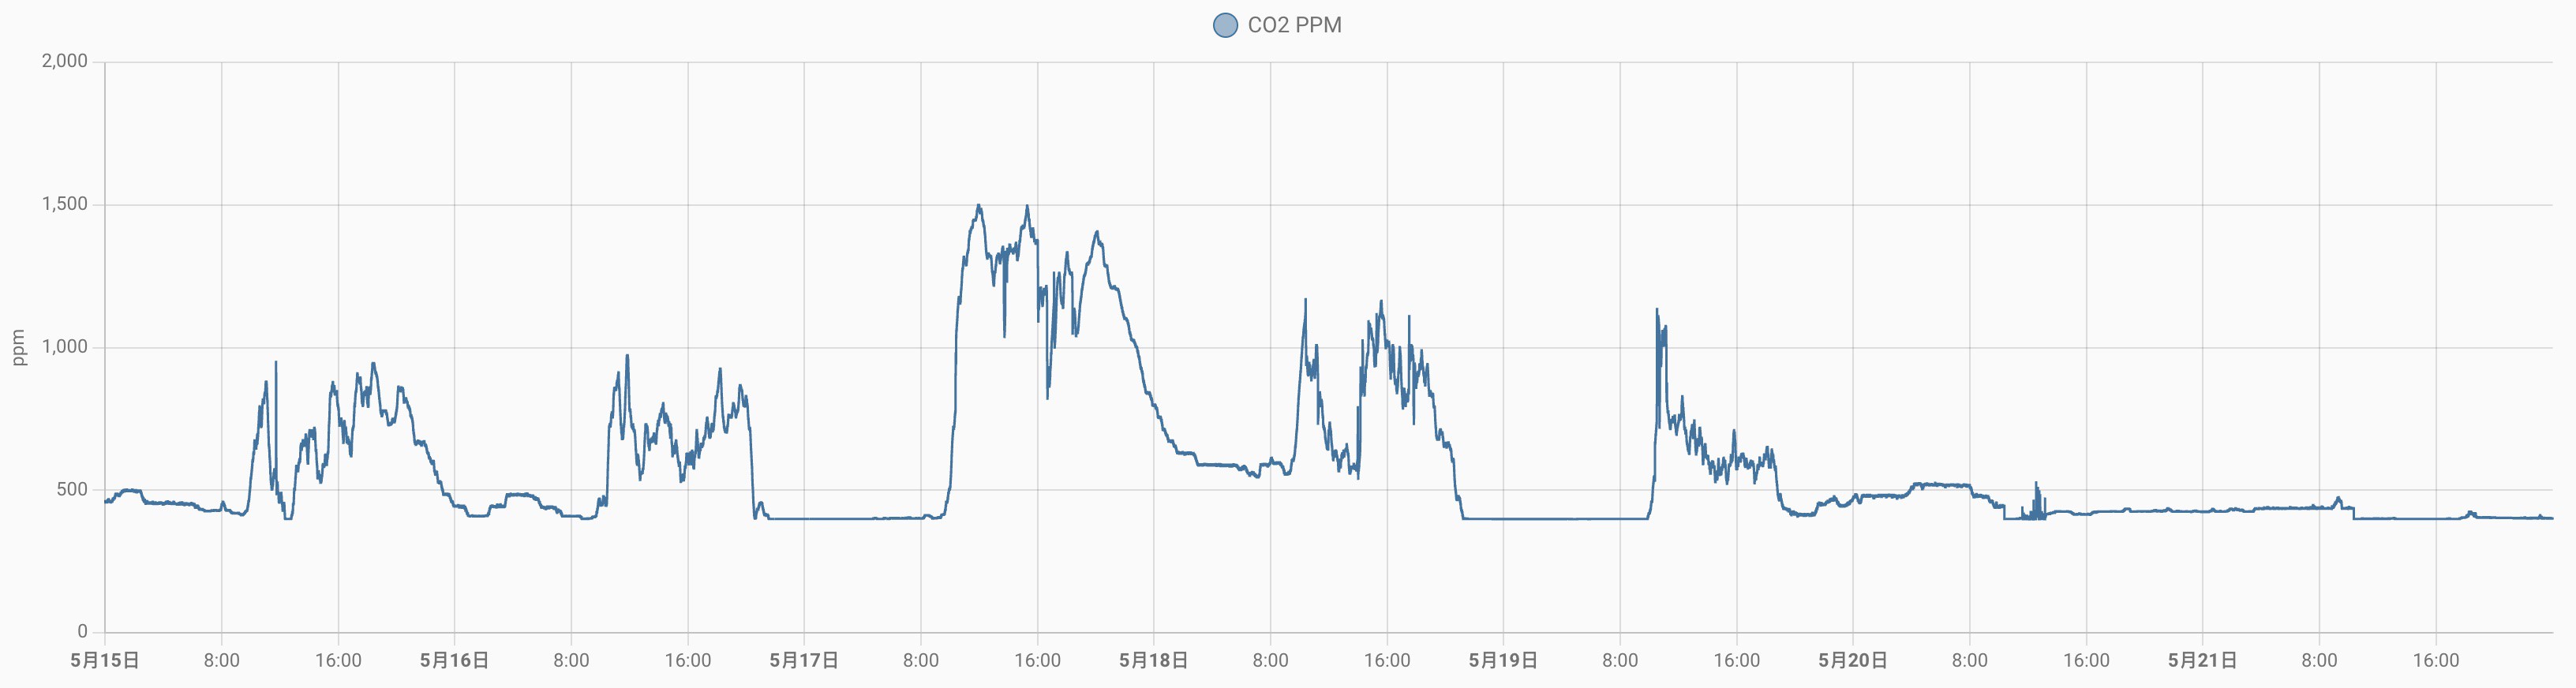
Home Assistant Graph
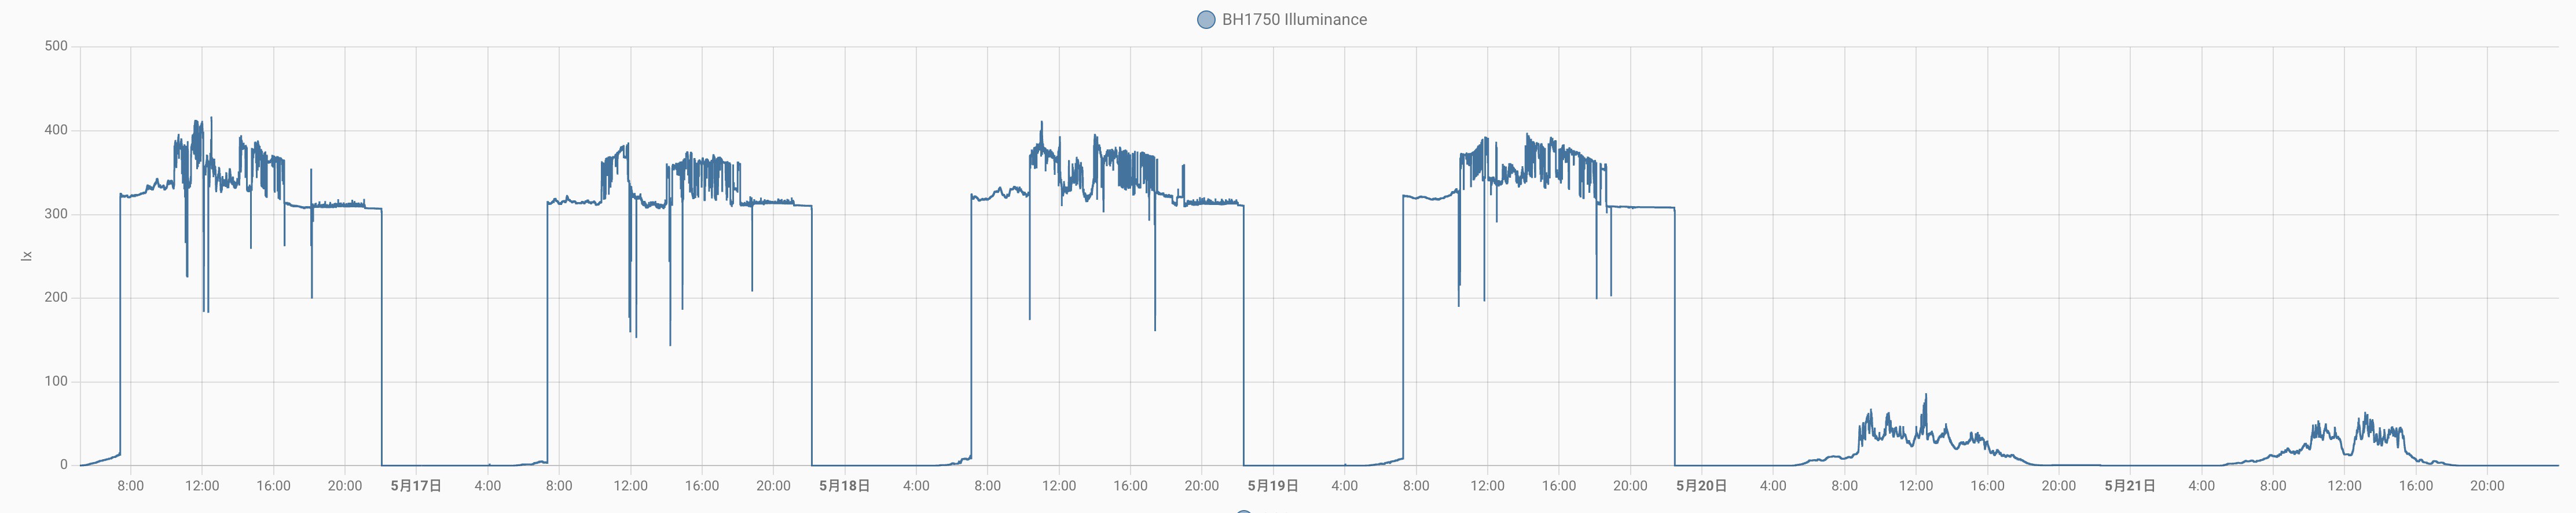 Lux Graph
Files for Manufacturing
Get PCB Gerber file from GitHub repository: https://github.com/ohdarling/AirCube
There is also a list of sensor modules and screen modules.

 Dmitry Slepov
 Marcus Berg
 ssla-couk
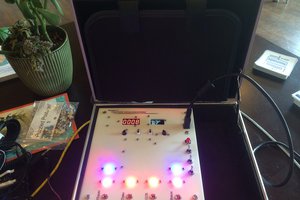
 Jacob Sayles