 zpekic
Operation
Visibility into what is exactly going on inside the target machine is crucial for debugging and development. There are few ways to accomplish this:
- give a host a real-time access into target system (e.g. dual port memory)
- host can access target system to take a "snapshot" as needed (e.g. DMA access)
- host can infer state of target system by "spying" on each memory or I/O access
If the tracer is configured to trace each memory access and/or I/O access, given that the trace goes to host, it is possible to store the address and value of such access and as the execution is ongoing create an accurate map of the memory.
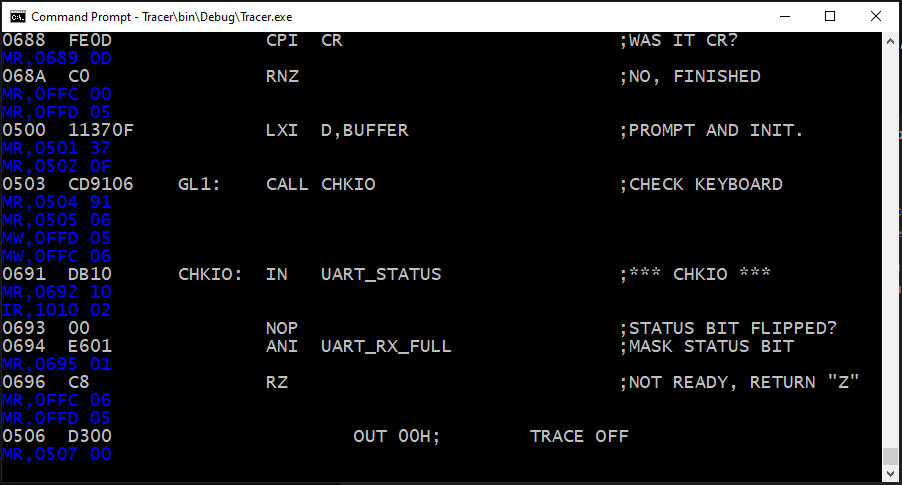
In the trace above it is easy to see that memory content of 0x0503 is 0xCD (and it is instruction), and 0x0501 is data memory, content 0x37. Also port 0x10 has value of 0x02 etc.
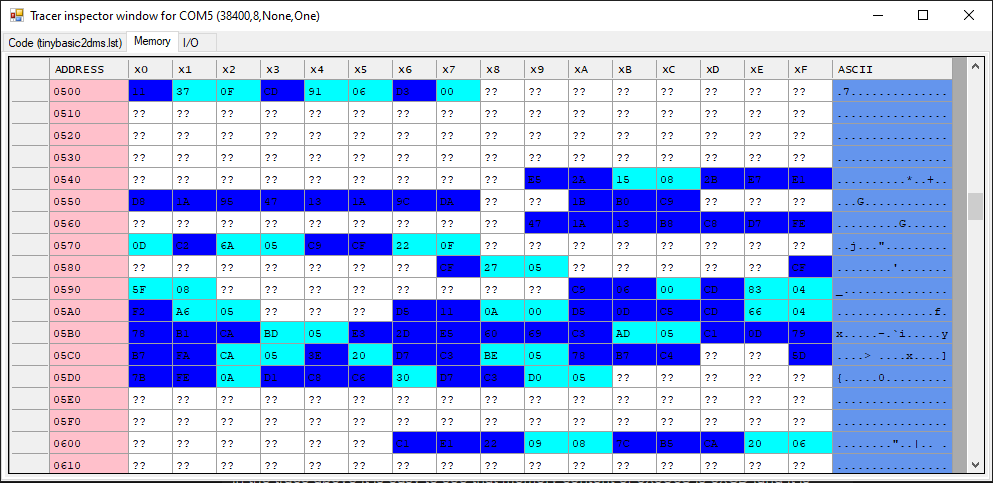
Mapped onto memory grid which has been added to tracer:
And I/O:
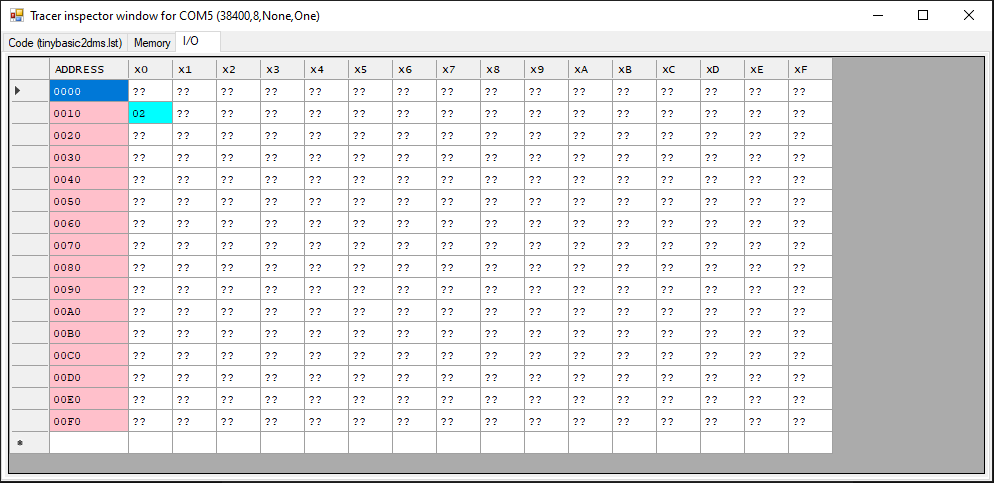
In this sample session, it is easy to observe how and where a Tiny Basic program is stored in the memory, and how it gets there from input buffer when the input line is terminated (Enter key)
Implementation
There are 3 components that allow the run-time visualization to work:
"debugtracer" component embedded in target device - as described in the other project log, the logic in this component is comparing the state of control signals (M1, /IORD, /IOWR, /MEMRD, /MEMWR) at each CPU clock with the state of 5-bit internal register reg_sel. If any match, this will flip the READY signal low, "freezing" the CPU in the current cycle (actually due to a bug in my design this is done by stopping the clock signal, which would not be possible in read device because 8080-family processors were not static (few were at the time, except the CDP 1802 unique in that regard too).
reg_sel can be loaded from 5 on/off switches on the FPGA baseboard, but this is done when the "load" signal (connected to push button) is asserted. This way one trace configuration can be running while the other is being prepared. With reg_sel cleared, CPU runs at full speed, without traces being sent out.
UART sender - a simple 16-to-1 MUX sends out the ASCII character assembled from data on the bus and template that depends on actual CPU cycle. The operation is as follows:
- match is detected, CPU is stopped, bus is stable and not changin
- a 12 character record is output to UART. A simple 8-bit counter clocked by txd_clk (e.g. 38400 or 57600 Hz). Lower 4-bits drive the UART 16-to-1 MUX and upper 4 bits the character selection.
signal counter: std_logic_vector(7 downto 0);
alias chrSel: std_logic_vector(3 downto 0) is counter(7 downto 4);
alias bitSel: std_logic_vector(3 downto 0) is counter(3 downto 0);- 13th character (chrSel == 0xC) is "null" ASCII (0x00) - this resets the sender circuit and also resets the ready signal. debugtracer is now ready to "catch" the next bus cycle match.
Note that the UART is one way only from target device to host, and is completely different serial channel from the bidirectional UART that allows interaction with Basic on the single board microcomputer.
Tracer utility running on the host - The code for this C# utility is here. Let's say that the record received is:
MR,0761 ED<cr><lf>
Upon assembling the record incoming on serial port the record descriptor (memory read == MR) will be detected:
                        case "MR":  // read memory (except M1)
                            if (CheckRecipientAndRecord(memoryMap, recordValue.Split(' '), out address, out data))
                            {
                                CheckLimit(memoryMap.UpdateRead(address, data, ref pause), traceRecord);
                            }
                            Console.ForegroundColor = ConsoleColor.Blue;    // BLUE for not implemented trace record type
                            Console.WriteLine(traceRecord);
                            break;
If the address and data look valid, check limit will validate if the address is within displayable range (64k for memory, 256 for I/O, although restricted in this case to 4k because the SBC has 2k ROM and 2k RAM). Then the memoryMap will be updated to hold the record of read operation:
        public bool UpdateRead(int address, byte data, ref bool pause)
        {
            if (address < this.Size)
            {
                if (fetchDictionary.ContainsKey(address))
                {
                    ReportMemoryIssue(false, $"Reading (not executing) code at {address:X4}");
                    fetchDictionary.Remove(address);
                }
                if (writeDictionary.ContainsKey(address))
                {
                    if (data != writeDictionary[address])
                    {
                        ReportMemoryIssue(false, $"Reading {data:X2} from {address:X4}, expected {writeDictionary[address]:X2}");
                        pause = true;
                    }
                    writeDictionary.Remove(address);
                }
                AddOrUpdateEntry(readDictionary, address, data, 'R');
                return true;
            }
            return false;
        }
Interesting system memory consistency checks can be now done:
- if previously instruction fetch came from same location, probably there is runaway execution into non-program memory, and terrible things will happen soon
- if previously memory write to same location wrote different byte value, possibly the memory is corrupted, or hardware is malfunctioning
Receiving characters from target device is done in a event handler which triggers at any COM5 port character. In the meantime, the main loop of the program is checking the keyboard:
            while (!exit)
            {
                key = Console.ReadKey();
                switch (key.KeyChar)
                {
                    // TODO: clear instruction counter on some key
                    case ' ':
                        comPort.RtsEnable = !comPort.RtsEnable;
                        break;
                    case 'c':
                    case 'C':
                    case 'm':
                    case 'M':
                    case 'i':
                    case 'I':
                        if (inspector == null)
                        {
                            inspector = new InspectorForm(sourceFileName, $"Tracer inspector window for {comInfo}", memoryMap, ioMap);

                            System.Threading.Thread formShower = new System.Threading.Thread(ShowForm);
                            formShower.Start(inspector);
                        }
                        else
                        {
                            inspector.BringToFront();
                        }
                        inspector.SelectTab(key.KeyChar);
                        break;
                    case 'x':
                    case 'X':
                        // leave it in enabled state
                        exit = true;
                        comPort.RtsEnable = true;
                        GenerateProfilerReport();
                        break;
                    default:
                        break;
                }
            }
Pressing c (code), i (I/O), m (memory) will bring up the InspectorForm, and switch to the desired tab.
InspectorForm is a windows form window, which has 3 tabs, 1st contains a read-only text box to display the loaded .lst file content, 2nd contains a DataGridView to display memory, and 3rd one DataGridView for I/O:
        internal InspectorForm(string codeFile, string caption, StoreMap<StoreMapRow> memoryMap, StoreMap<StoreMapRow> ioMap)
        {
            InitializeComponent();

            this.Load += new EventHandler(InspectorForm_Load);
            this.Text = caption;
            this.tabPageMem.Controls.Add(dataGridView1);
            this.tabPageIO.Controls.Add(dataGridView2);
            this.codeFile = codeFile;
            this.memoryMap = memoryMap;
            this.ioMap = ioMap;
        }
While the 1st tab with the .lst file text box can be initialized right away and never changes again, the DataGridViews need to respond to any changes in the underlying StoreMap objects , therefore they subscribe to events generated by memory / IO store to refresh the display.
        private void InspectorForm_Load(object sender, EventArgs e)
        {
            // 1st tab contains code text
            if (!string.IsNullOrEmpty(codeFile))
            {
                string fileNameAndExtension = codeFile.Substring(codeFile.LastIndexOf("\\") + 1);

                textBox1.Text = File.ReadAllText(codeFile);
                textBox1.Font = new Font(FontFamily.GenericMonospace, 12.0f, FontStyle.Regular);
                tabControl1.TabPages["tabPageCode"].Text = $"Code ({fileNameAndExtension})";
            }

            // 2nd tab contains Memory data grid
            InitGridView(this.dataGridView1, memoryMap);
            // Connect the virtual-mode events to event handlers.
            this.dataGridView1.CellValueNeeded += new DataGridViewCellValueEventHandler(dataGridView1_CellValueNeeded);
            this.dataGridView1.NewRowNeeded += new DataGridViewRowEventHandler(dataGridView1_NewRowNeeded);
            this.dataGridView1.RowDirtyStateNeeded += new QuestionEventHandler(dataGridView1_RowDirtyStateNeeded);
            // subscribe to store map changes!
            this.memoryMap.StoreUpdatedEvent += MemoryMap_StoreUpdatedEvent;

            // 3rd tab contains IO data grid
            InitGridView(this.dataGridView2, ioMap);
            // Connect the virtual-mode events to event handlers.
            this.dataGridView2.CellValueNeeded += new DataGridViewCellValueEventHandler(dataGridView2_CellValueNeeded);
            this.dataGridView2.NewRowNeeded += new DataGridViewRowEventHandler(dataGridView2_NewRowNeeded);
            this.dataGridView2.RowDirtyStateNeeded += new QuestionEventHandler(dataGridView2_RowDirtyStateNeeded);
            // subscribe to store map changes!
            this.ioMap.StoreUpdatedEvent += IoMap_StoreUpdatedEvent;
        }
Discussions
Become a Hackaday.io Member
Create an account to leave a comment. Already have an account? Log In.