Story
I created this project a couple of years back, just as an exercise as part of learning Op Amp. I was following this playlist about Op Amps by a youtube channel called "All about Electronics". Having just finished video about Op Amp as a differential amplifier, I looked at what analog components I had :
- Couple of LM358 and IC741 Op Amps
- An ADXL335 analog output accelerometer (kind of a luxury when most of the accelerometers are digital output)
- 12V RGB LED
- Lots of resistors.
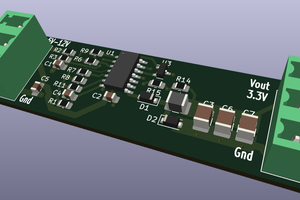
It sparked an idea if Op Amp can be used to drive RGB led based on change in orientation of accelerometer.
ADXL335 output waveform
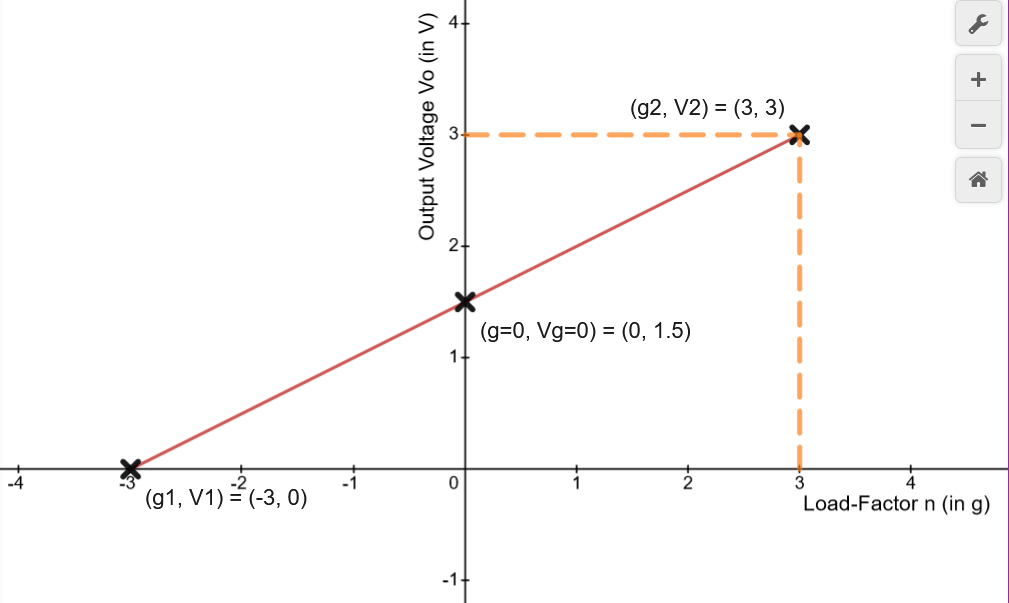
Referring to datasheet for ADXL335, the sensor measures full-scale range of ±3g, with output voltage level of 0V to 3V. That means -3g of acceleration about given axis will give output voltage of 0V about that axis. similarly, for +3g will give 3V, 0g will give 1.5V.
You can refer the characteristics graphs in datasheet.
Linear Approximation Of Accelerometer Output (for given axis)
Just for the sake of simplicity, I quickly derived following linear equation for output voltage vs load-factor (acceleration in g), based on 0 to 3V output for -3g to +3g load-factor. This is just an approximation and will differ from the actual accelerometer output.
Actual Measurements
Based on above equation, when accelerometer is placed in level plane, with x and y axes located in horizontal plane and z axis in vertical upward direction, then
- the acceleration (in m/s/s) about these axes (Ax, Ay, Az) = (0, 0, +9.8)
- hence the load-factor (in g) (nx, ny, nz) = (0, 0, +1)
- the values of output voltages (in V) (Vx, Vy, Vz) = (+1.50, +1.50, +2.00)
But the actual values for horizontal plane measured using a Digital Multi Meter (DMM) were (Vx, Vy, Vz) = (+1.74, +1.74, +2.05) V, so there a bias (offset) of approximately +0.25 V about both X and Y axes (with respect to our linear approximation model).
Also, I tilted the accelerometer module along both x and y axes for a moderately large angle on both sides and voltages about both these axes were in range of +1.55V to +1.95V, symmetric around the horizontal position (+1.74 V).
So, we will design our circuit keeping in mind that accelerometer voltage output about x and y axes will be somewhat in the range of +1.75 ± 0.20V (or +1.75 ± 0.30V for larger tilt angles)
Simulation
I decided to design a circuit, with following particulars :
- power supply +12V/0V
- X and Y axes voltage outputs from accelerometers should be amplified and used to drive the blue and green channels of RGB LED.
- Since LM358 is not a rail-to-rail output op-amp, the amplified voltage will be somewhat in range of +1.5V to +10.5V (assuming 1.5V gap). So gain of op-amp (as differential amplifier) should be such that the clipping does not happen for input voltage range of +1.75 ± 0.30V as per measured in previous section.
- Indeed, it would be best to stay marginally away from clipping, because LED channels may not lit up at all for lower voltage (1.5V) and at very higher voltage a given channel may become so bright that other two channels become almost very dim, resulting in monochromatic light (One of R, G or B).
Z axis voltage output from accelerometer will not be used to drive red channel of RGB LED, but instead simply drive the red channel using a Potentiometer.
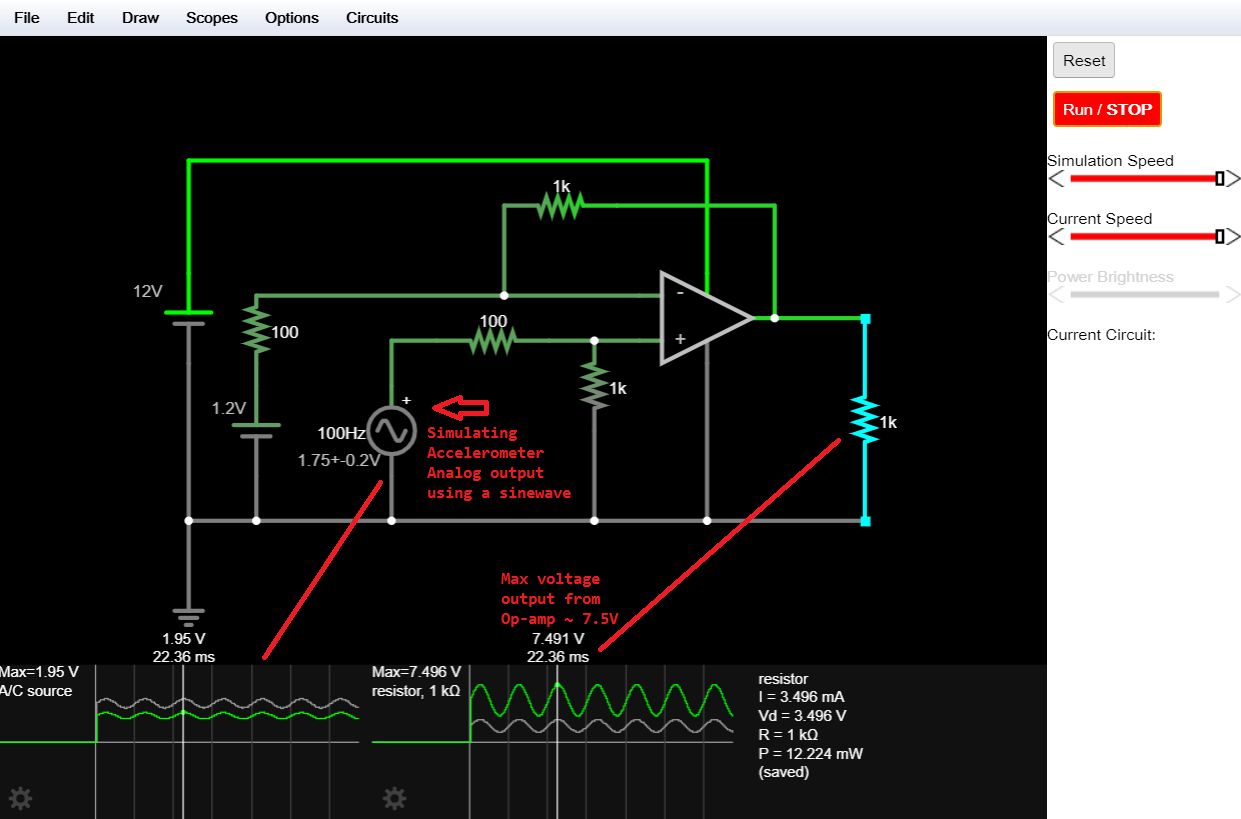
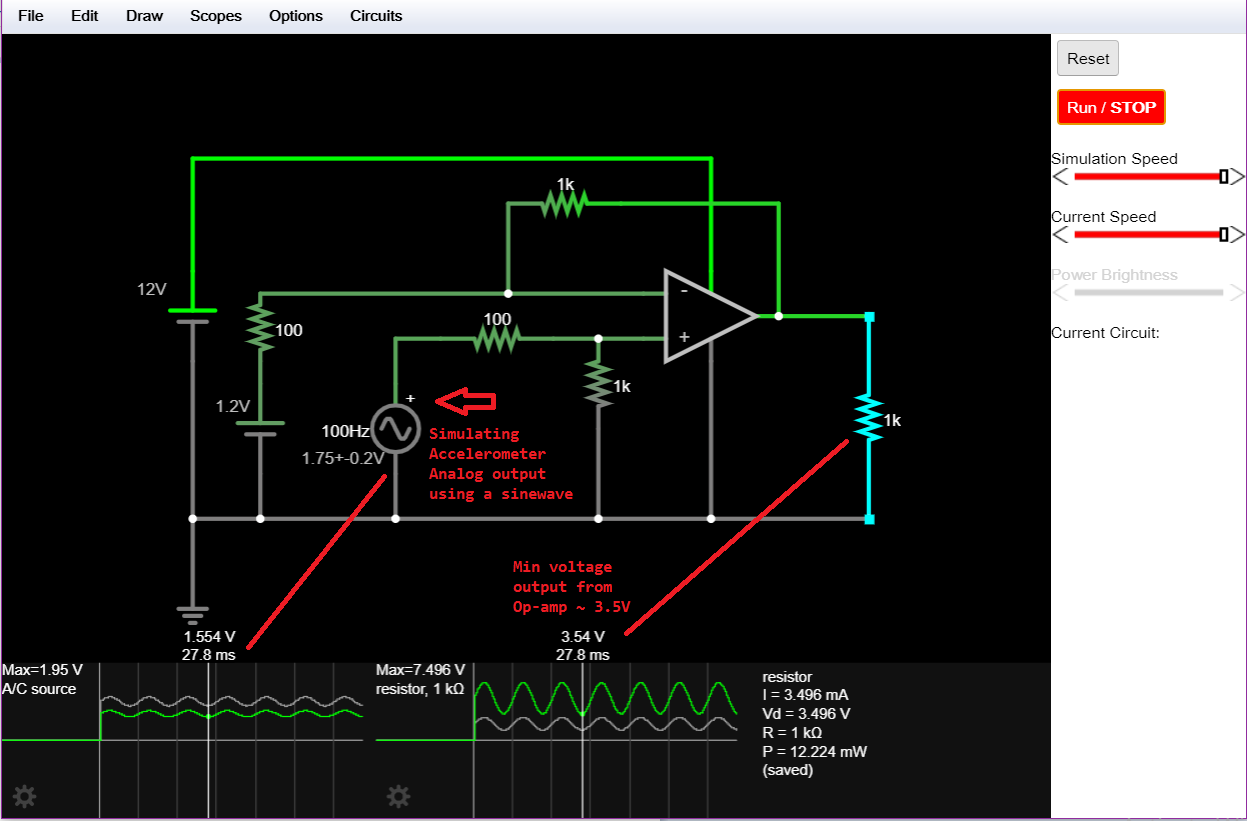
Below are the results of the simulation of a differential amplifier on Falstad Circuit Simulator, I have used ratio R2/R1 = 1000/100 = 10, hence difference between Accelerometer Output and Reference voltages will be amplified by 10 times.
Op-Amp Output Voltage
= (R2/R1) * (Accelerometer Output - Reference voltage)
= (1000 / 100) * ( (1.75 ± 0.2) - 1.2V )
= (10) * ( 0.55 ± 0.2 )
= 5.5 ± 2 V
= 3.5 to 7.5 V
Note that the 100Hz simulated sinewave as accelerometer output in above simulated circuit has nothing to do with the 0.5Hz to 1600Hz range of ADXL335 (as per mentioned in...
Read more »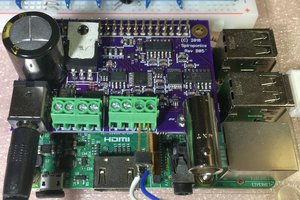
 Chris Johnson
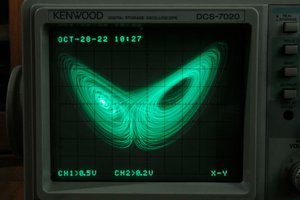
 CheeenNPP
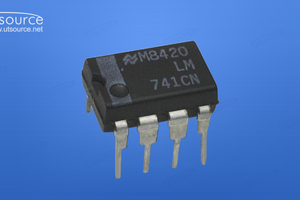
 Electroniclovers123