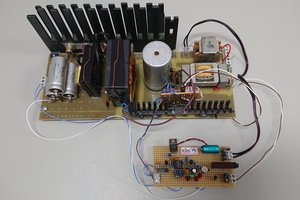
In this project, I use a Python script and an updated version of my digital-to-synchro project to replay my mountain bike climbs and descents at 60x real time speed on a vintage aircraft altitude indicator. The updated D2S converter fits on a single board and uses three Microchip MCP4802 DACs and three TI OPA548 power operational amplifiers to produce high-power 400 Hz AC waveforms to power and control the servo loop in the altitude indicator.
High-Level Overview
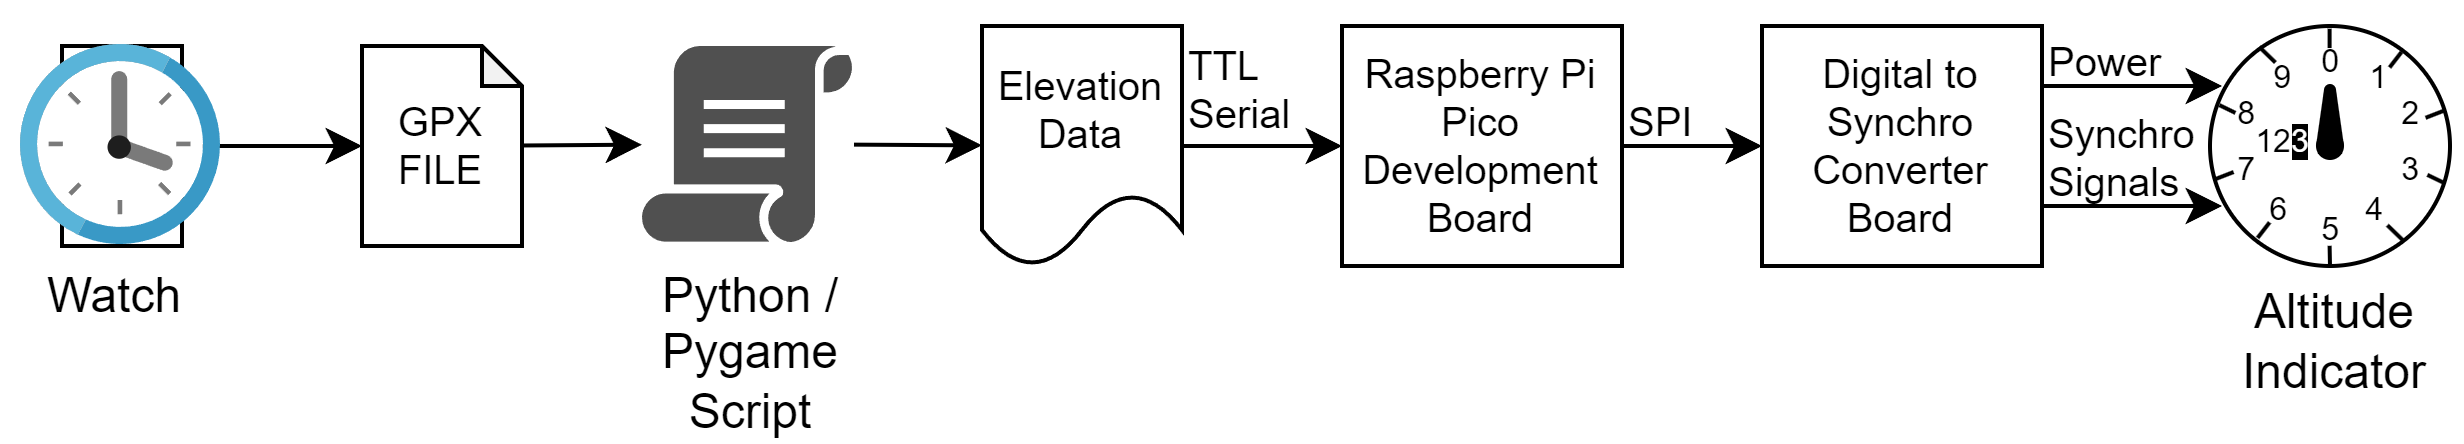
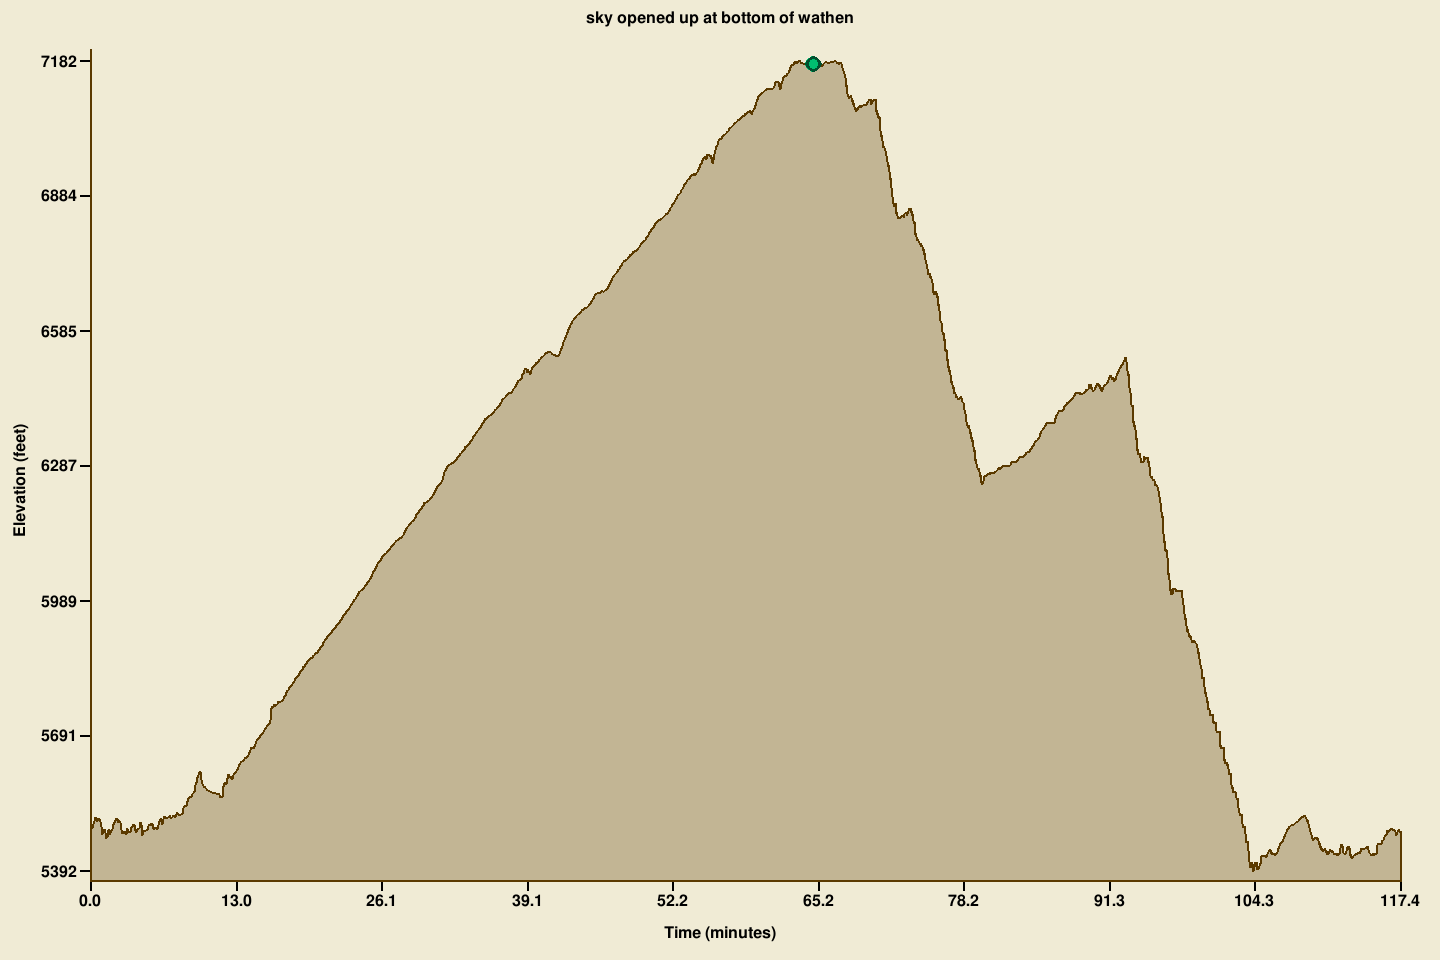
The block diagram for this project is shown above. My watch records the time and my latitude, longitude, and elevation as I ride. After the ride, I export these data in a GPX file to a Raspberry Pi 400. On the Pi 400, a Python script reads the GPX file and outputs the elevation data from the file at 60x real time over its first TTL serial port to a Raspberry Pi Pico development board. The Python script also displays the current location on the ride on a graph of the elevation profile of the ride as it is being played back
Software running on the Pico converts the stream of elevations to synchro angles corresponding to the elevations to be displayed on the altitude indicator. The outputs of the software are three 400 Hz signals. The first signal is a fixed-level 400 Hz signal used to generate the 400 Hz AC that powers the altitude indicator. The second two signals are the synchro format 400 Hz AC signals used to control the altitude displayed on the altitude indicator.
These signals are output over the Pico's SPI bus to three MCP4802 8-bit dual channel DACs on the digital-to-synchro board. One channel on each DAC is used to control the DC offset of each of the AC signals. The second channel on each DAC outputs one of the three generated AC waveforms from the Pico.
The six outputs from the DACs are fed to three TI OPA548 high-voltage, high-current operational amplifiers. Each power op amp generates one output signal by subtracting the DC offset from the AC signal to center the final output at DC and amplifies the signal to the levels needed by the altitude indicator. The altitude indicator then indicates the elevation at that point along the ride.
We'll cover each of these steps in greater detail going forward.
The Python Script
The Python script uses the gpxpy module to parse the GPX file from the watch, the pygame module to graph the elevation profile, and the serial module to send the elevation data to the D2S converter. The vast majority of the code is dedicated to drawing the elevation profile.
At startup, the GPX file is loaded into memory and the first segment of the first track is converted into a list of points of the form (time since start of ride in seconds, elevation in feet). The minimum elevation, maximum elevation, and length of the ride are used to scale the display of the elevation profile to maximize its size in the available window area. The elevation profile is then drawn, labeled, and saved into a pygame surface.
Inside the pygame main loop, time starts at zero and is incremented second by second until the end of the ride. This is done no faster than 60 times a second resulting in the playback running at up to 60 times normal speed.
At each time step, a point of the form (time, elevation) is pulled from the previously generated list of points. If no point exists at a given time, the elevation of the previous point is used. The pre-drawn elevation profile is blitted into the pygame screen buffer, a green circle is drawn at that time and elevation, and the screen buffer is displayed.
Simultaneously, the elevation at that point is sent out the Pi 400's serial port to the Pico for display...
Read more »
 Umit Kayacik
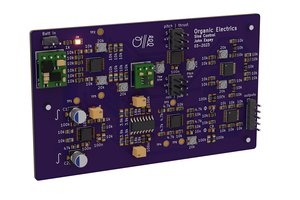
 Keith
Keith
This is a very cool idea. I like all sorts of retro-"encabulators", I mean interfaces :)
A word of historical background: those drum-style altimeters went out of fashion for a good reason. They killed more then a few people. It takes more effort to read them than the later designs. During high workloads, this becomes a problem.
The drums may also become unreadable during upset recovery, when inappropriate vestibulo-oculomotor reactions diminish visual acuity.
I admire the mechanical complexity of these things though. Just wow.