 Guillermo Perez Guillen
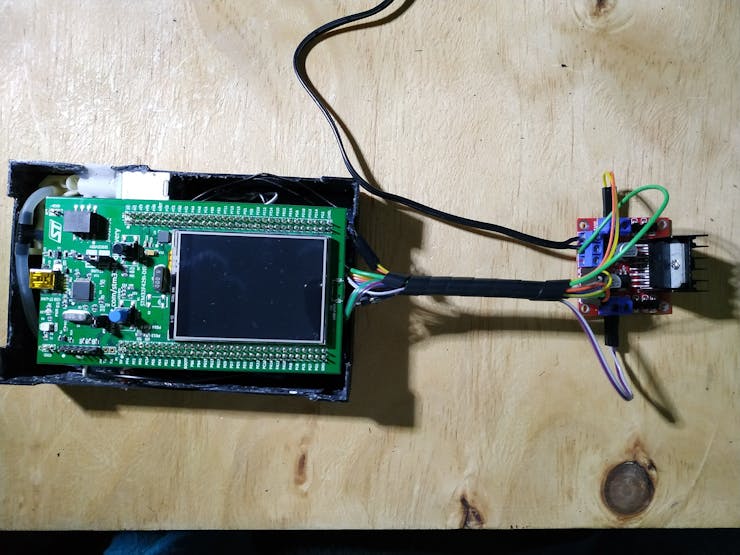
I can tell you that the project was made with GNAT Programming Studio, is my own and my creativity (source code, schematic diagram and flowchart). For the rest, I used and modified the arduino demo code from the pressure sensor manufacturer, and the code to send the test data.
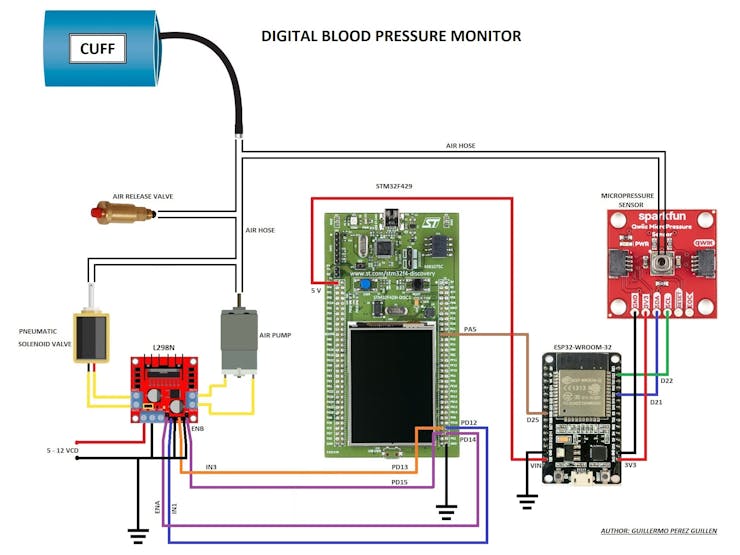
Description:
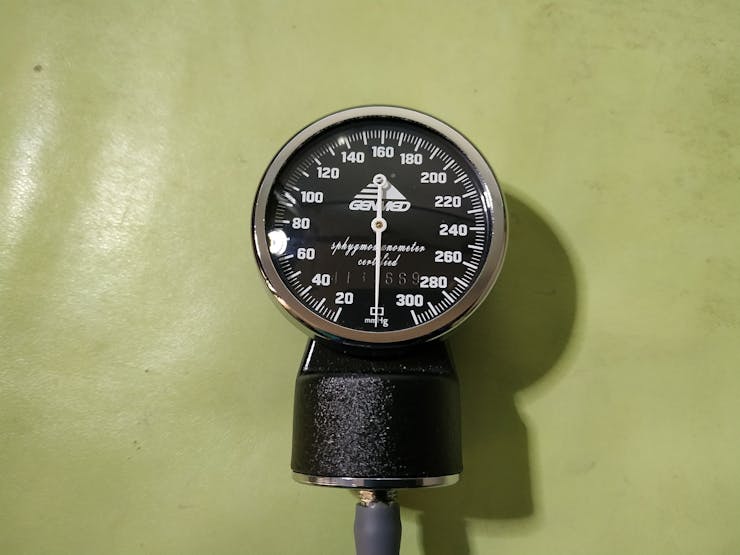
- Pressure measurements of this device were compared with an aneroid manometer.
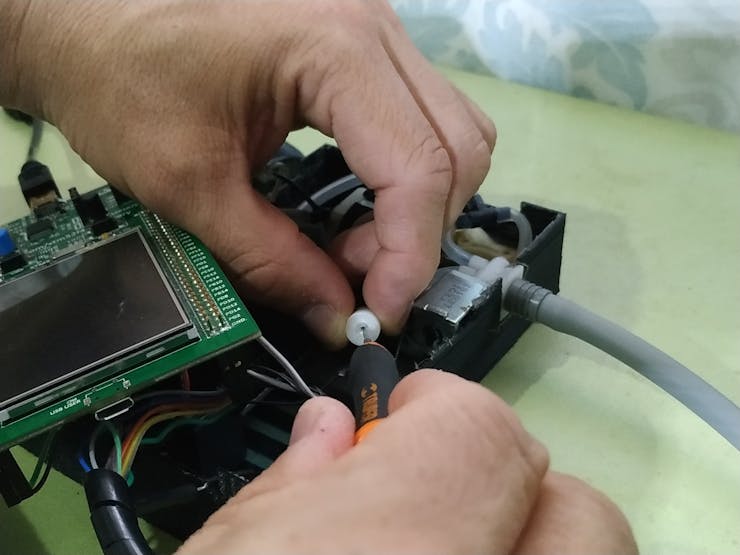
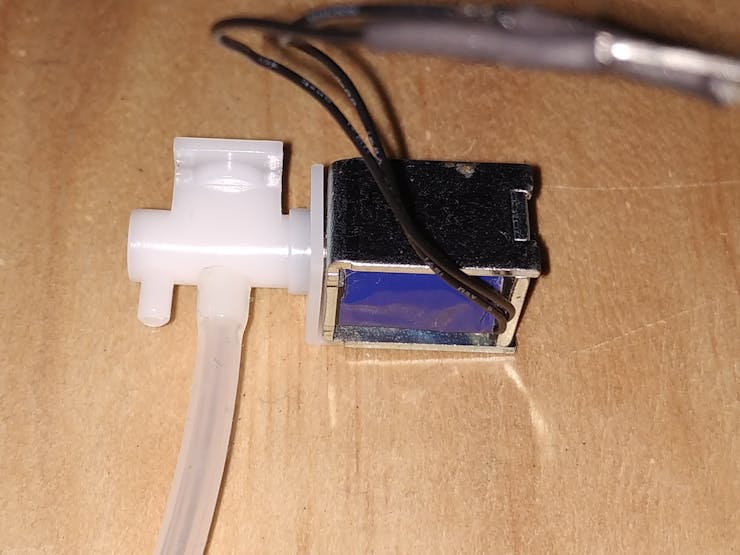
- I had to calibrate the air release valve several times.
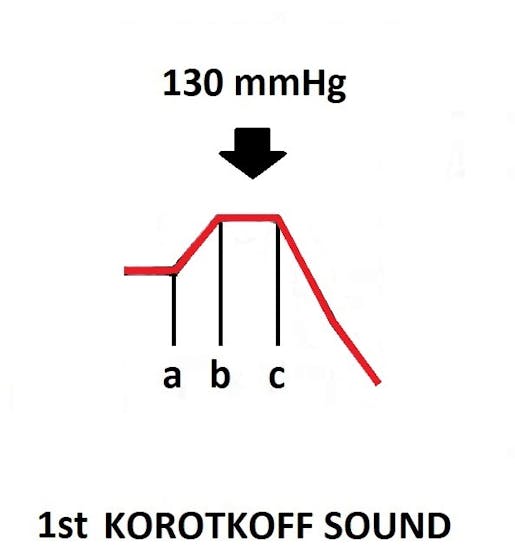
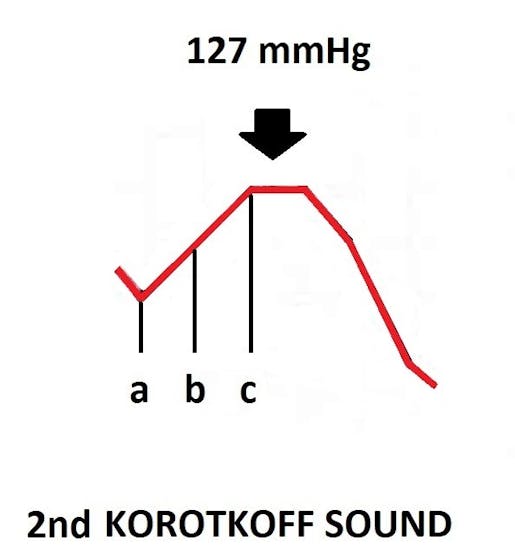
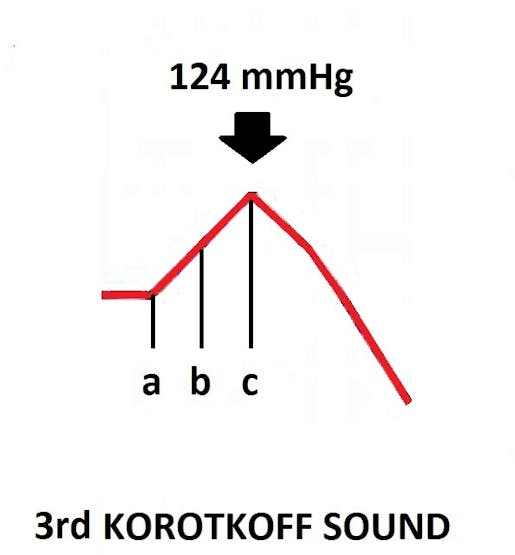
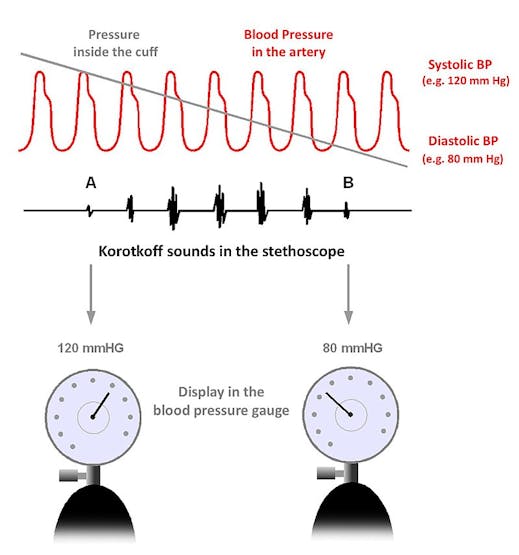
- This model can be useful for a doctor or nurse who suffers from a bad hearing, because it would be imposible to detect the Korotkoff sounds.
- In the final tests I feel satisfied with the values measured by my device when I compare it with the OMRON device.
The analysis of the code of the digital blood pressure monitor I've divided it into three sections:
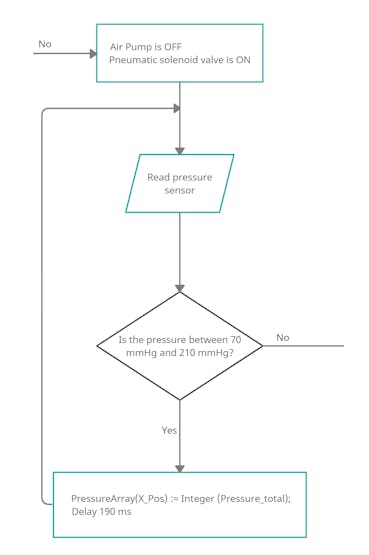
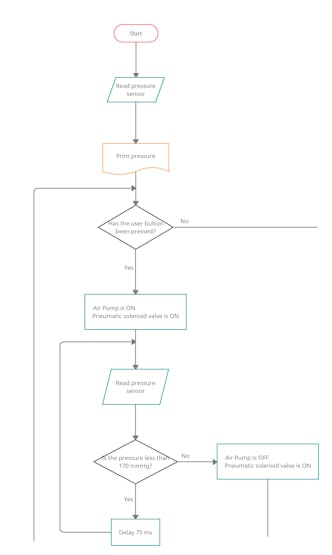
- Inflation of the cuff,
- Deflation of the cuff, and
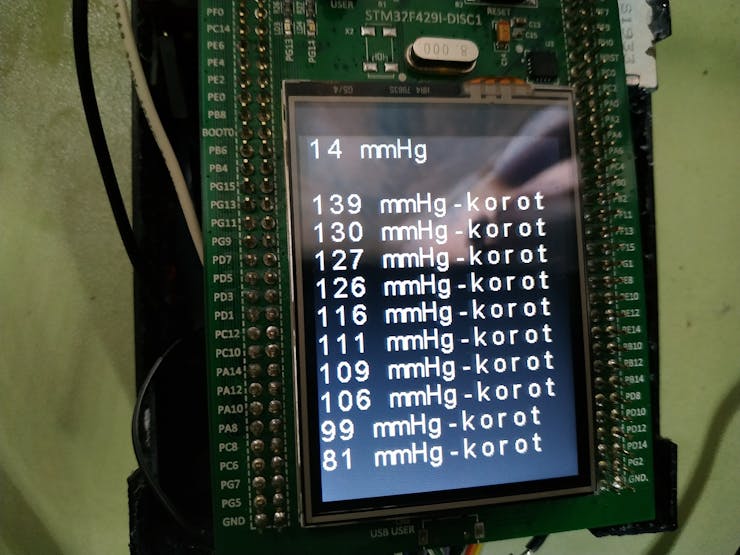
- Calculation of the Korotkoff sounds.


 Simon Harvey
 PAM
PAM
 Mirko
Mirko
 Patrick
This project can help disabled people, or anyone who live in marginalized areas, since this is a digital blood pressure monitor built with a low budget and is open source. Anyone with technical knowledge can easily build this project.