Close
0%
0%

Plant Foliage Health Monitor

Spectrophotometer To Determine Normalized Difference Vegetation Index (NDVI) Built With Raspberry Pi And NIR Spectral Sensor

Public Chat
Similar projects worth following
This project uses the AS7263 NIR (near infrared) spectrometer sensor and the Raspberry Pi 4B board to assess plant foliage health. It explains how to uses the sensor’s channel readings and the standard Normalized Difference Vegetation Index (NDVI) equation to calculate an estimated NDVI value. Also prints the value and a “HEALTHY” or “UNHEALTHY” statement, and turns ON an RGB LED to green or red to indicate whether the foliage is healthy or not, respectively. Finally, it saves the test data into a CSV format file. The latest version includes a real-time IoT monitoring to share the captured information to the whole world in the internet cloud.

This is something that I have wanted to do for a long time because I have always been interested in the measurement of the phenomenon of light. I even once won a prize proposing a new method to measure light. Below I show an introduction to my project.
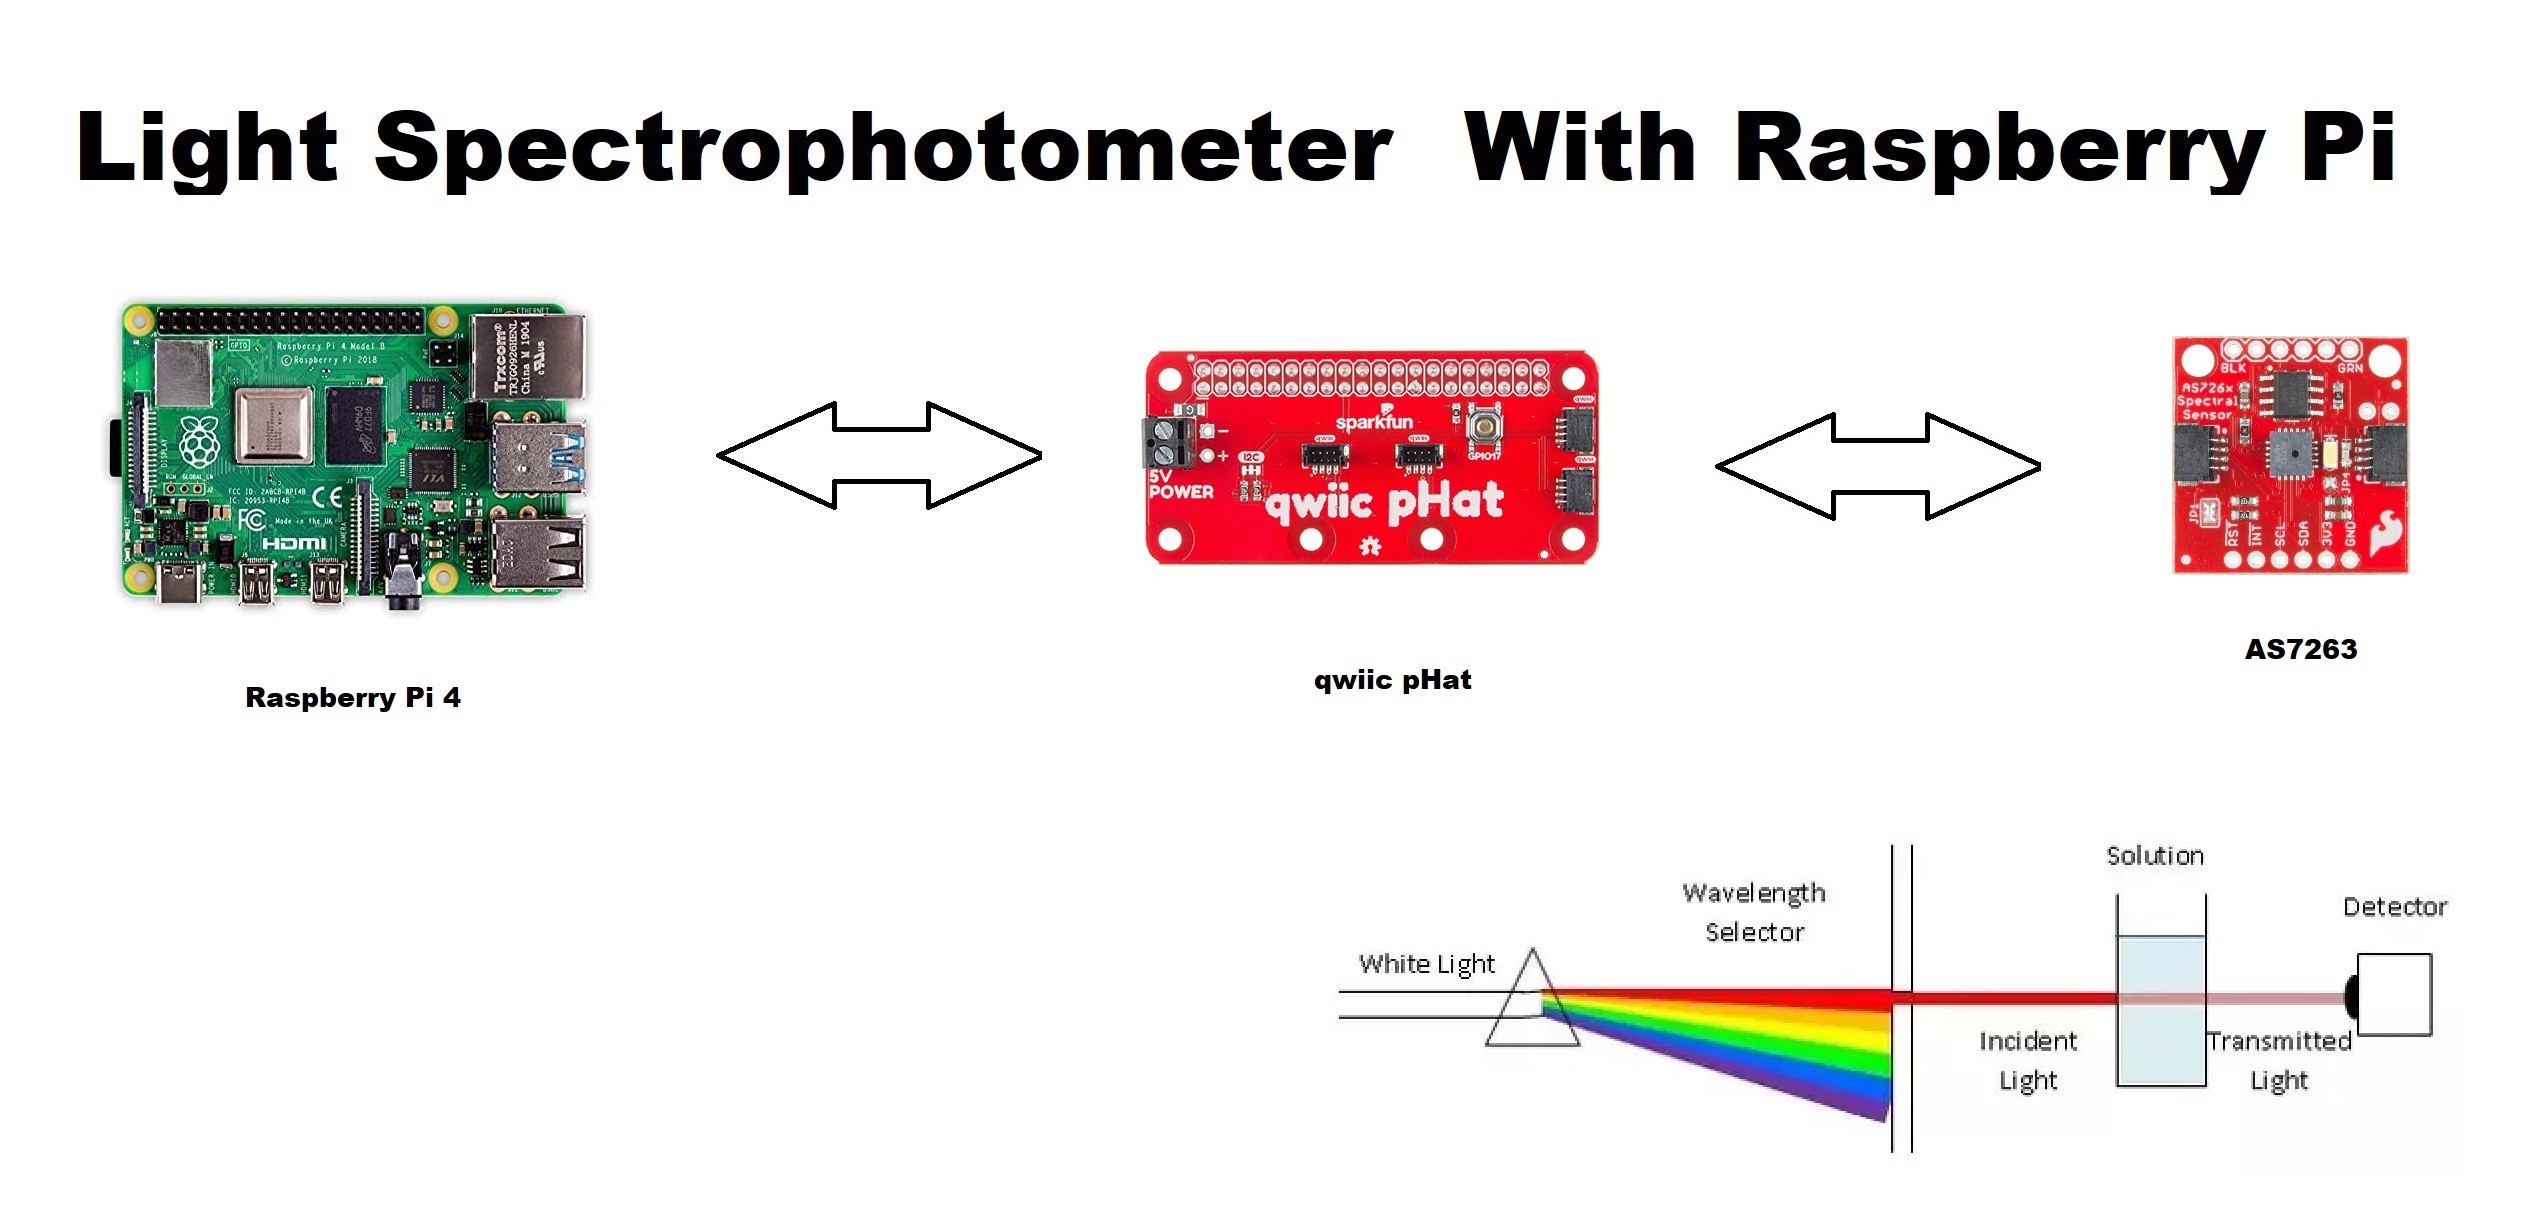
How does it work?

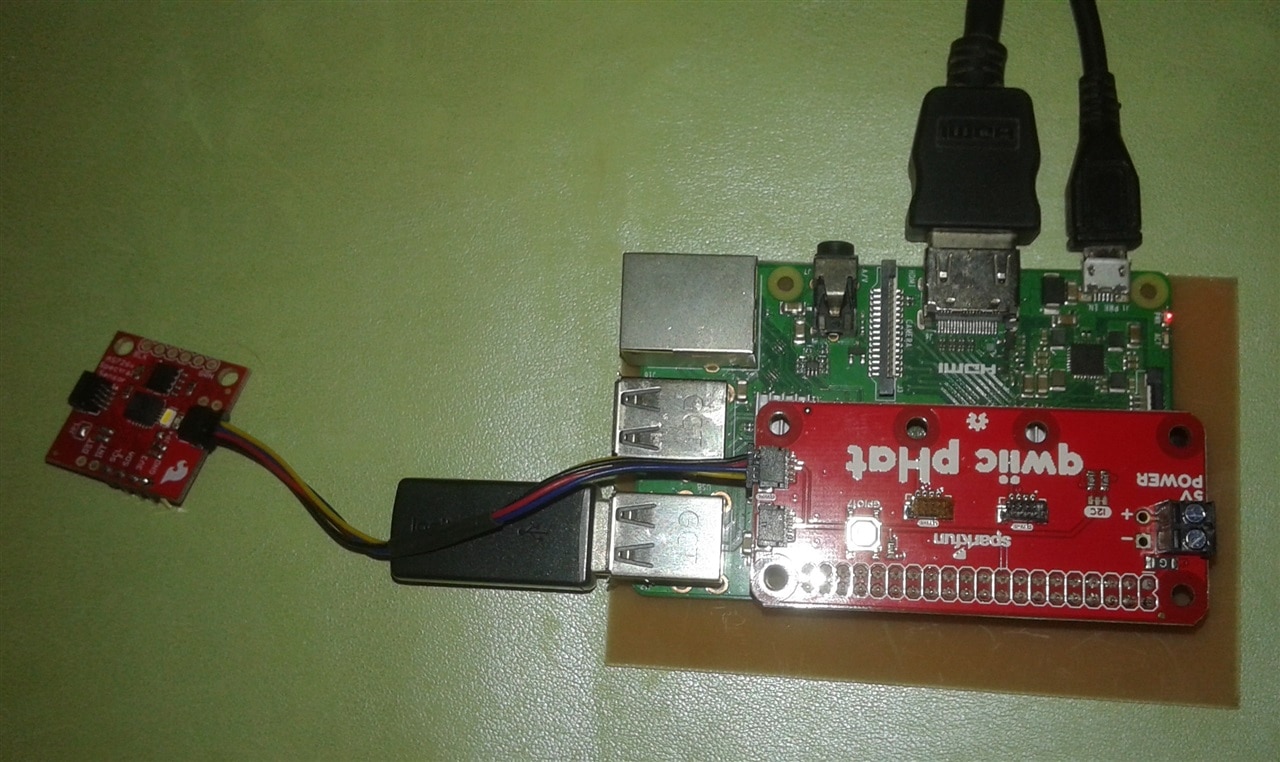
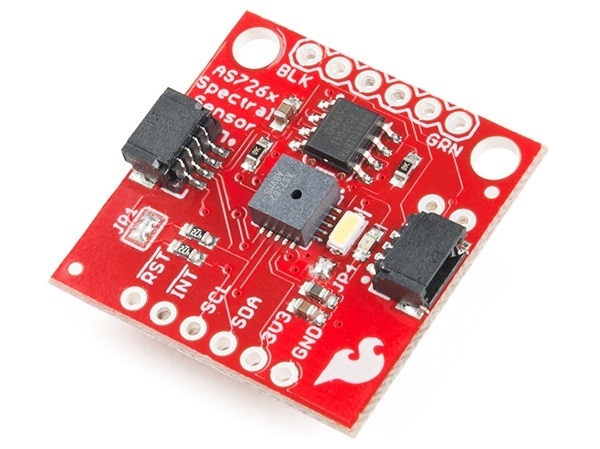
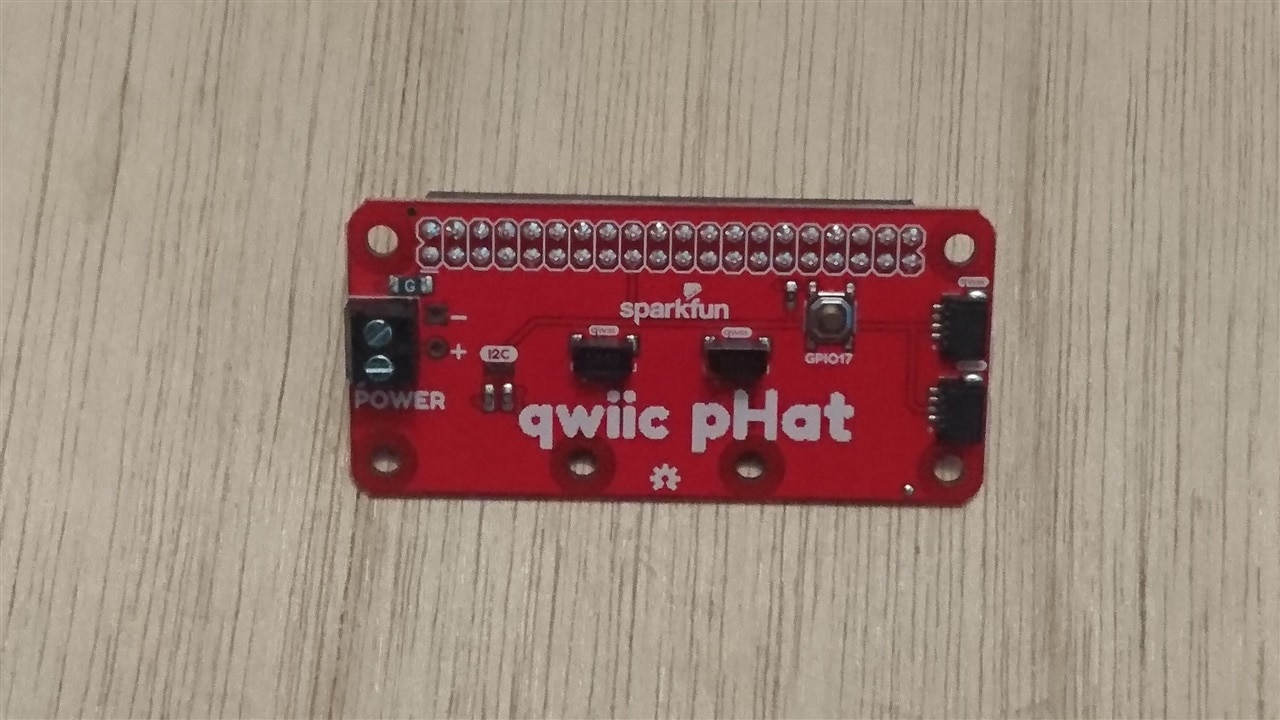
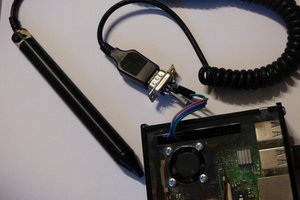
  1. First, I built a module to accommodate the AS7263 sensor. The goal is to prevent strange light interference.
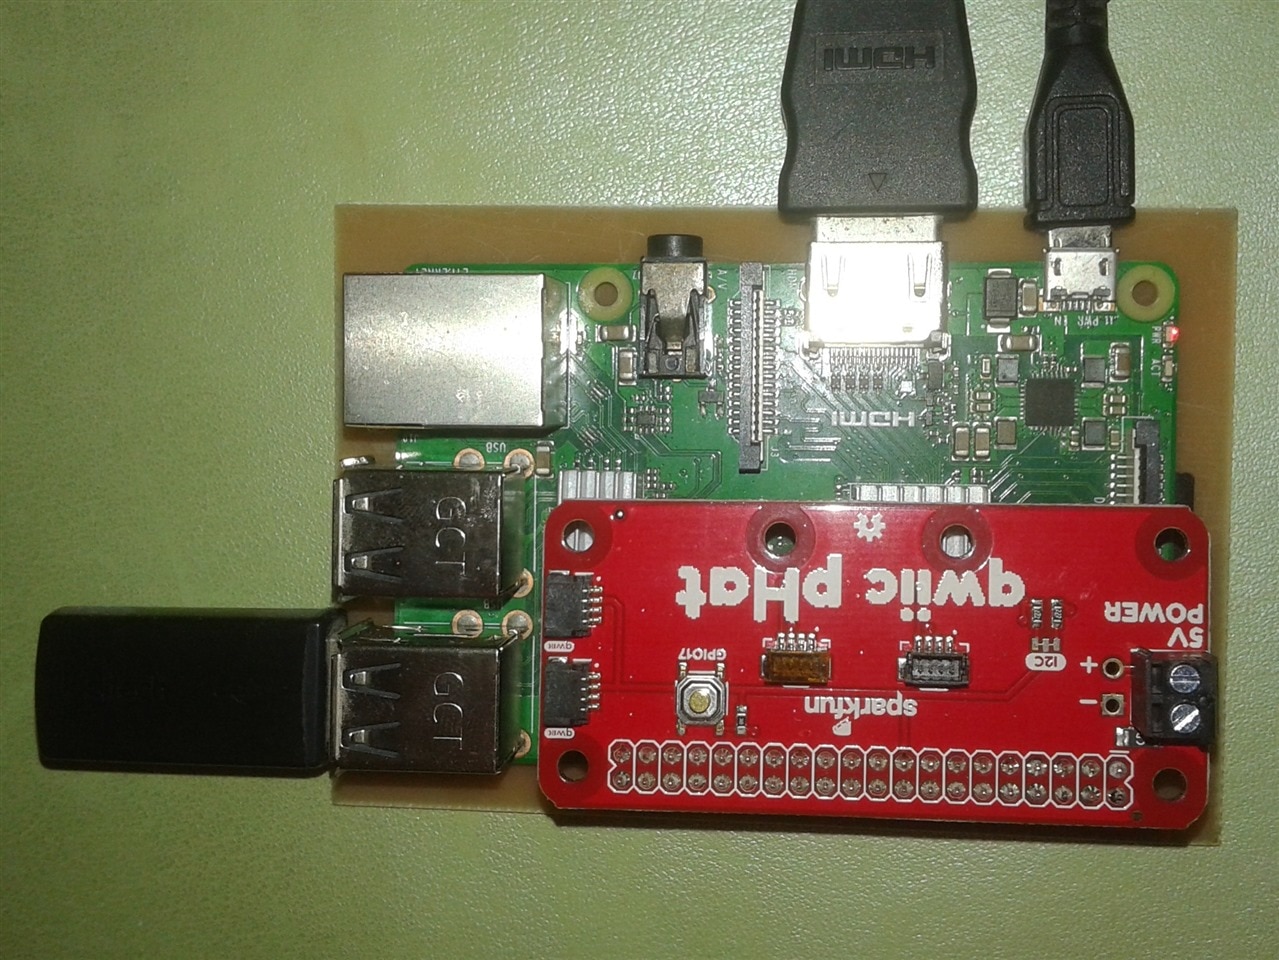
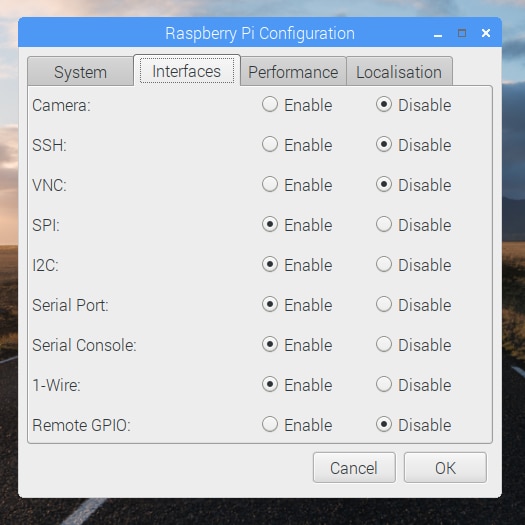
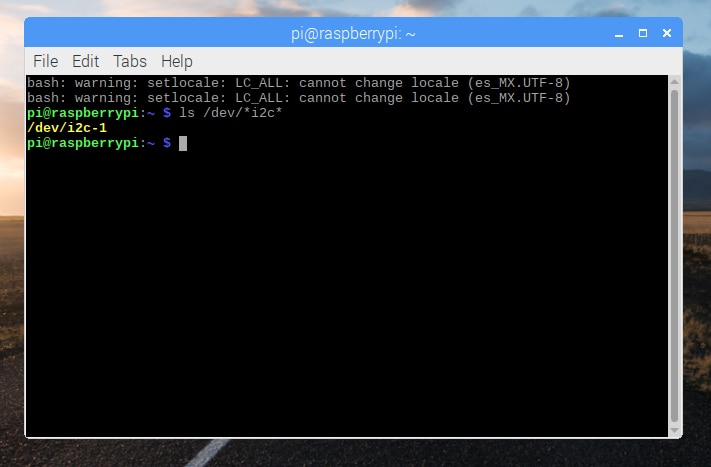
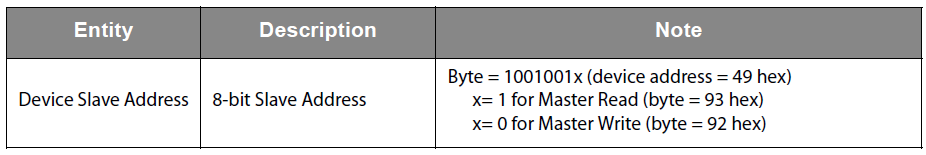
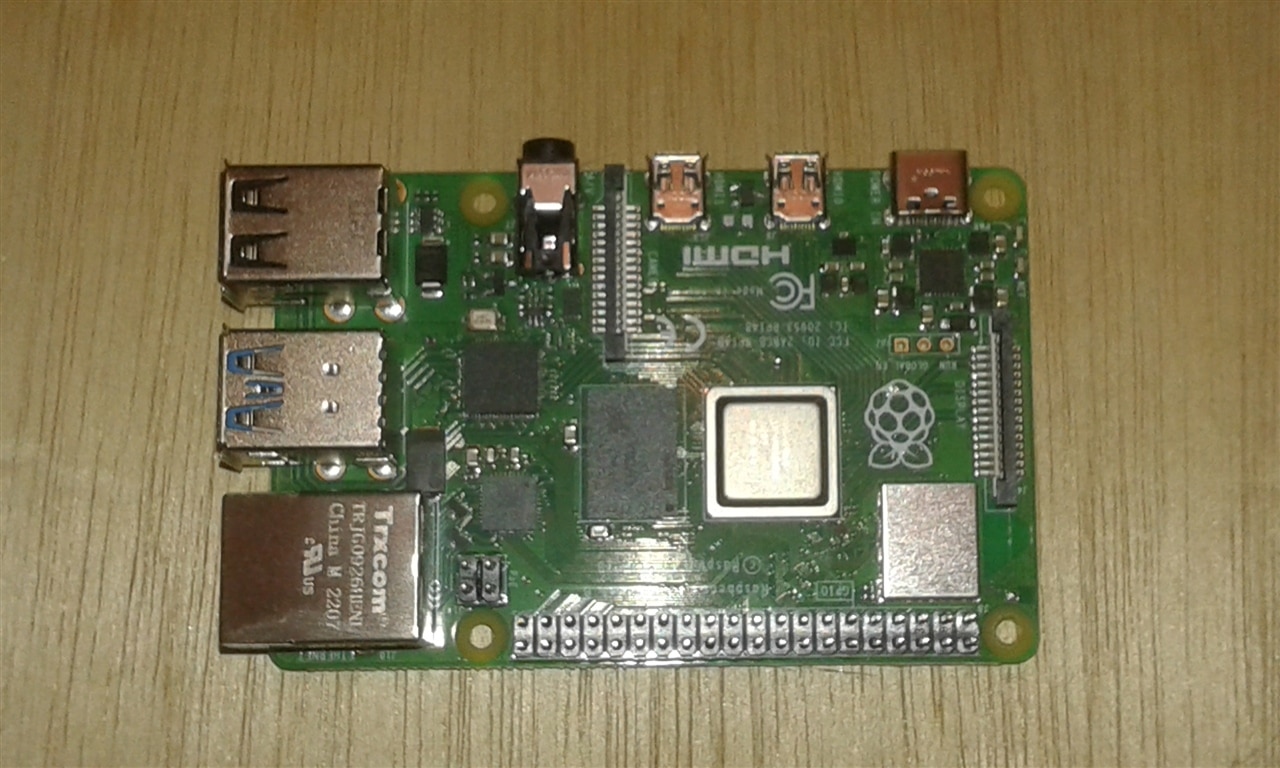
  2. Then, the pHat module will be configured to interface the AS7263 sensor with the Raspberry Pi board.
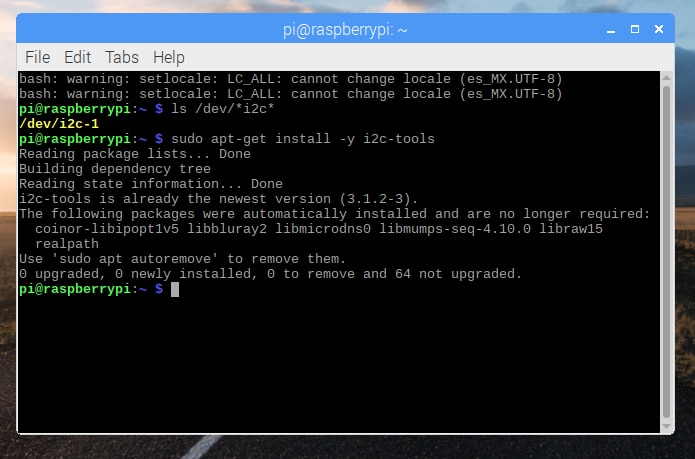
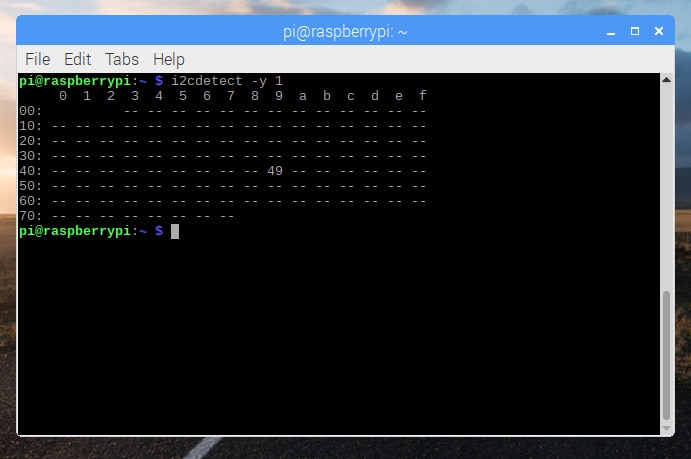
  3. The AS7263 NIR Sensor libraries wias installed.
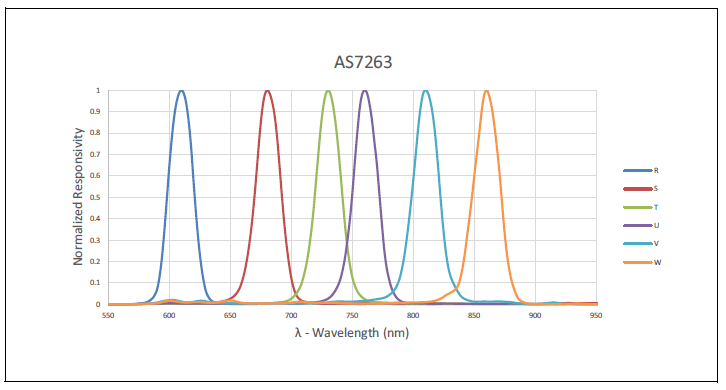
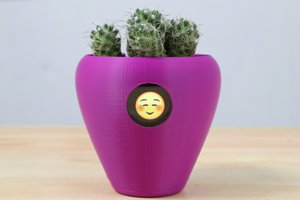
  4. The experiment has a scientific nature. I developed a "Plant Foliage Health Monitor". Here I used the AS7263 NIR (near infrared) sensor, and I adapted a module to do the tests. The objective is to analyze samples of plant leaves and verify their health status as "HEALTHY" or "UNHEALTHY".
  5. The last experiment consists of adapting an IoT monitoring system in real time. The goal is to do experiments and send data to the internet cloud so that colleagues around the world can see the data from our experiments in real time.

AS7263.pdf

Datasheet

Adobe Portable Document Format - 778.47 kB - 05/30/2023 at 18:46

Preview
Download

ndvi.zip

CSV file obtained during testing

x-zip-compressed - 2.87 kB - 05/30/2023 at 05:47

Download

stl_files.zip

3D files in STL format

x-zip-compressed - 9.59 kB - 05/30/2023 at 05:33

Download

  • 1 × Raspberry Pi 4B
  • 1 × AS7263 NIR Sensor
  • 1 × Qwiic pHAT module
  • 1 × Qwiic Cable
  • 1 × RGB LED

  • 4. Normalized Difference Vegetation Index (NDVI)

    Guillermo Perez Guillen05/30/2023 at 05:07 0 comments

    Chlorophyll is any of several related green pigments found in cyanobacteria and in the chloroplasts of algae and plants. Chlorophyll allow plants to absorb energy from light. Chlorophylls absorb light most strongly in the blue portion of the electromagnetic spectrum as well as the red portion.Conversely, it is a poor absorber of green and near-green portions of the spectrum. Hence chlorophyll-containing tissues appear green.

    image

    Normalized Difference Vegetation Index (NDVI) quantifies vegetation by measuring the difference between near-infrared (which vegetation strongly reflects) and red light (which vegetation absorbs). So, the scientists use NDVI to assess foliage health by measuring the difference between the amount of near-infrared and red light that is reflected off the foliage, using the following equation: 

    image

    References:

    In my case I used the range between 0.2 to 0.65, because I did tests with my sensor and I found that at values upper 0.7 some leaves were dry. so I lower the upper threshold a bit to ensure good readings.

    For this tutorial, I will apply this method to a three plant’s leaves by plugging in readings from the AS7263 NIR sensor into the NDVI equation. The sensor detects wavelengths across 6 channels and puts out readings as counts per μW/cm2, which gives a measure of the amount of incident light that is being reflected at each wavelength. Two of the sensor’s channels are close to the wavelengths that are typically used in the NDVI equation. These channels are S and V, giving out readings for the 680 nm (red range) and 810 nm (near-infrared) wavelengths, respectively. Once the NDVI value is calculate, we can use an "if else" statement to signal whether the foliage is within a healthy range or not.

  • 3. Getting Started

    Guillermo Perez Guillen05/30/2023 at 05:02 0 comments

    In this chapter we learn how to setup the Raspberry Pi and how to detect the peripheral of the sensor.

    Configuring the Pi

    To get started with your Qwiic pHAT, simply plug it into the headers on the Raspberry Pi with the letters facing you. We'll use the Qwiic pHAT v2.0 in the following image to connect a Qwiic device.

    image

    Once the pHAT is plugged in, you can start plugging in AS7262 6-channel Visible Light Sensor.

    image

    The Raspberry Pi Configuration via Desktop GUI

    You can use the Desktop GUI by heading to the Pi Start Menu > Preferences > Raspberry Pi Configuration. A window will pop up with different tabs to adjust settings. What we are interested is the Interfaces tab. Click on the tab and select Enable for I2C. Click on the OK button.

    image

    It's recommend restarting your Pi to ensure that the changes to take effect. Click on the Pi Start Menu > Preferences > Shutdown. Since we just need to restart, click on the Restart button. The system will reboot. When it comes back up, log in and enter the following command

    ls /dev/*i2c*


    image

    The Pi should respond with

    /dev/i2c-1

    Which represents the user-mode I2C interface. There is a set of command-line utility programs that can help get an I2C interface working. You can get them with the apt package manager. Enter the following command

    sudo apt-get install -y i2c-tools

    image

    In particular, the i2cdetect program will probe all the addresses on a bus, and report whether any devices are present. Enter the following command in the command line. The -y flag will disable interactive mode so that you do not have to wait for confirmation. The 1 indicates that we are scanning for I2C devices on I2C bus 1.

    i2cdetect -y 1

    You will get an output from your Raspberry Pi similar to the output below.

    image

    This map indicates that there is a peripheral at address 0x49, and according to the AS7263 datasheet, device address is 49 hex.

    image

  • 2. Hardware

    Guillermo Perez Guillen05/30/2023 at 04:51 0 comments

    In this chapter I show you the main features of Raspberry Pi 4B, Qwiic pHAT module and AS7263 sensor. 

    Raspberry Pi 4B

    This product’s key features include a high-performance 64-bit quad-core processor, dual-display support at resolutions up to 4K via a pair of micro-HDMI ports, hardware video decode at up to 4Kp60, up to 4GB of RAM, dual-band 2.4/5.0 GHz wireless LAN, Bluetooth 5.0, Gigabit Ethernet, USB 3.0, and PoE capability (via a separate PoE HAT add-on). The dual-band wireless LAN and Bluetooth have modular compliance certification, allowing the board to be designed into end products with significantly reduced compliance testing, improving both cost and time to market.

    image

    • Broadcom BCM2711, Quad core Cortex-A72 (ARM v8) 64-bit SoC @ 1.8GHz
    • 1GB, 2GB, 4GB or 8GB LPDDR4-3200 SDRAM (depending on model)
    • 2.4 GHz and 5.0 GHz IEEE 802.11ac wireless, Bluetooth 5.0, BLE
    • Gigabit Ethernet
    • 2 USB 3.0 ports; 2 USB 2.0 ports.
    • Raspberry Pi standard 40 pin GPIO header (fully backwards compatible with previous boards)
    • 2 × micro-HDMI ports (up to 4kp60 supported)
    • 2-lane MIPI DSI display port
    • 2-lane MIPI CSI camera port
    • 4-pole stereo audio and composite video port
    • H.265 (4kp60 decode), H264 (1080p60 decode, 1080p30 encode)
    • OpenGL ES 3.1, Vulkan 1.0
    • Micro-SD card slot for loading operating system and data storage
    • 5V DC via USB-C connector (minimum 3A*)
    • 5V DC via GPIO header (minimum 3A*)
    • Power over Ethernet (PoE) enabled (requires separate PoE HAT)
    • Operating temperature: 0 – 50 degrees C ambient

    AS7263 NIR Sensor

    The AS7263 Near Infrared (NIR) Spectral Sensor brings spectroscopy and makes it easier to measure and characterize different materials absorb and reflect different wavelengths of light. The Sparfun AS7263 Breakout has the ability to communicate by both an I2C interface and serial interface using AT commands. Hookup is easy, thanks to the Qwiic connectors attached to the board.

    image

    The AS7263 spectrometer detects wavelengths in the visible range at 610, 680, 730, 760, 810 and 860nm of light, each with 20nm of full-width half-max detection. The board also has multiple ways for you to illuminate objects that you will try to measure for a more accurate spectroscopy reading. There is an onboard LED that has been picked out specifically for this task, as well as two pins to solder your own LED into. The I2C address of the AS7263 is 0x49 and is hardware defined.

    • 6 near-IR channels: 610nm, 680nm, 730nm, 760nm, 810nm and 860nm, each with 20nm FWHM
    • NIR filter set realized by silicon interference filters
    • 16-bit ADC with digital access
    • Programmable LED drivers
    • 2.7V to 3.6V with I2C interface

    Below you can see the spectral responsivity of this sensor.

    image

    SparkFun Qwiic pHAT v2.0 

    The SparkFun Qwiic pHAT connects the I2C bus (GND, 3.3V, SDA, and SCL) on your Raspberry Pi to an array of Qwiic connectors on the HAT. Since the Qwiic system allows for daisy-chaining boards with different addresses, you can stack as many sensors as you’d like. The Qwiic pHAT V2.0 has four Qwiic connect ports (two on its side and two vertical), all on the same I2C bus. It also add a simple 5V screw terminal to power boards that may need more than 3.3V and a general-purpose button. This pHAT is compatible with any Raspberry Pi that utilizes the standard 2x20 GPIO header.

    image

    • 4x Qwiic Connection Ports
    • 1x 5V Tolerant Screw Terminal
    • 1x General Purpose Button
    • HAT-compatible 40-pin Female Header

  • 1. Introduction

    Guillermo Perez Guillen05/30/2023 at 04:27 0 comments

    Optics

    I assume you already have basic knowledge of optics. Optics is the study of light. Optics describes how light is created and how it travels. An important part of optics is the study of what happens when light hits different surfaces. When light hits a surface, it may be reflected, refracted, or absorbed.

    • Reflection occurs when light hits a surface and bounces back. Reflected light makes images appear in mirrors and in other smooth, shiny surfaces.
    • Refraction happens when light changes direction, or bends, when it moves from one material to another. For example, light traveling through the air refracts when it hits water. This can make a straw in a glass of water look bent at the surface of the water.
    • Some surfaces absorb, or take in, light. This causes the surface to heat up. For example, a sidewalk heats up on a hot, sunny day because it is absorbing light.

    image

    Spectrophotometry

    Spectrophotometry is the quantitative measurement of the interaction of ultraviolet (UV), visible, and infrared (IR) radiation with a material and has an impact on a wide field of science and technology.  Spectrophotometry uses photometers, known as spectrophotometers, that can measure the intensity of a light beam at different wavelengths. 

    image

    Types of spectrophotometers:

    • Infrared spectrum: study and identification of chemical substances
    • Ultraviolet spectrum: identification of molecules, black light.
    • NMR spectrophotometer: atomic/nuclear absorption.
    • Reflectance spectrophotometer: this is the spectrum used in paint and body shops to measure color (konica minolta, etc.)
    • Double beam spectrophotometer.
    • Single beam spectrophotometer.

    A double-beam spectrophotometer compares the light intensity between two light paths, one path containing a reference sample and the other the test sample. A single-beam spectrophotometer measures the relative light intensity of the beam before and after a test sample is inserted. Although comparison measurements from double-beam instruments are easier and more stable, single-beam instruments can have a larger dynamic range and are optically simpler and more compact. Additionally, some specialized instruments, such as spectrophotometers built onto microscopes or telescopes, are single-beam instruments due to practicality.

View all 4 project logs

  • 1
    Software apps and online services
    • Python
    • ThingSpeak IoT Platform
    • Excel
  • 2
    Hand tools and fabrication machines
    • 3D Printer
    • Drill
    • Soldering iron
    • Silicone
    • Glue
    • Screws

View all instructions

Enjoy this project?

Share

Discussions

Ananya Roy wrote 03/07/2024 at 18:11 point

What Calibration model did you use, Also what particular software did you use for the calbration purpose

  Are you sure? yes | no

goodmanwleticia957 wrote 02/26/2024 at 12:43 point

Using technology to monitor plant foliage health is such a cool idea. It's impressive how the AS7263 NIR spectrometer sensor and Raspberry Pi 4B board are utilized to calculate the Normalized Difference Vegetation Index (NDVI) and determine if the foliage is healthy or not. Plus, the addition of real-time IoT monitoring takes it to the next level by sharing data globally. Speaking of health, have you ever considered incorporating biotin with hyaluronic acid into your diet? It's a powerful combination known for promoting healthy skin, hair, and nails. You can check it out on Amazon. Pairing this supplement with your plant monitoring project could lead to a holistic approach to health and wellness! Let's keep pushing the boundaries of innovation for a healthier world!

  Are you sure? yes | no

Guillermo Perez Guillen wrote 05/30/2023 at 19:10 point

This project is open source and is one way we can monitor plant health and help keep our planet running a little cleaner and healthier. I can see green foliage, but I didn't know if I had enough chlorophyll until I used this device.

  Are you sure? yes | no

Similar Projects

Does this project spark your interest?

Become a member to follow this project and never miss any updates