After all is said and done, the sensor measures about a 6 ns difference between a dry sensor and one dunked into about 4 inches of water. That's certainly enough to measure since the sensor has a resolution to about 10ps with an accuracy of closer to 80ps (just rough guesses), but considering the reflection on the 7 inch dry trace in theory is only about 2ns, that difference is pretty large. Looking at the relative permittivity of pure water, delays of that magnitude are theatrically possible since a wave traveling thru 7 inches of water would see about a 10.5ns reflection. However seeing a 6 ns change would require a huge shift in the effective dielectric constant of the probe in water, which seems unlikely. So what is actually being measured here?
Lets take a closer look at a fast step signal down the probe at a much higher time resolution. While I would love to have a 10s of GHz bandwidth real time oscilloscope to do this, I don't have that kind of money, so instead I got access to some vintage hardware. Using a sampling oscilloscope with a 20GHz sampling head and a 30ps step generator, we can take a look at what dunking the probe into water looks like:
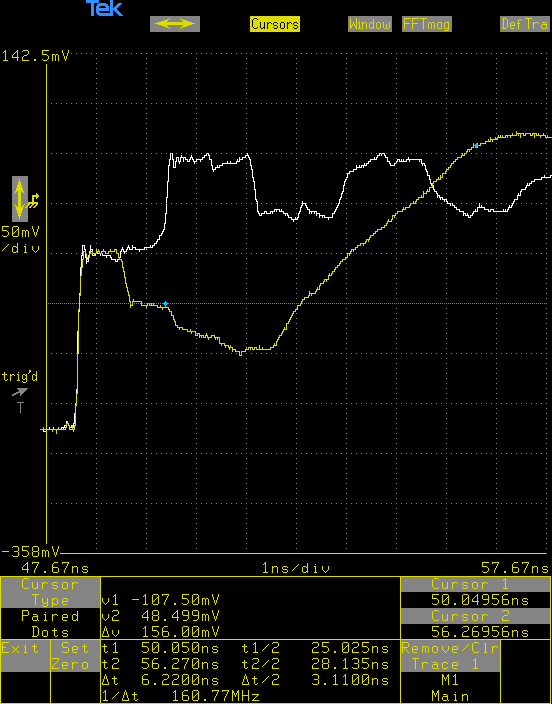
The white trace is the dry probe and the yellow trace is the probe in about 4 inches of water which cover about half the probe. The transition from air to water happens at the first reflection after the step and where the two traces first diverge. The cursor position show the time difference to when the voltage reaches it's peak, so what we are measuring with our sensor. It's also about 6ns, which at least validates the basic operation.
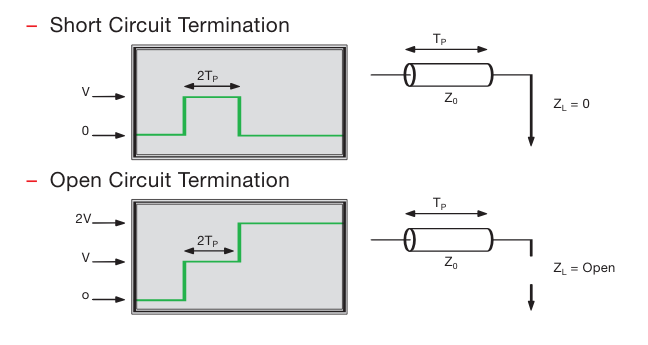
However, the shape of the trace is interesting. Unlike the white/dry trace, where there is a sharp edge at the end (ignore the secondary reflections after 3ns since that's after the signal has first reached the end of the trace), there is a lower section followed by a gentle slope up to the step voltage. This indicates a capacitive termination instead of an open termination
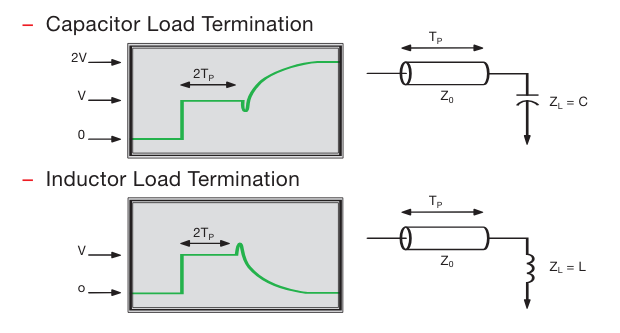
Likely what is happening is there is an increase in the capacitance between the parallel traces in addition to the change in the dielectric constant due to the water. The dielectric constant change is probably responsible for the extended lower reflection in the yellow trace and the capacitance is what is causing slope up to the final voltage. Both of which contribute to the measured delay.
So, while the sensor is based on TDR techniques, what is actually being measured is a mix of effects, much of which is a result of a change in capacitance, similar to what is measured using other soil moisture sensors. That being said, it's still effective and the probe has been robust (no failures in many months), so overall I'm still satisfied with the design.
P.S. Thanks for the comment that made me look into this more, since things are certainly more complex than it originally appeared.
Refs:
https://www.everythingrf.com/rf-calculators/time-domain-reflectometry-length-calculator
https://download.tek.com/document/55W_14601_2.pdf -TDR Impedance Measurements: A Foundation for Signal Integrity
Discussions
Become a Hackaday.io Member
Create an account to leave a comment. Already have an account? Log In.
@Brad Stewart very curious on your thoughts here given your last comment! Seems like what you suspected that this implementation is affected by capacitance was true. Do you think theblinkingman's interpretation of the reflected signals is correct?
Wondering what it would take to bring a version 2 closer to 'true' TDR. I know you mentioned higher resolution (down as low as 10ps!). Any ideas of what improvements could be tried that wouldn't require super specialized ($$$) hardware?
Are you sure? yes | no