 Vedran
Intro
I am using Teensy 4 in one of my projects where I've seemingly hit a wall with debugging. Using printf statements messes up with the timings in the code, and I have no way of inspecting the state of the system at the time when things go wrong. There's no way of pausing the code, changing few variables and resuming the execution. I have tried this approach with some other boards that shipped with on-board debugger, and ended up wondering what would it take to get this to work on Teensy.
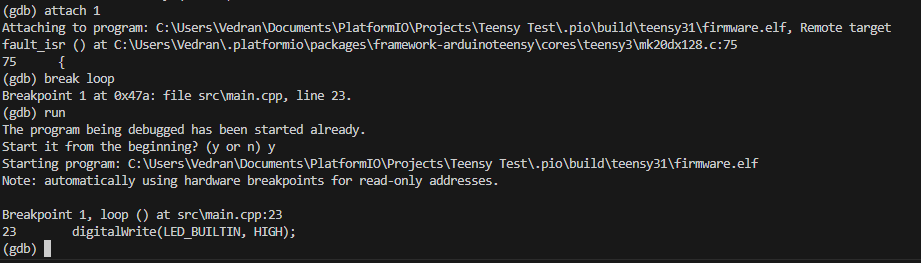
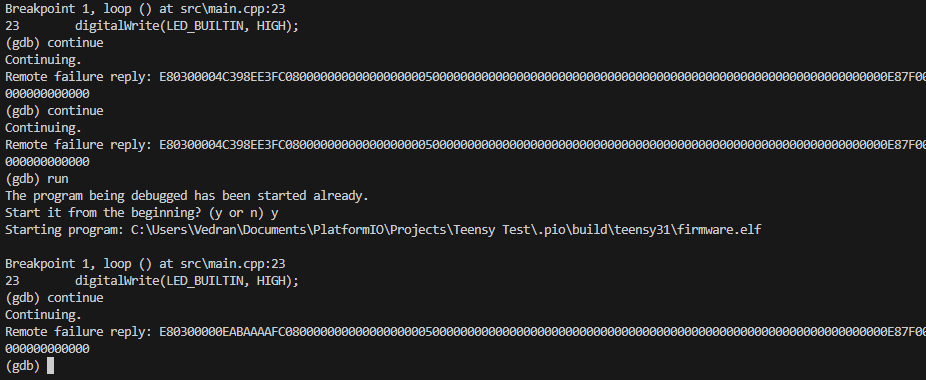
I have also tried a software solution to debugging, TeensyDebug, which essentially runs and GDB server directly on Teensy, together with your code. While this does a good job for most of the time, it seems to crash when my program dies, which is when I need it the most.
The only thing I believe could help is having a JTAG debugger to inspect the running code and be able to halt the MCU when a fault occurs.
Debugger?
This brings me to the second problem: I don't have a JTAG debugger.
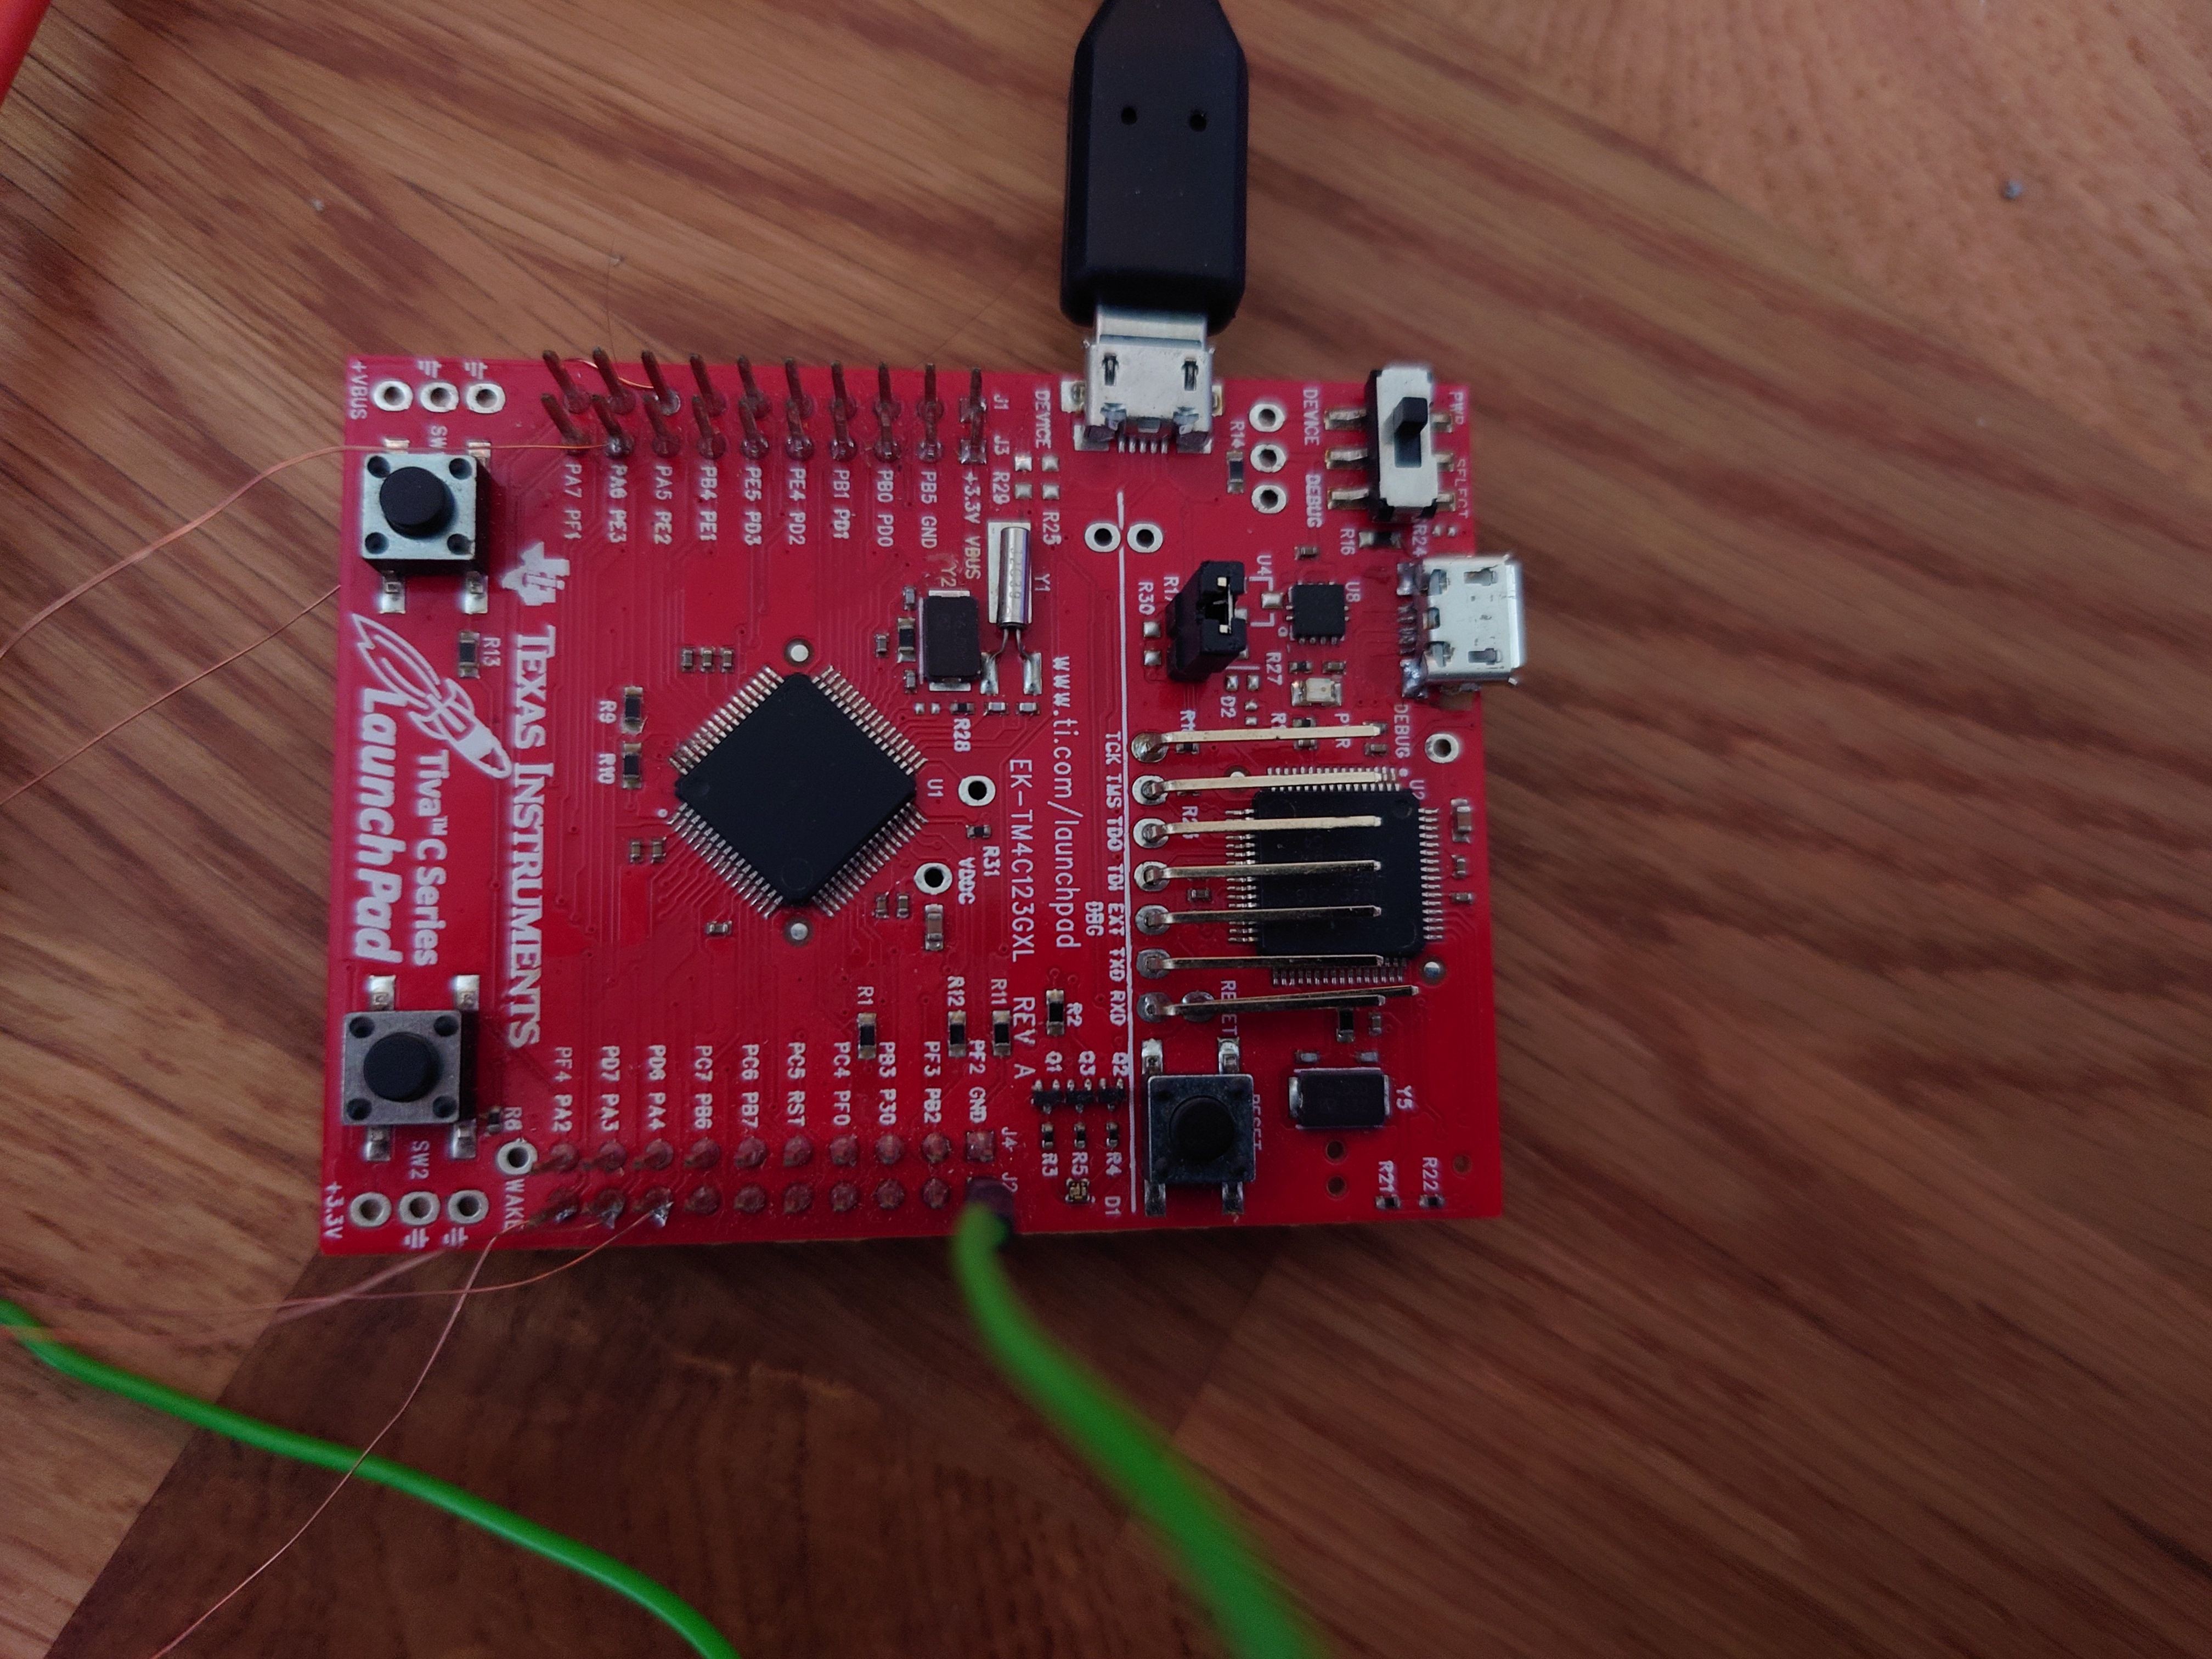
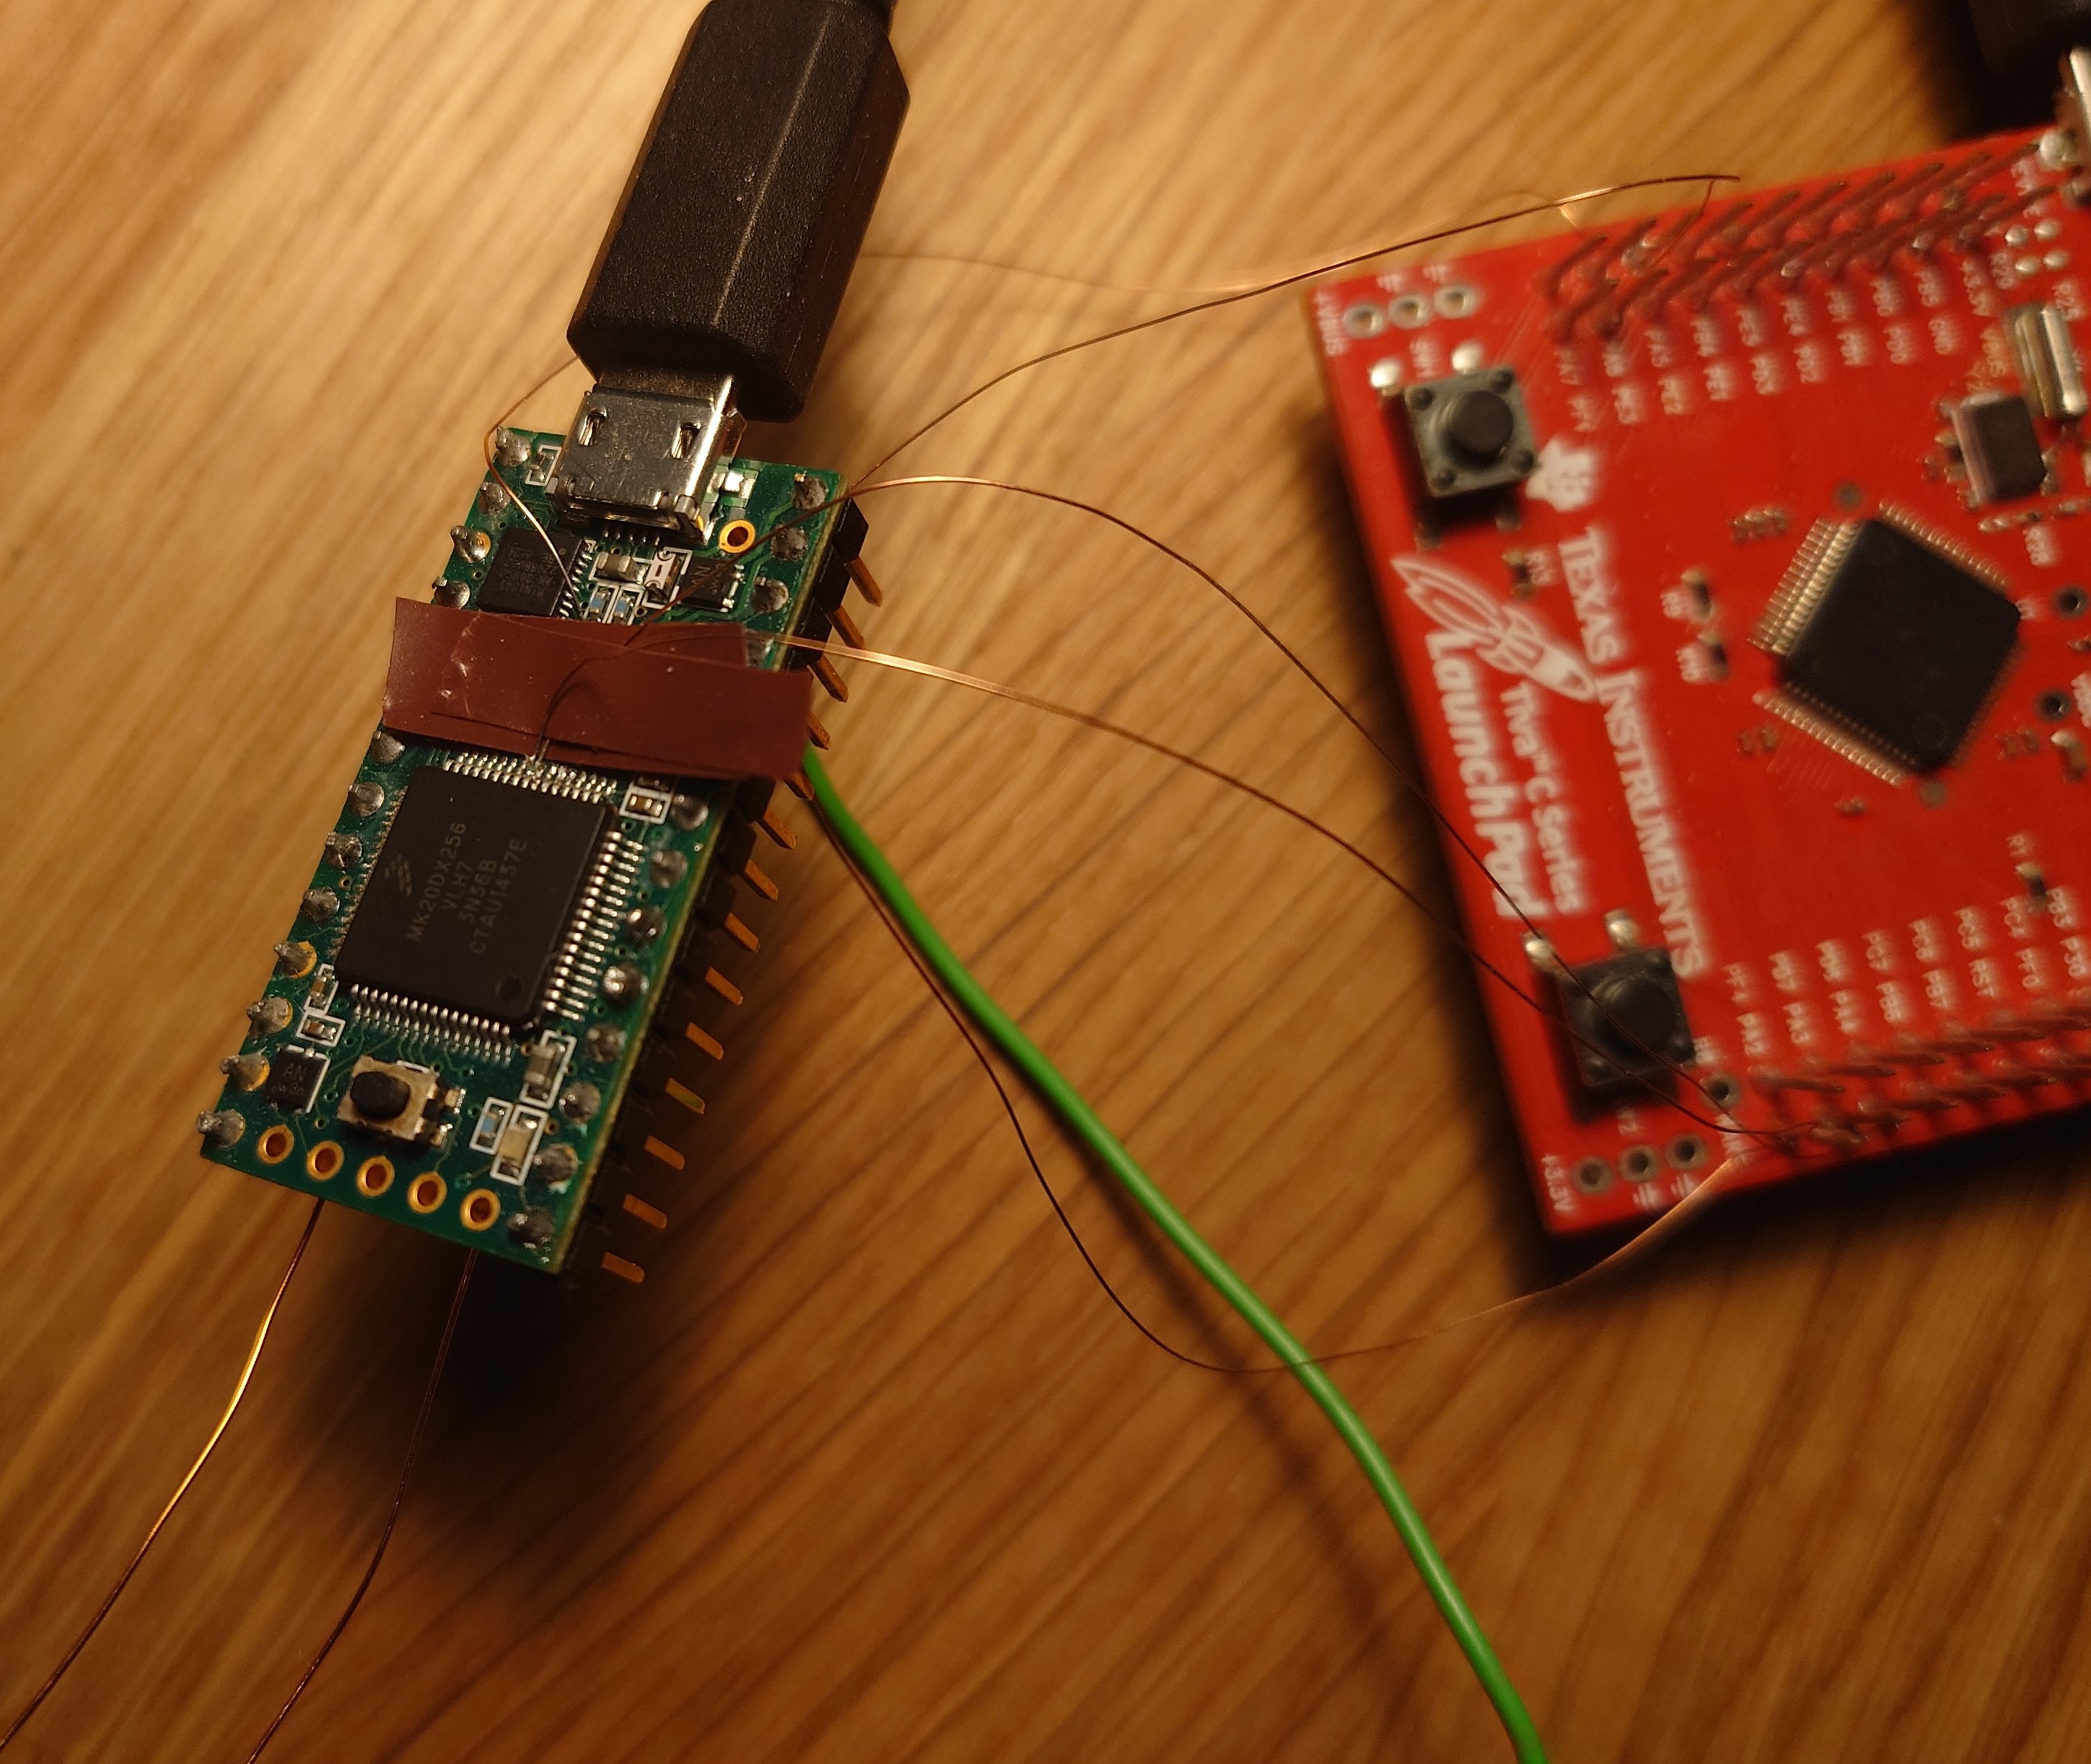
The ones I used in the past came as a part of eval kits (Texas Instruments Tiva series) and they will not work with other boards. So I need to get something else. A work colleague of mine recently showed me the blackmagic project, which is an open source debug probe, awesome! As an added bonus, they support tiva's debugger as a platform, so in theory I could reprogram on the eval kits I already have and have a general purpose debugger. Fantastic!
Getting the project to compile and run was a breeze. Now onto teensy.
Teensy 4?
Although I'd like this to work on Teensy 4, I would like to give it a try on Teensy 3 first. Reason for that is that I only have two Teensy 4 boards (one in use), but a lot more Teensy 3.2 boards I can spare, and the process sounds like it might be destructive - at least in the research phase.
Luckily, there's some good discussions around the internet on hacking in a debugger into teensy, that essentially outline the procedure or add extra bits of useful info:
- https://mcuoneclipse.com/2014/08/09/hacking-the-teensy-v3-1-for-swd-debugging/ (probably the best resource I found)
- https://forum.pjrc.com/index.php?threads/teensy-4-0-how-to-connect-a-jtag-debugger.57365/
- https://forum.pjrc.com/index.php?threads/teensy-4-1-debugging.70336/
- https://forum.pjrc.com/index.php?threads/teensy-4-1-debug-mod-project.66180/
Teensy 3 originally not supported by blackmagic
When starting this project, one of the hurdles was that MK20DX256, chip used in Teensy 3 was not originally supported by the blackmagic debug probe. However, I have since sent a pull request with support for it and it now works with the probe.
Wiring up Teensy 3.2
Teensy 3.2 features a bootloader chip (MKL02). That chip is what allows loading the firmware into Teensy chip using the Teensy loader PC program. It also ensure that no matter how bad you mess up your program, your board will always be programmable. Bootloader chip has access to the main chip (MK20DX256) via SWO interface. Since the board doesn't expose the pins in a convenient header, the only way is to tap into the connection between the bootloader and main chip.
Wiring it is a bit of a process and requires some thin wires and a steady hand. I ended up attaching all of the wires I could onto the via as they are easier to solder, and those that I couldn't directly onto the chip. Final result looks like this:

Pinout is as follows:
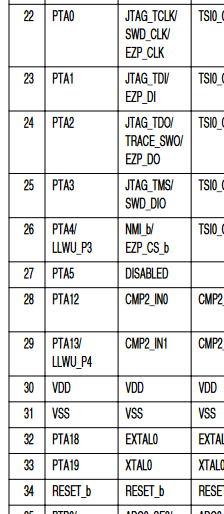
| JTAG /SWOSignal | MK20DX Pin | Location Hint |
| TCK/SWCLK | PTA0 | 22 (accessible from top of the 2 soldered vias) |
| TDI | PTA1 | 23 (accessible from bottom of the 2 soldered vias) |
| TDO/tSWO | PTA2 | 24 (8 from the top of the left side of the chip; accessible on chip only) |
| TMS/SWDIO | PTA3 | 25 (9 from the top of the left side of the chip; accessible on chip only) |
| RST | RESET_b | 34 (exposed via 'R' test pad on the back side) |
From what I understood online, both JTAG and SWO interface are usable on Teensy 3.2, so the choice of interface is mostly up to the probe hooked up to it.
In this configuration, bootloader...
Read more »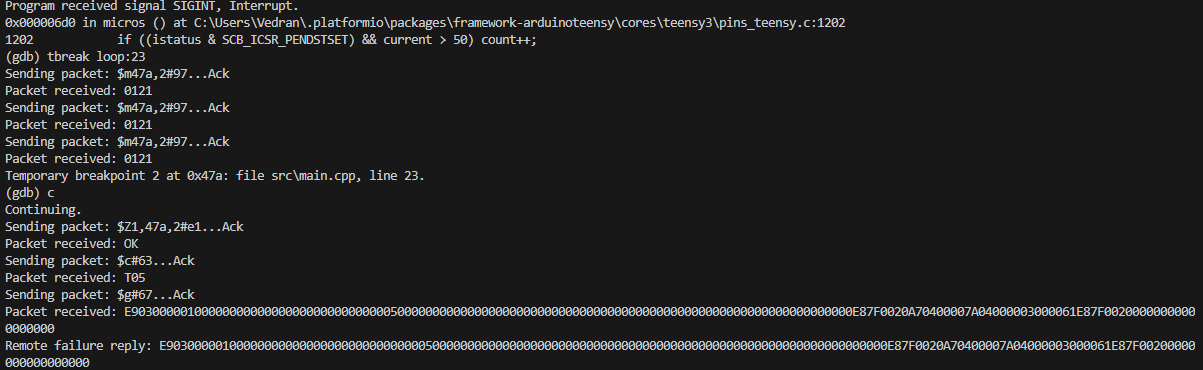


 ziggurat29
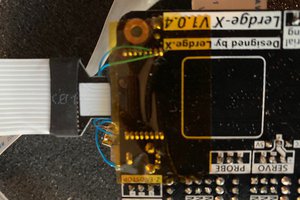
 J.C. Nelson
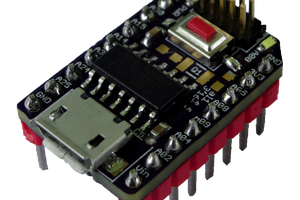
 Alex
Alex
 lb5tr
lb5tr