 Michael Doody
The software for the Yellowstone machine has been remotely upgraded in a major revision. Data points are now also expressed in terms of their vector compass axis in addition to their compass direction origin. Time is now obtained periodically from an internet time server, as opposed to a local clock module for each data point. The use of a internet time server now allows for much better correlation with the multitude of other research seismometers in the Yellowstone region.
The device has also been even further protected against external power fluctuations by basing all analog sensor measurements on an internal voltage reference derived from the amplifier board itself.
The probability matrices are now based on 500,000 measurements and the initial sensor calibrations are based on the average of 48,000 measurements.
Probability matrices now assign each event to 75 "bins" for each measurement of vector magnitude, compass direction and depth. The software improvements now allow for an average of 4.1 data records per second.
The results are amazing.
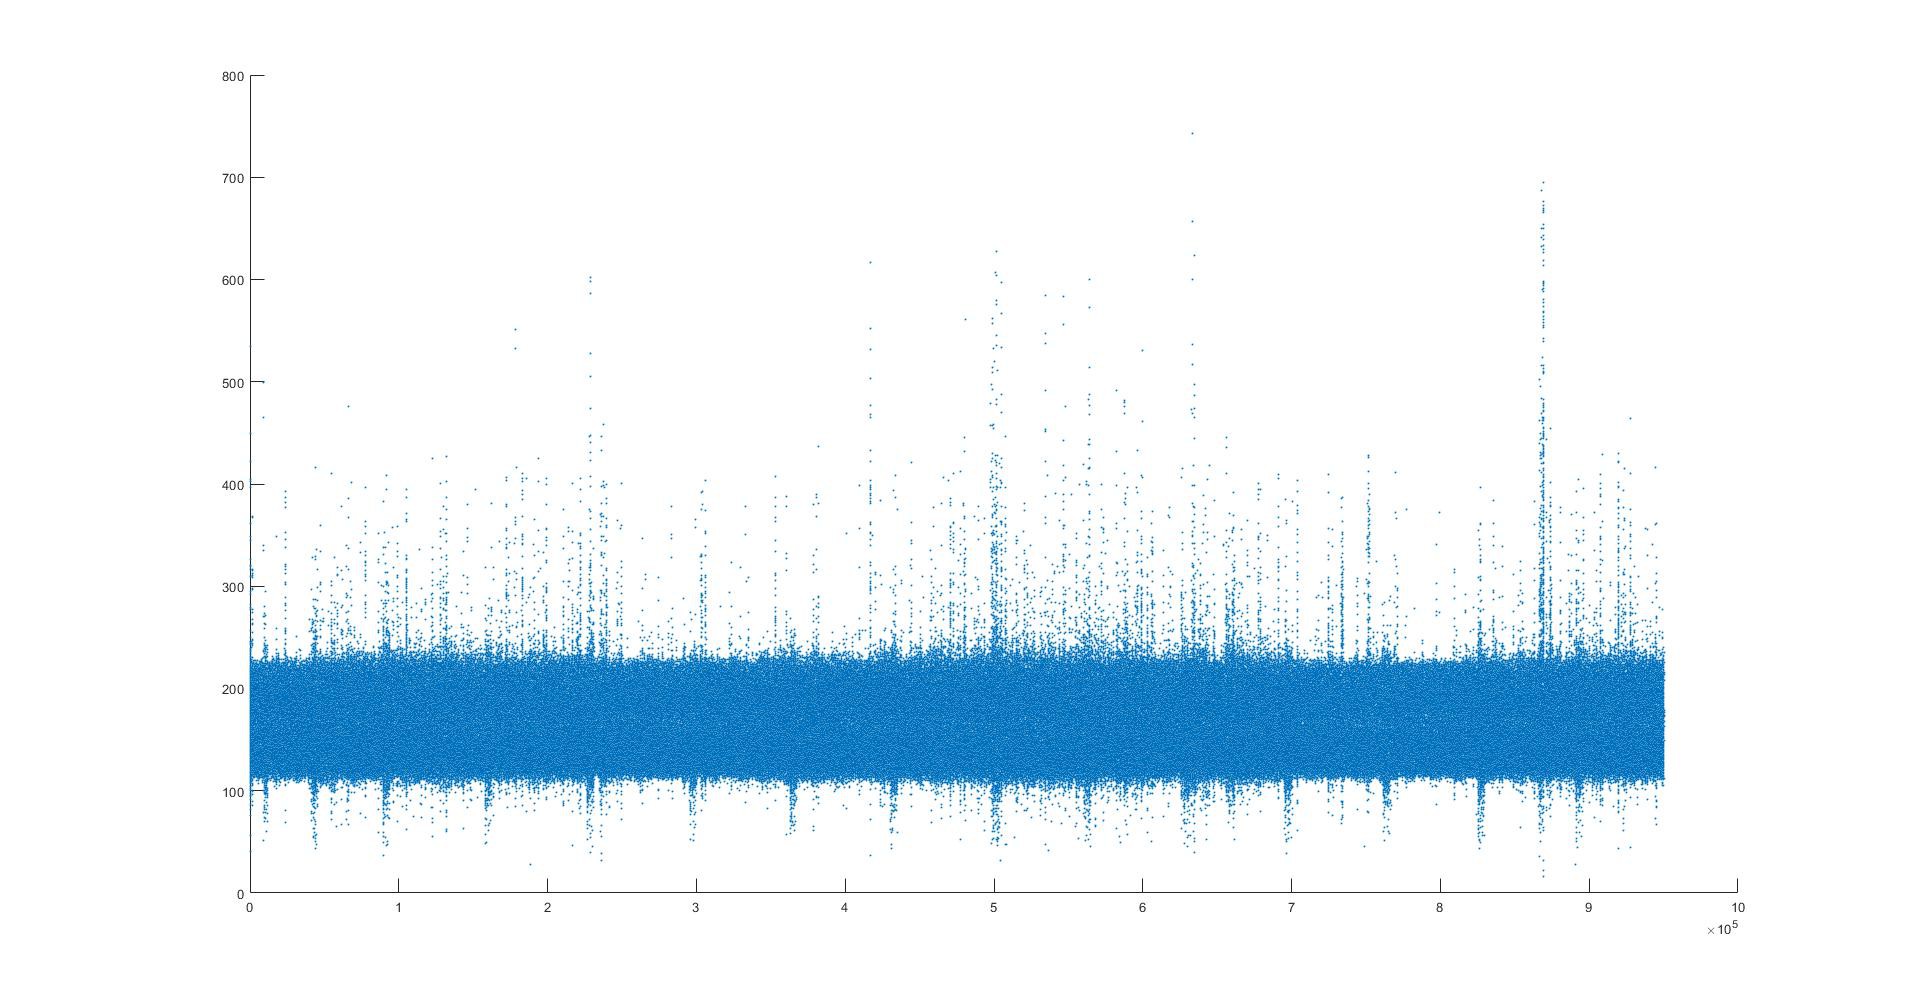
The following data is from August 11, 12, 13 and 14 hours of August 14. There are 950,579 data points included in these graphs. There was no significant human activity nearby during this time period.
CLICK ON ANY OF THE IMAGES BELOW TO ENLARGE
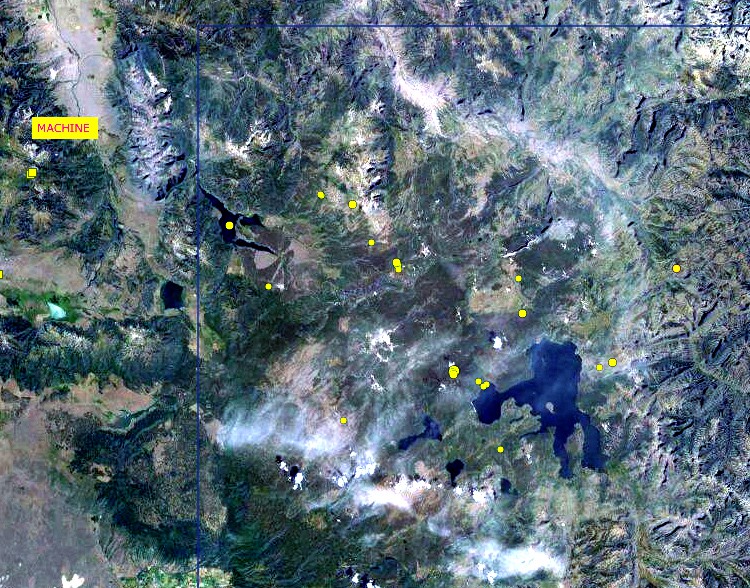
This image from the University of Utah website gives the location of the device in relation to the local geography. The large lake in the bottom right is Yellowstone lake in the center of Yellowstone National Park. The yellow circles and squares are small earthquakes recorded over the 2 weeks prior to this post. The majority of the small earthquakes are SouthEast of the device.
The two small earthquakes to the immediate SouthWest of the machine are less than 10 miles from it. These local earthquakes are analyzed in some of the images below. The initial event was preceded by major anomalous seismic noise activity. The aftershock 12 hours later was not as well predicted.
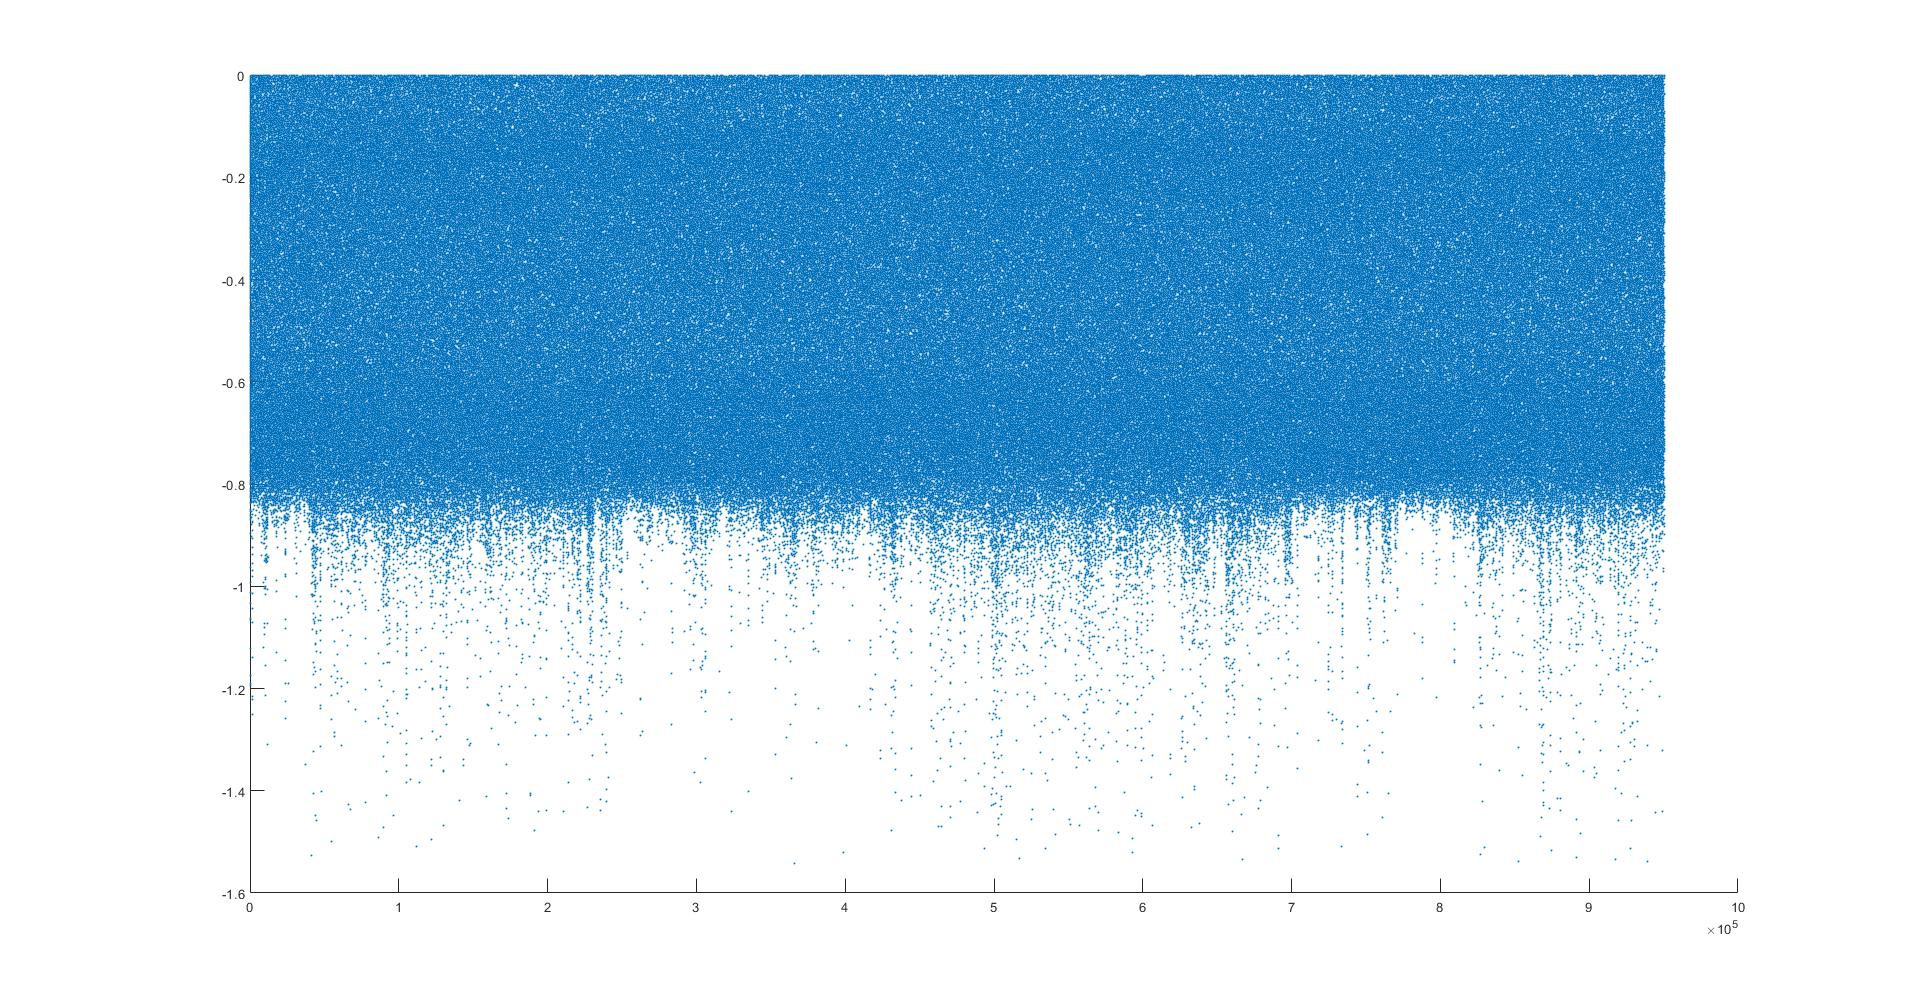
The next image shows the dot plot of all of the vector magnitude data points for this time interval. 724 vector magnitude units is full scale for this device because the Yun uses a 10 bit A/D converter (1024 bits) and the amplifier output is centered at 512 bits. (No vector will be greater than the square root of 2 X 512 squared.)
Two local events are included in this data. They were reported to be Richter magnitude 1.5 and 1.7 by the University of Utah seismic program. They were about 12 hours apart in nearly the same location (immediately below the "machine" label on the map above.)
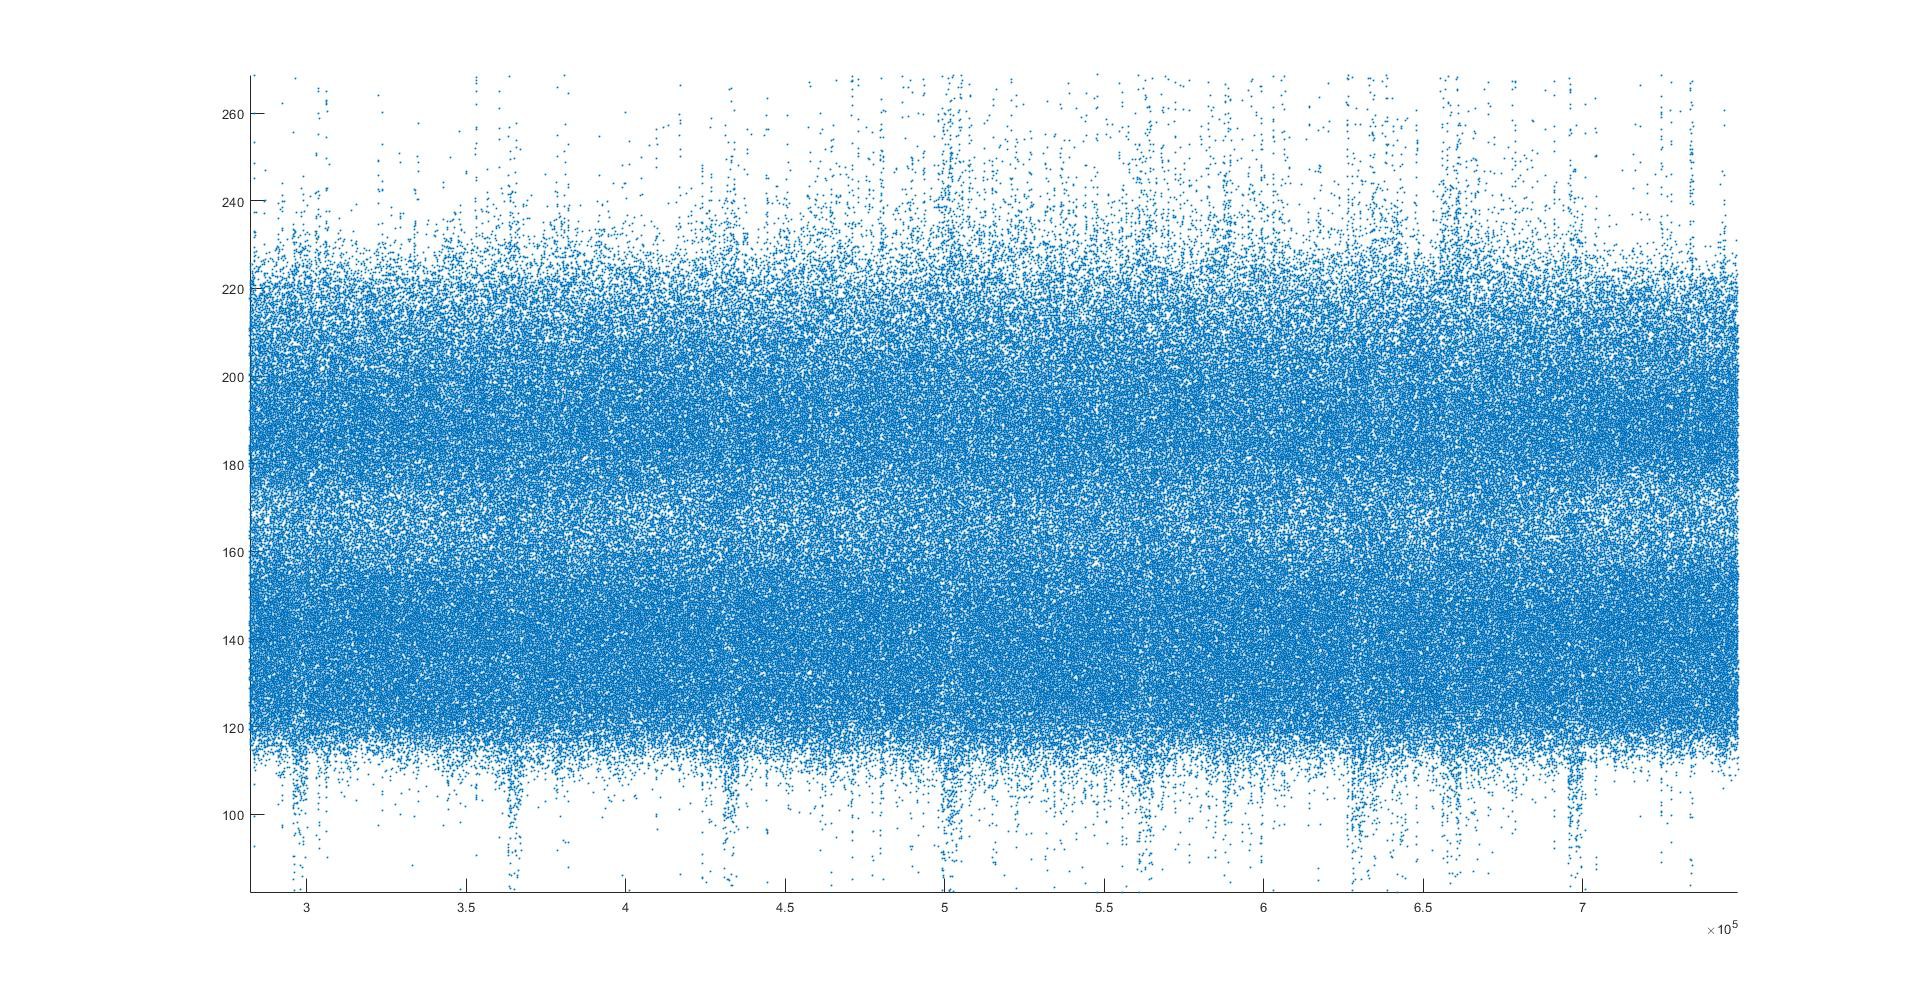
This is a zoomed in area of a portion of the dot plot above, showing a bimodal structure within the local noise. The repetitive signal is likely to be from a nearby pump. Even closer looks at this noise with moving mean averaging shows that a large portion of the overall noise is episodic - it is the composite of many small events. The bimodality seems to be clearly related to the fact that there are 2 sources of the noise - a constant, stronger noise from the Yellowstone area and the "global" noise from around the world.
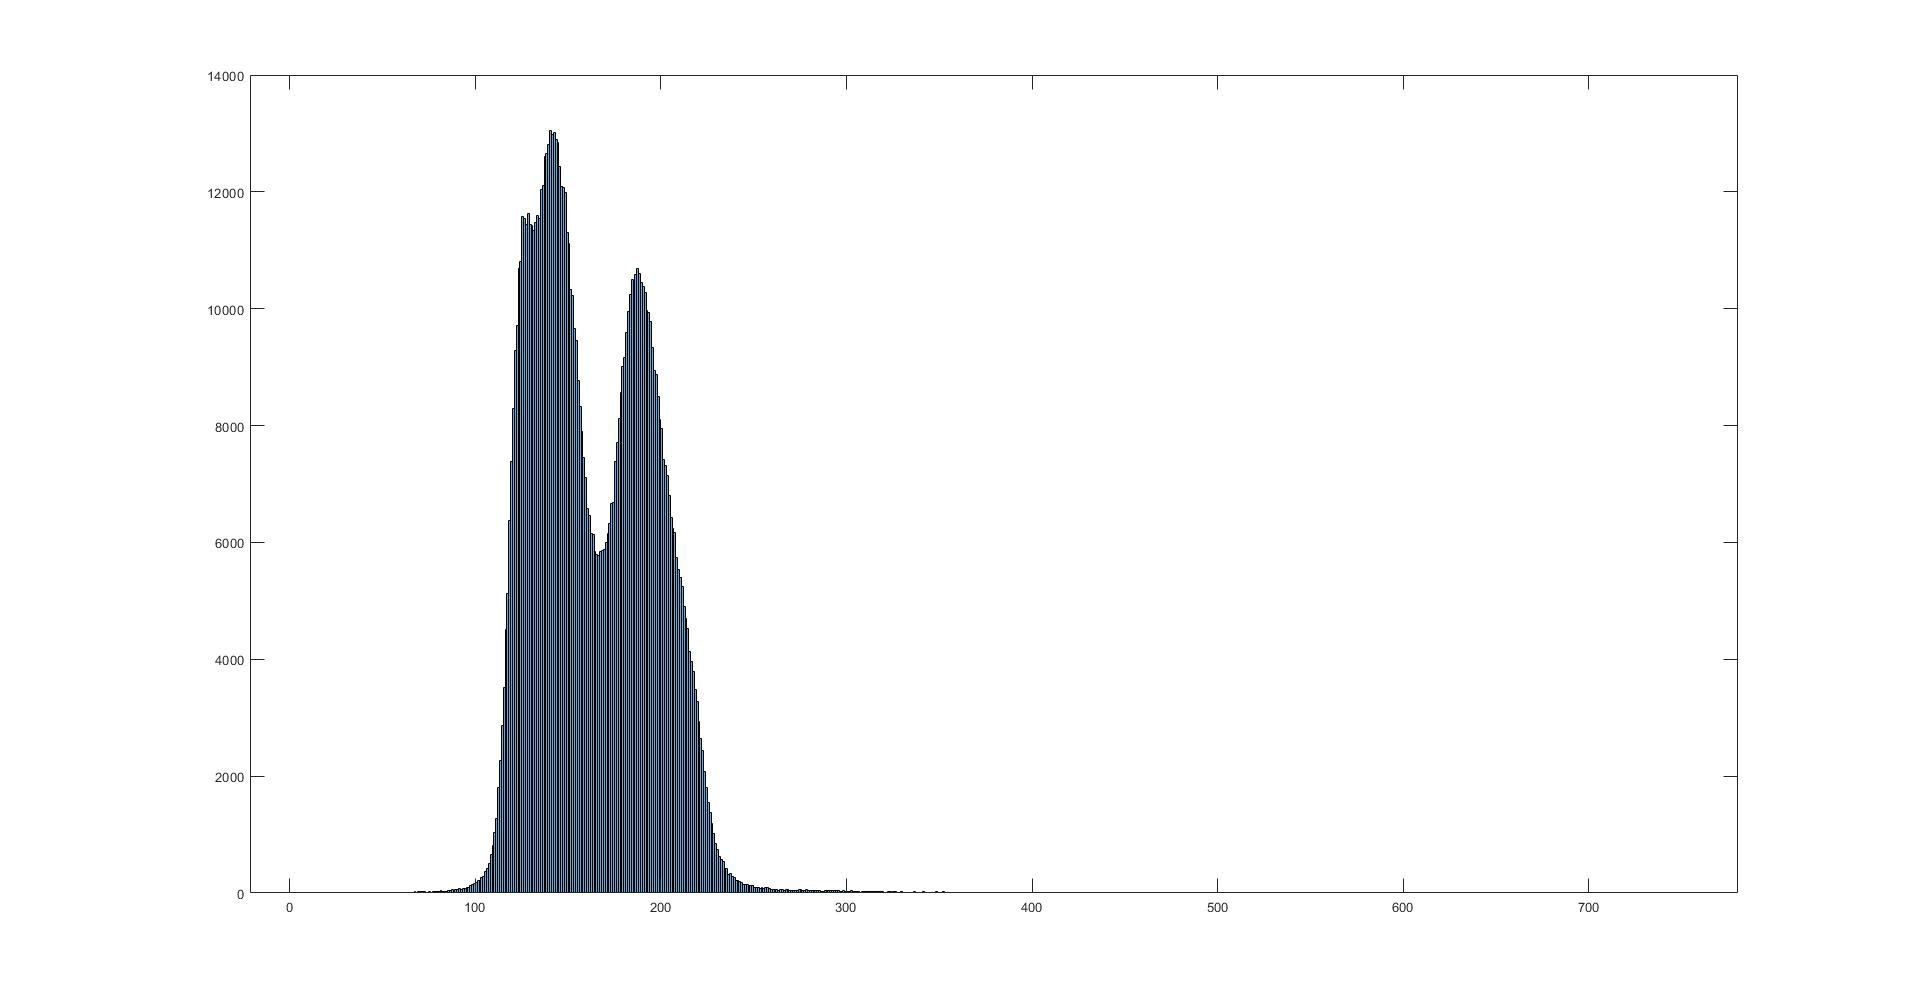
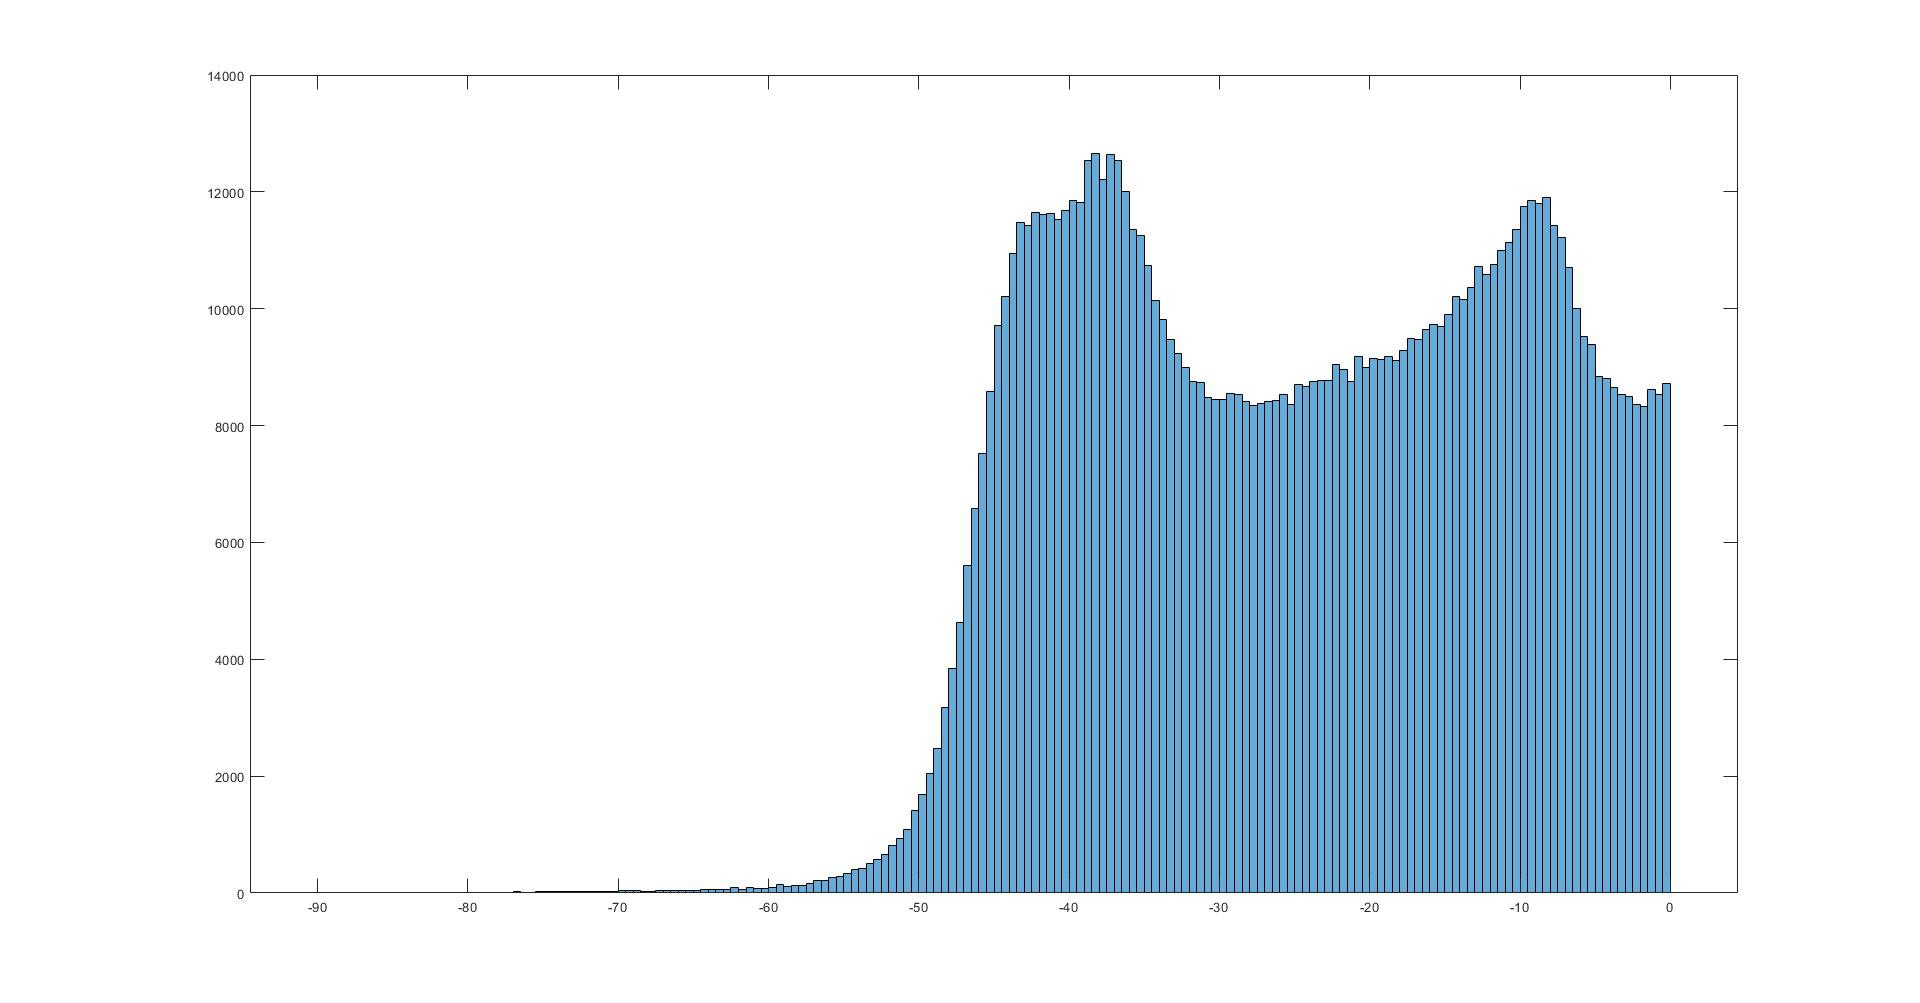
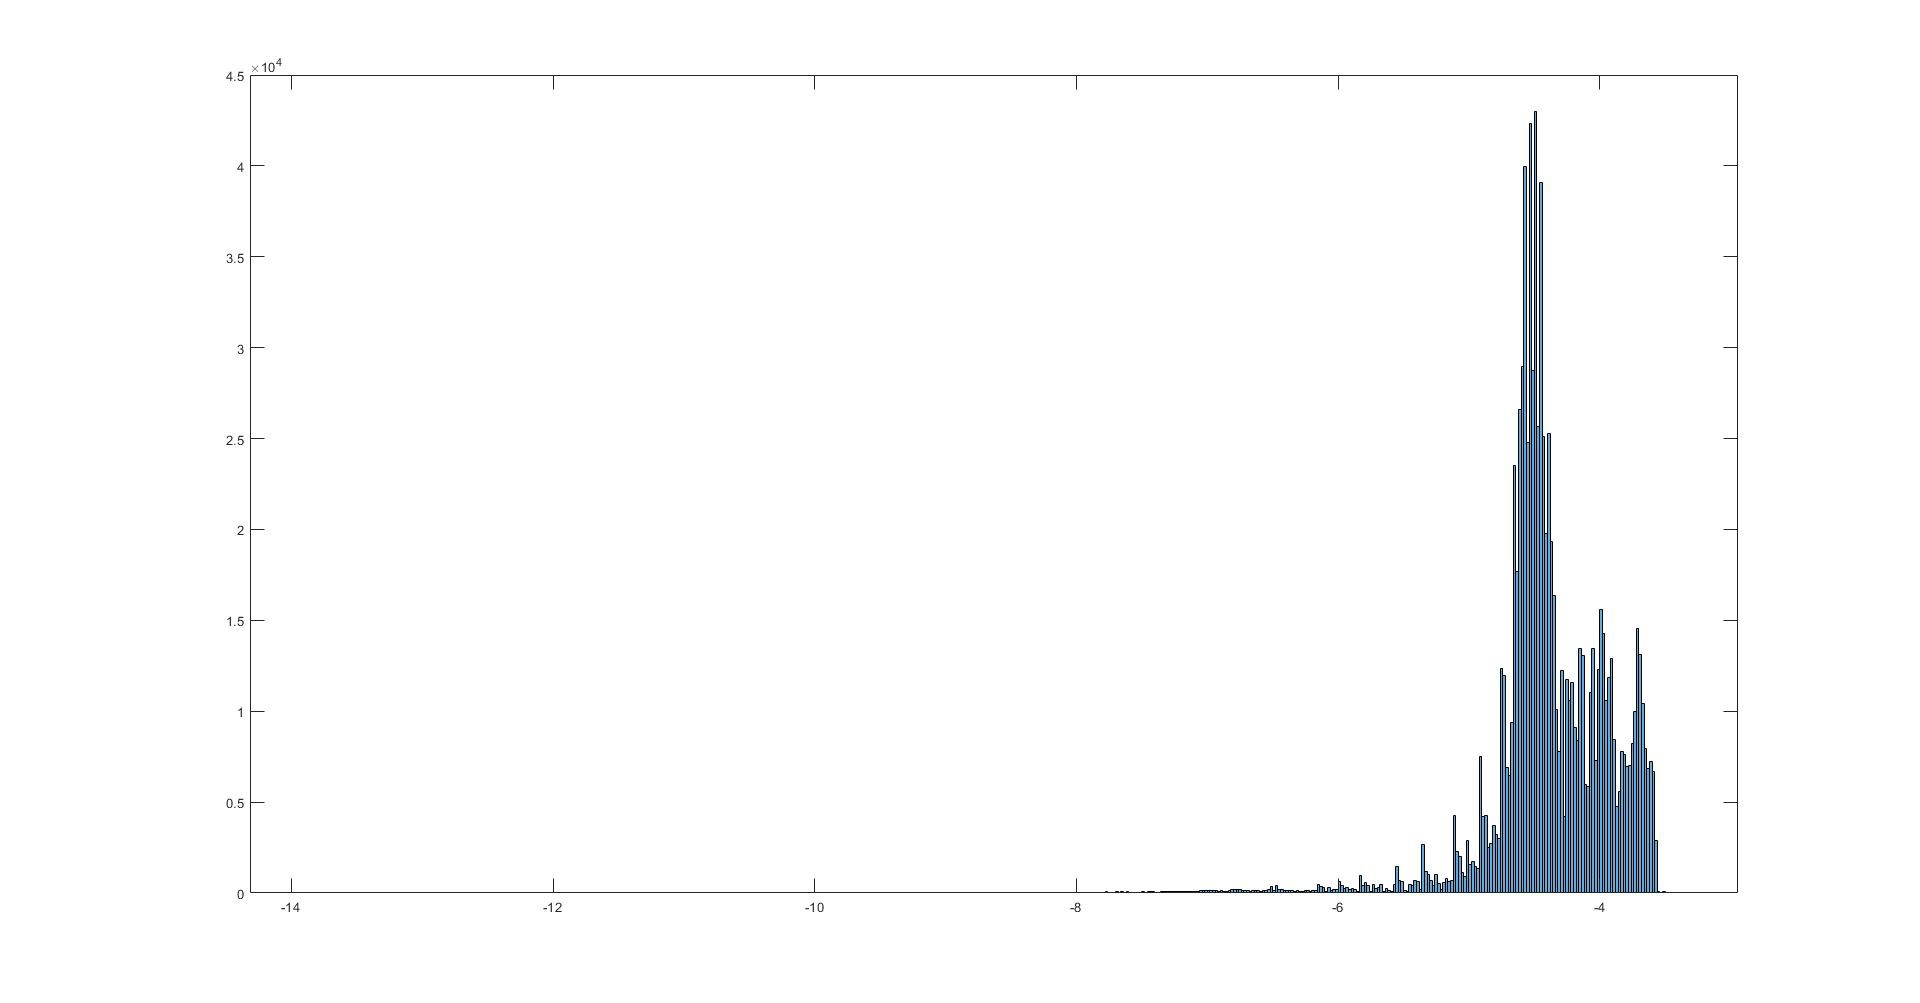
The following image is a histogram clearly showing the bimodal distribution of the vector magnitude values. I believe that the bimodality is related to the fact that about 60% of the seismic noise seen by this machine is from around the globe and about 40% is from Yellowstone caldera related events.
The next histogram shows the distribution of data points as a function of depth in degrees from the horizontal. 90 degrees is vertical - straight down. There is a bimodal distribution seen here as well.
The next image shows a dot plot of the depth measurements. Due to the density of data points, the bimodality is harder to see in this format.
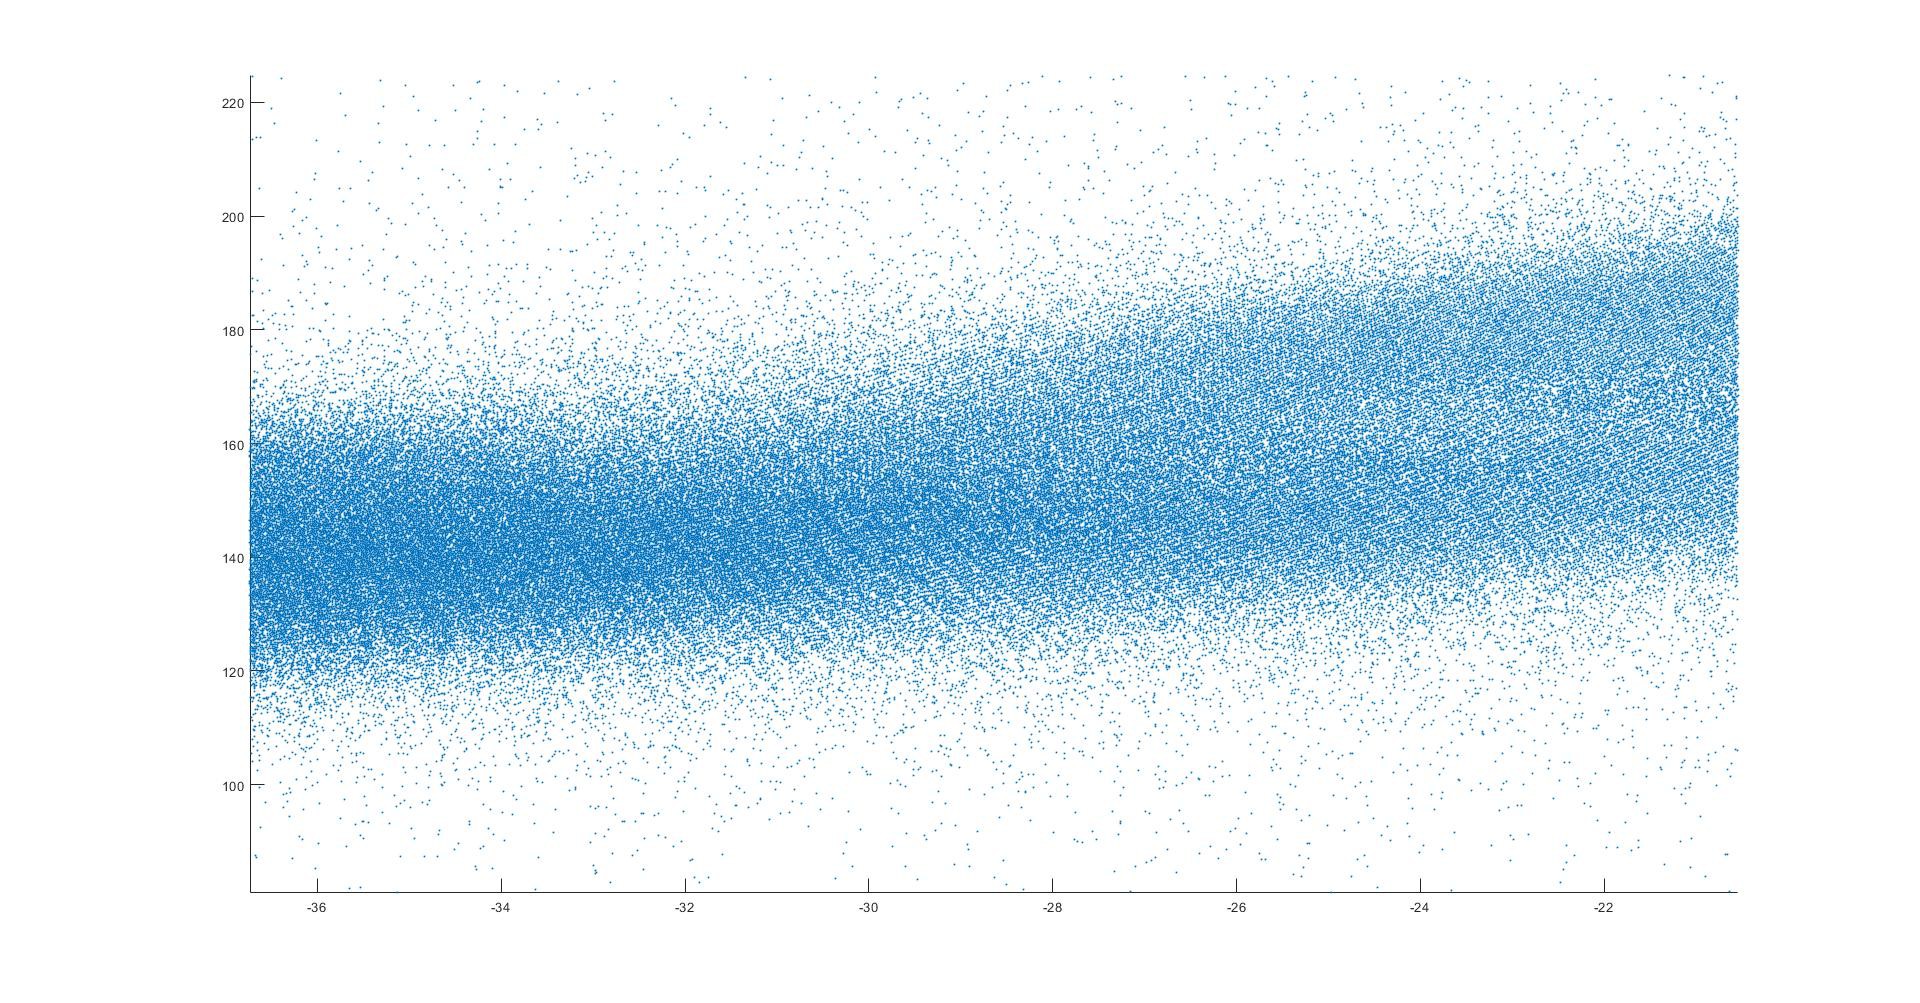
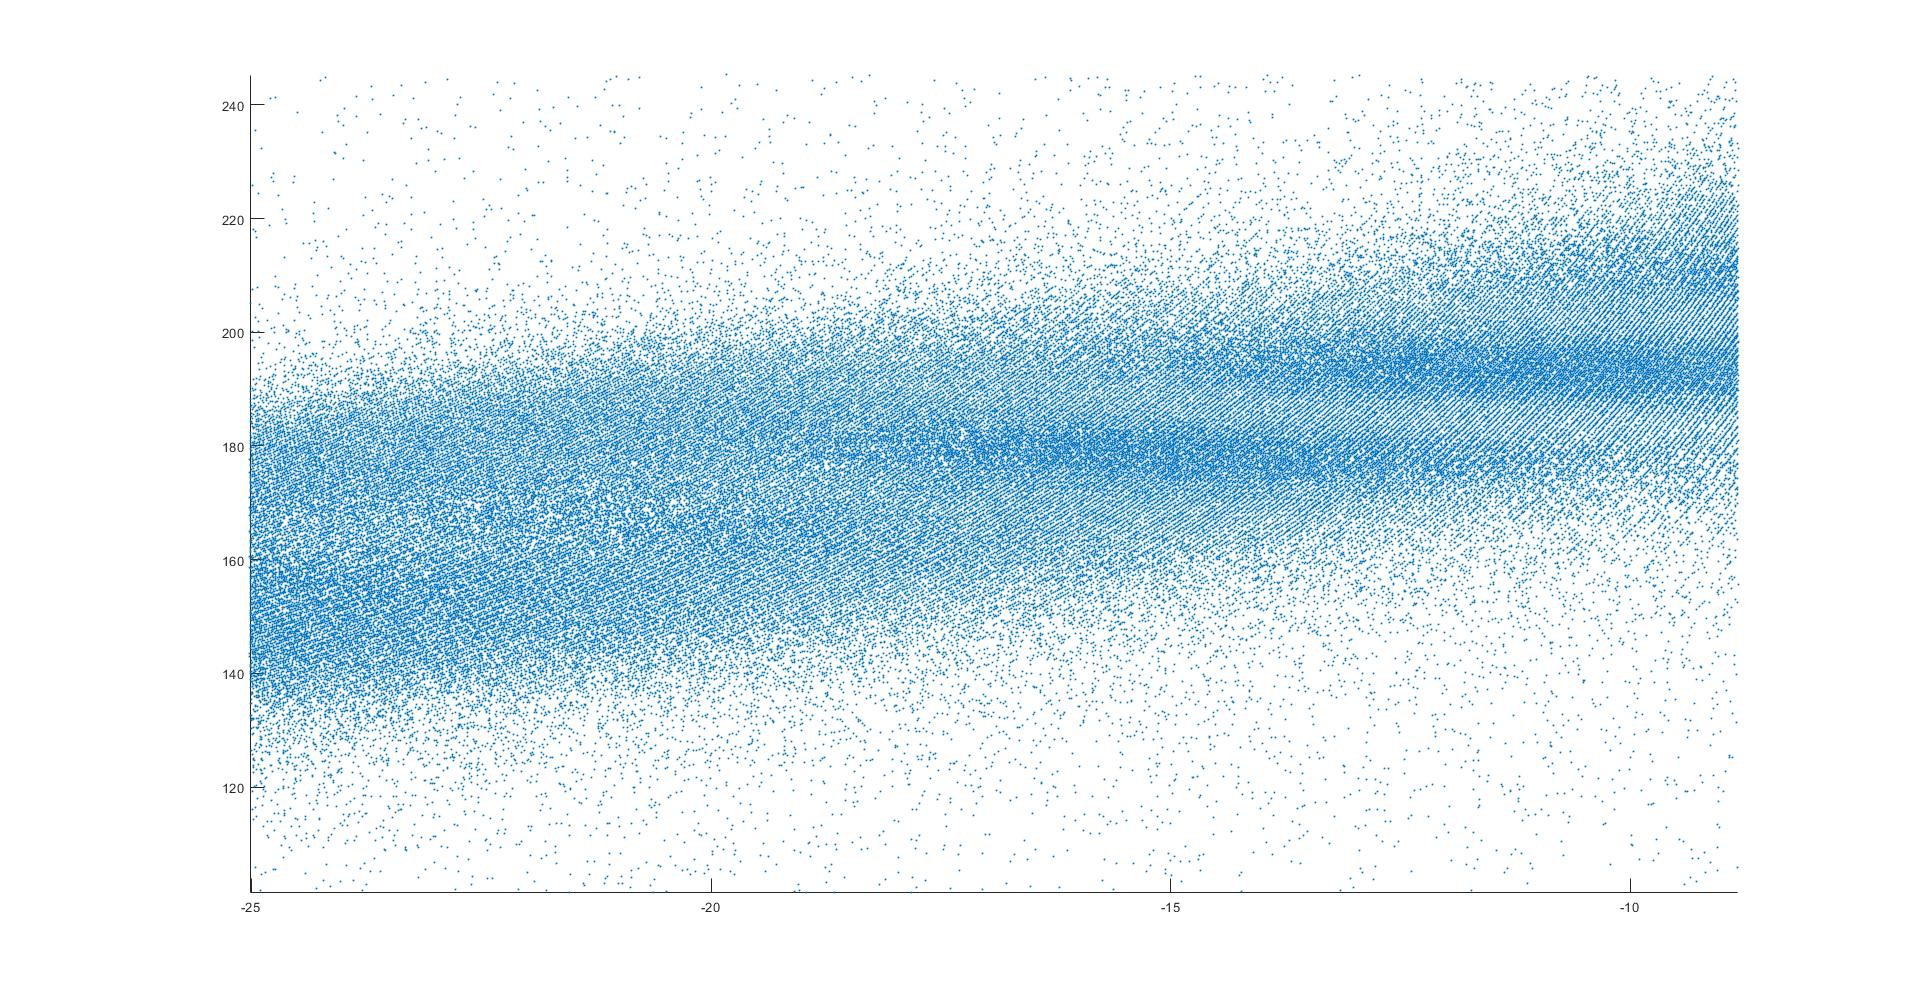
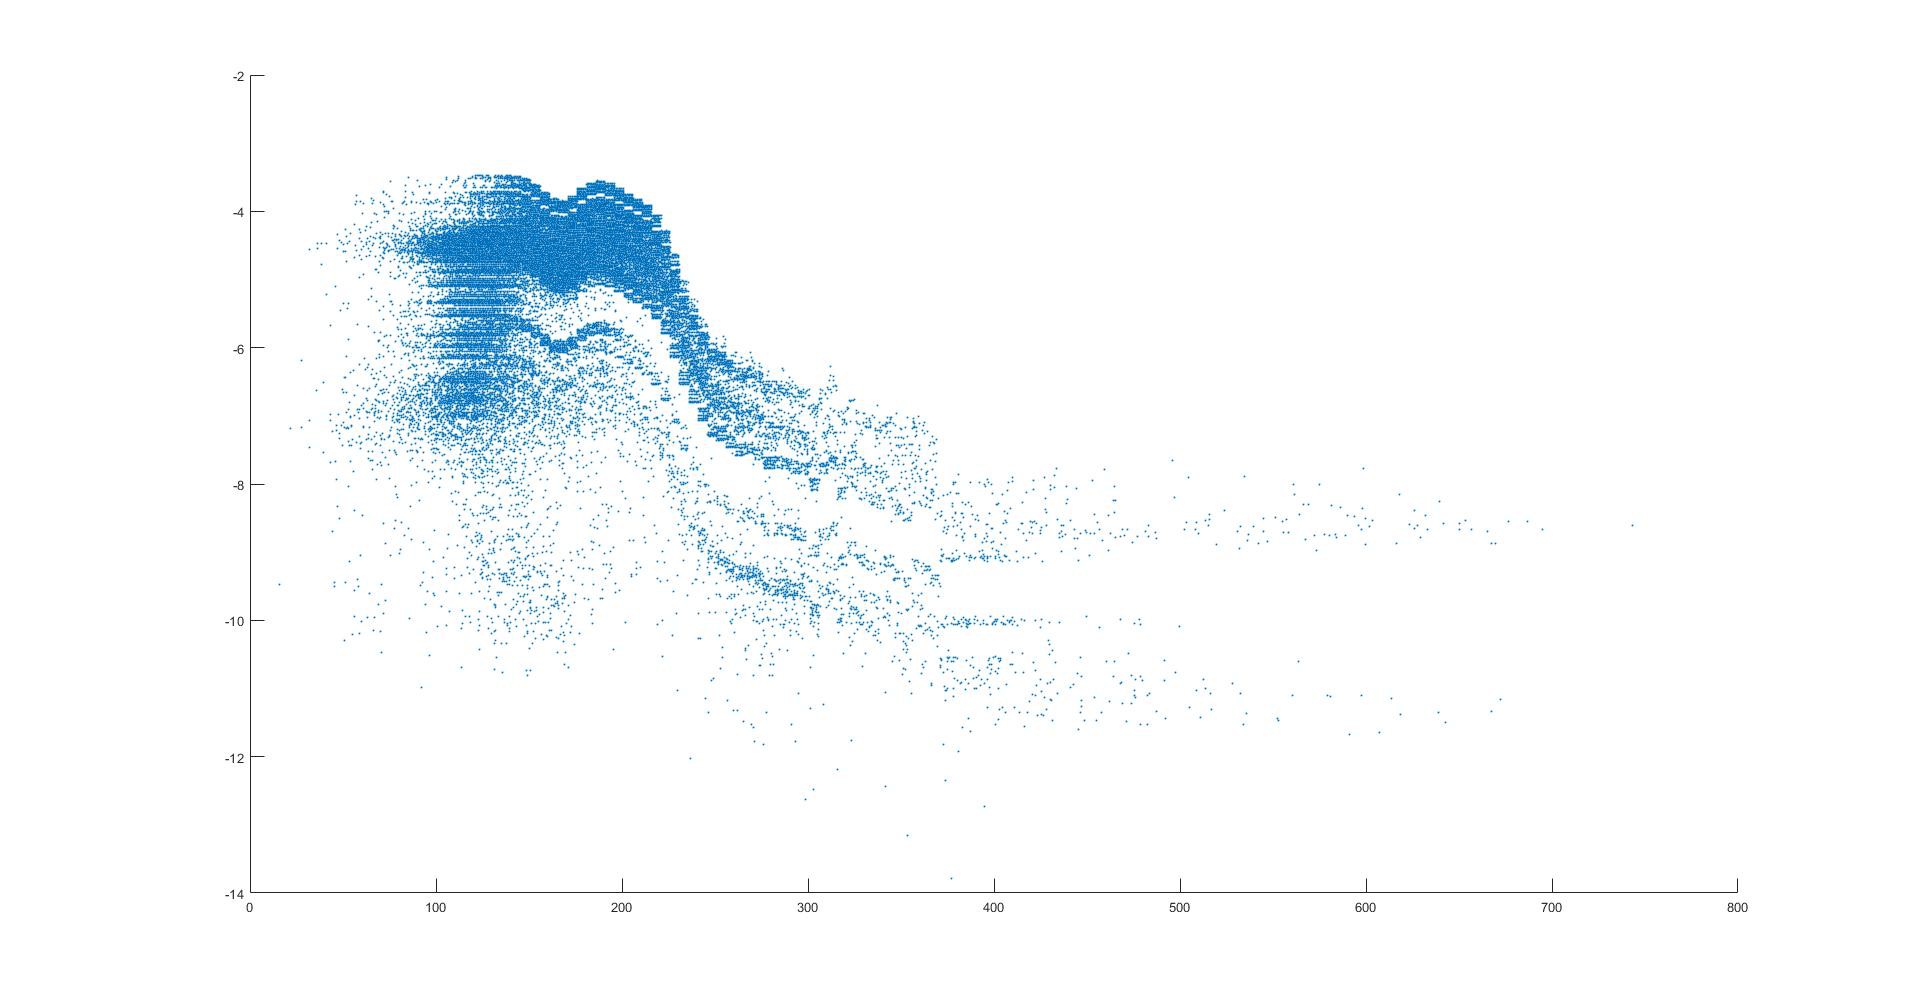
How does depth relate to vector magnitude? The next image shows this dot plot. There is a trend toward decreasing vector magnitude with increasing depth.
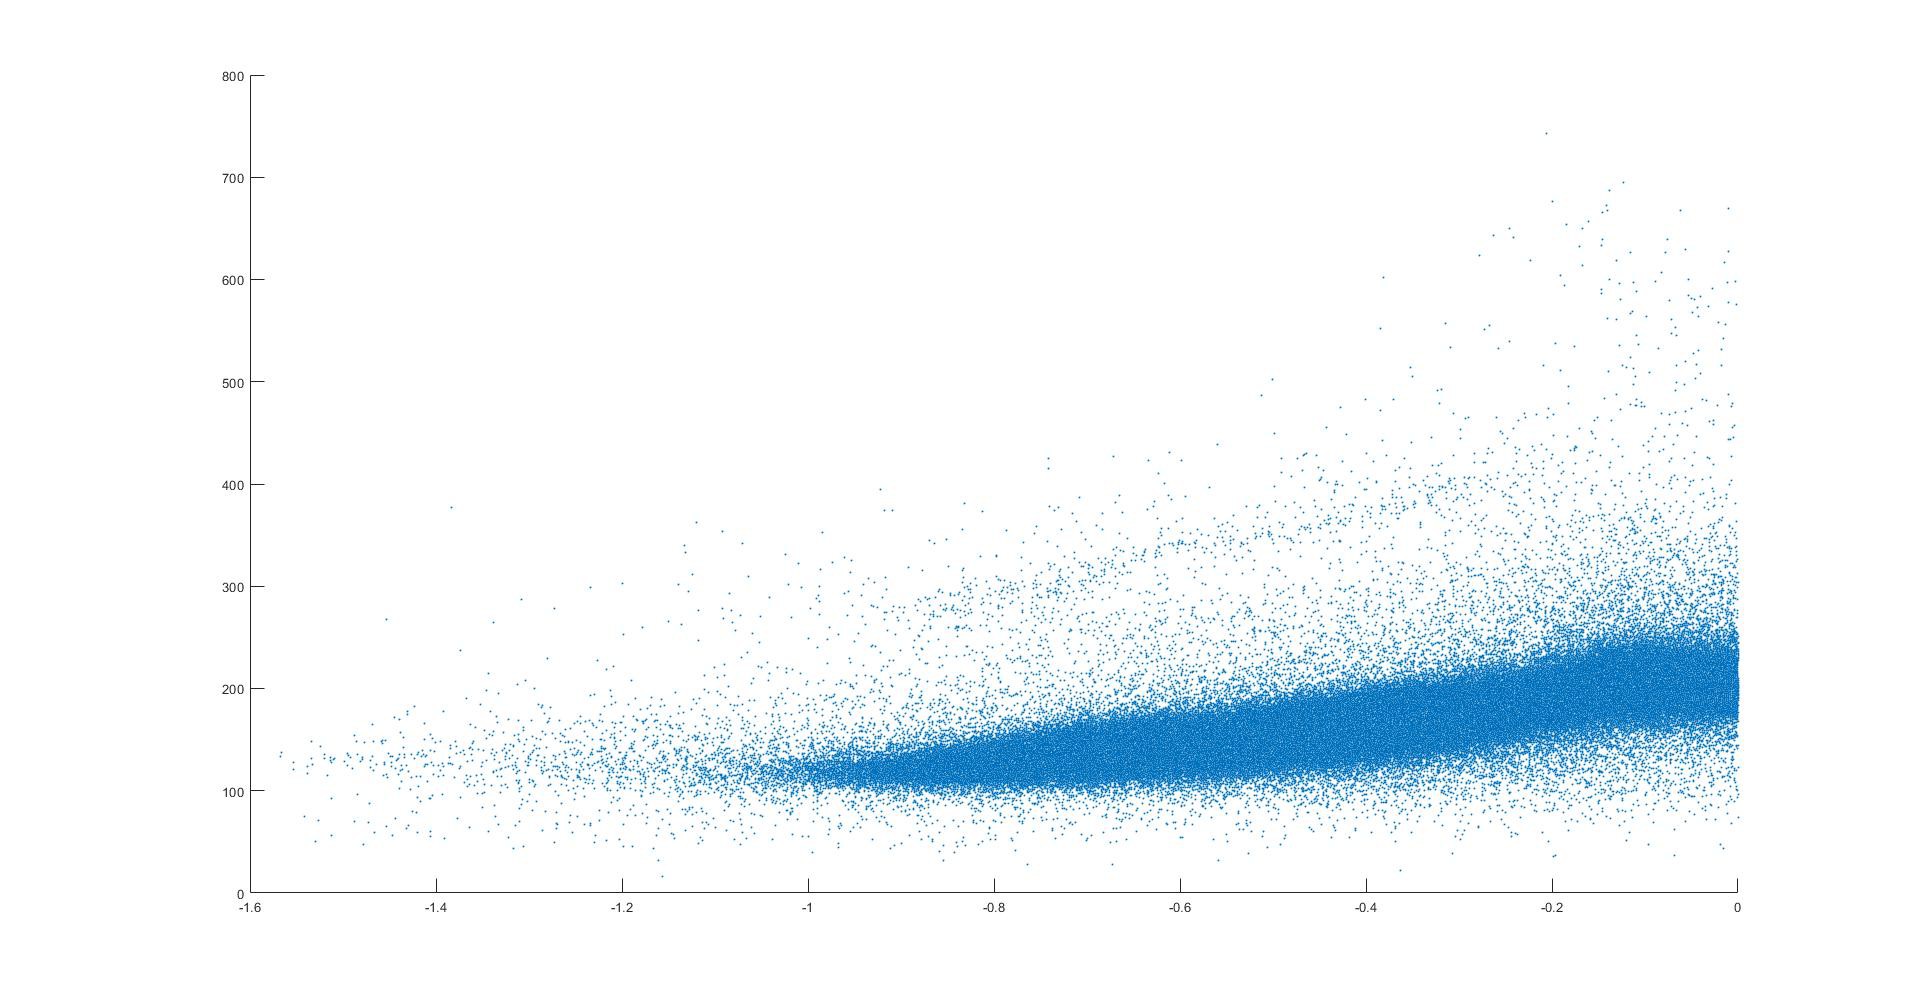
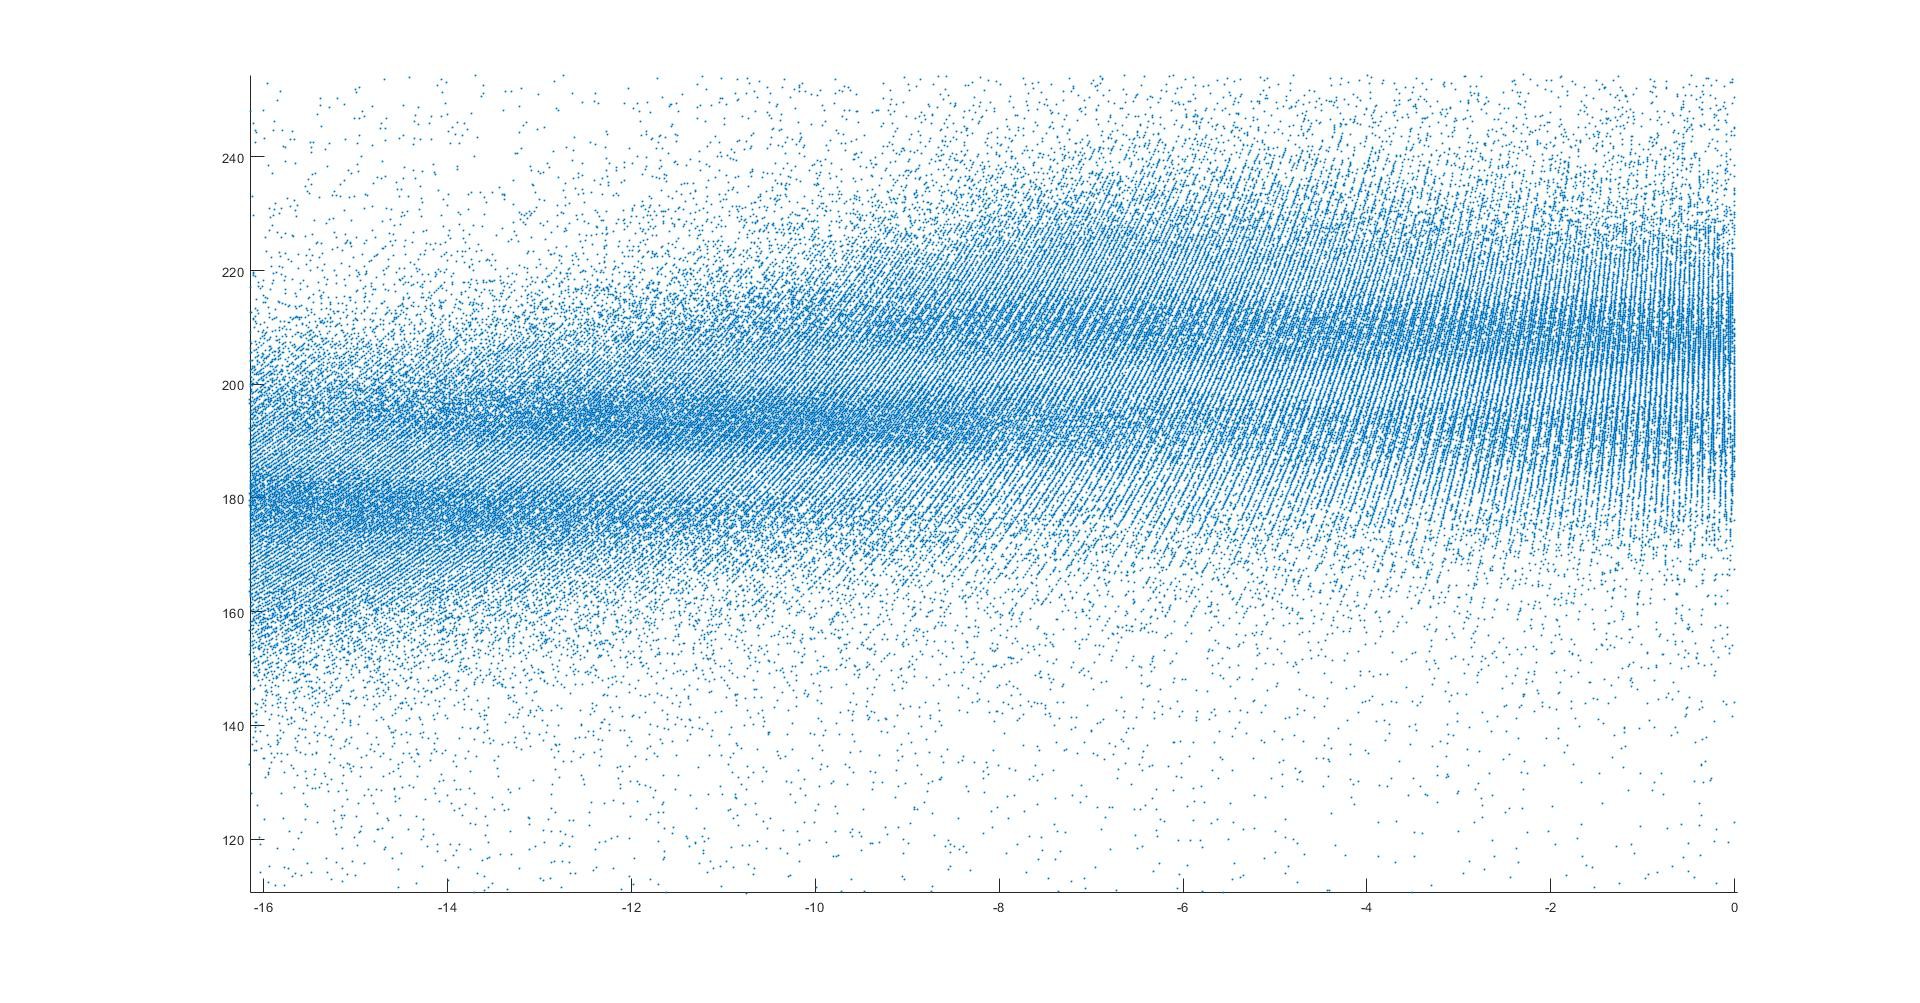
On closer look, there appears to be some unexplained fine structure in this data. The next 3 images are zoomed in views of this fine structure. The closely spaced parallel "lines" are probably the result of the coarseness of the 10 bit analog to digital converter in the Yun device, but there seems to be something larger happening as well.
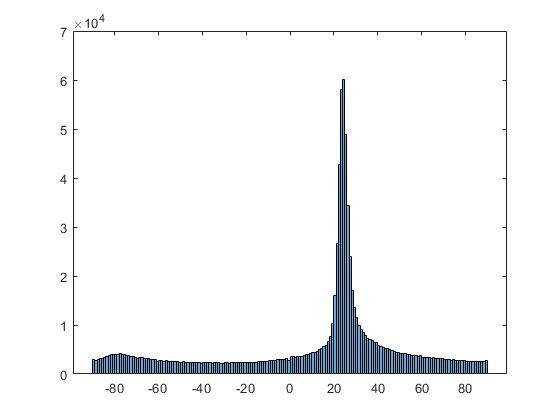
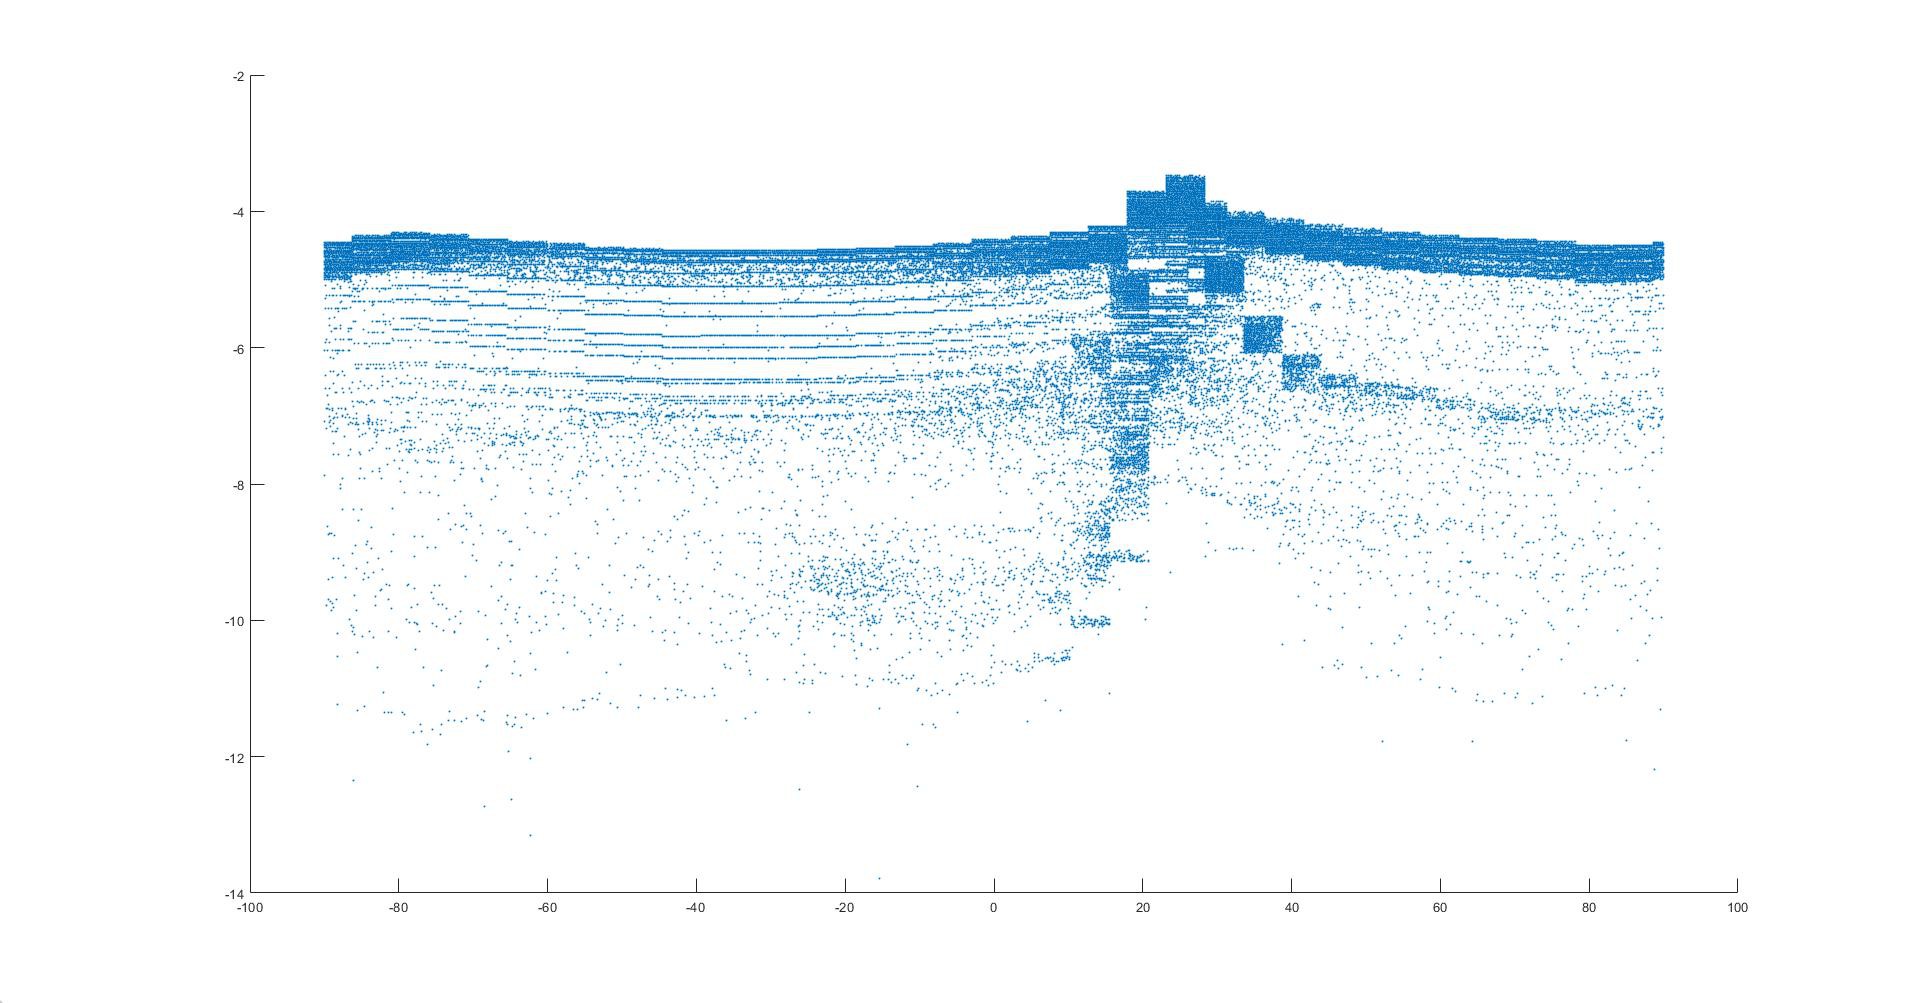
The next image shows a histogram of the data points as a function of each vector's compass axis. Vibrations in the East - West line are on the -90 or +90 axes, vibrations on the SouthWest - NorthEast line are on the "-45 degree" axis, vibrations on the NorthWest - SouthEast direction are on the "45 degree" axis,, etc. A vibration exactly on the North - South line would be assigned to the 0 (zero) axis.. The peak of the histogram is +24 degrees - this is aligned very closely with the line between the machine and much of the macro-seismic activity as depicted in the University of Utah image above.
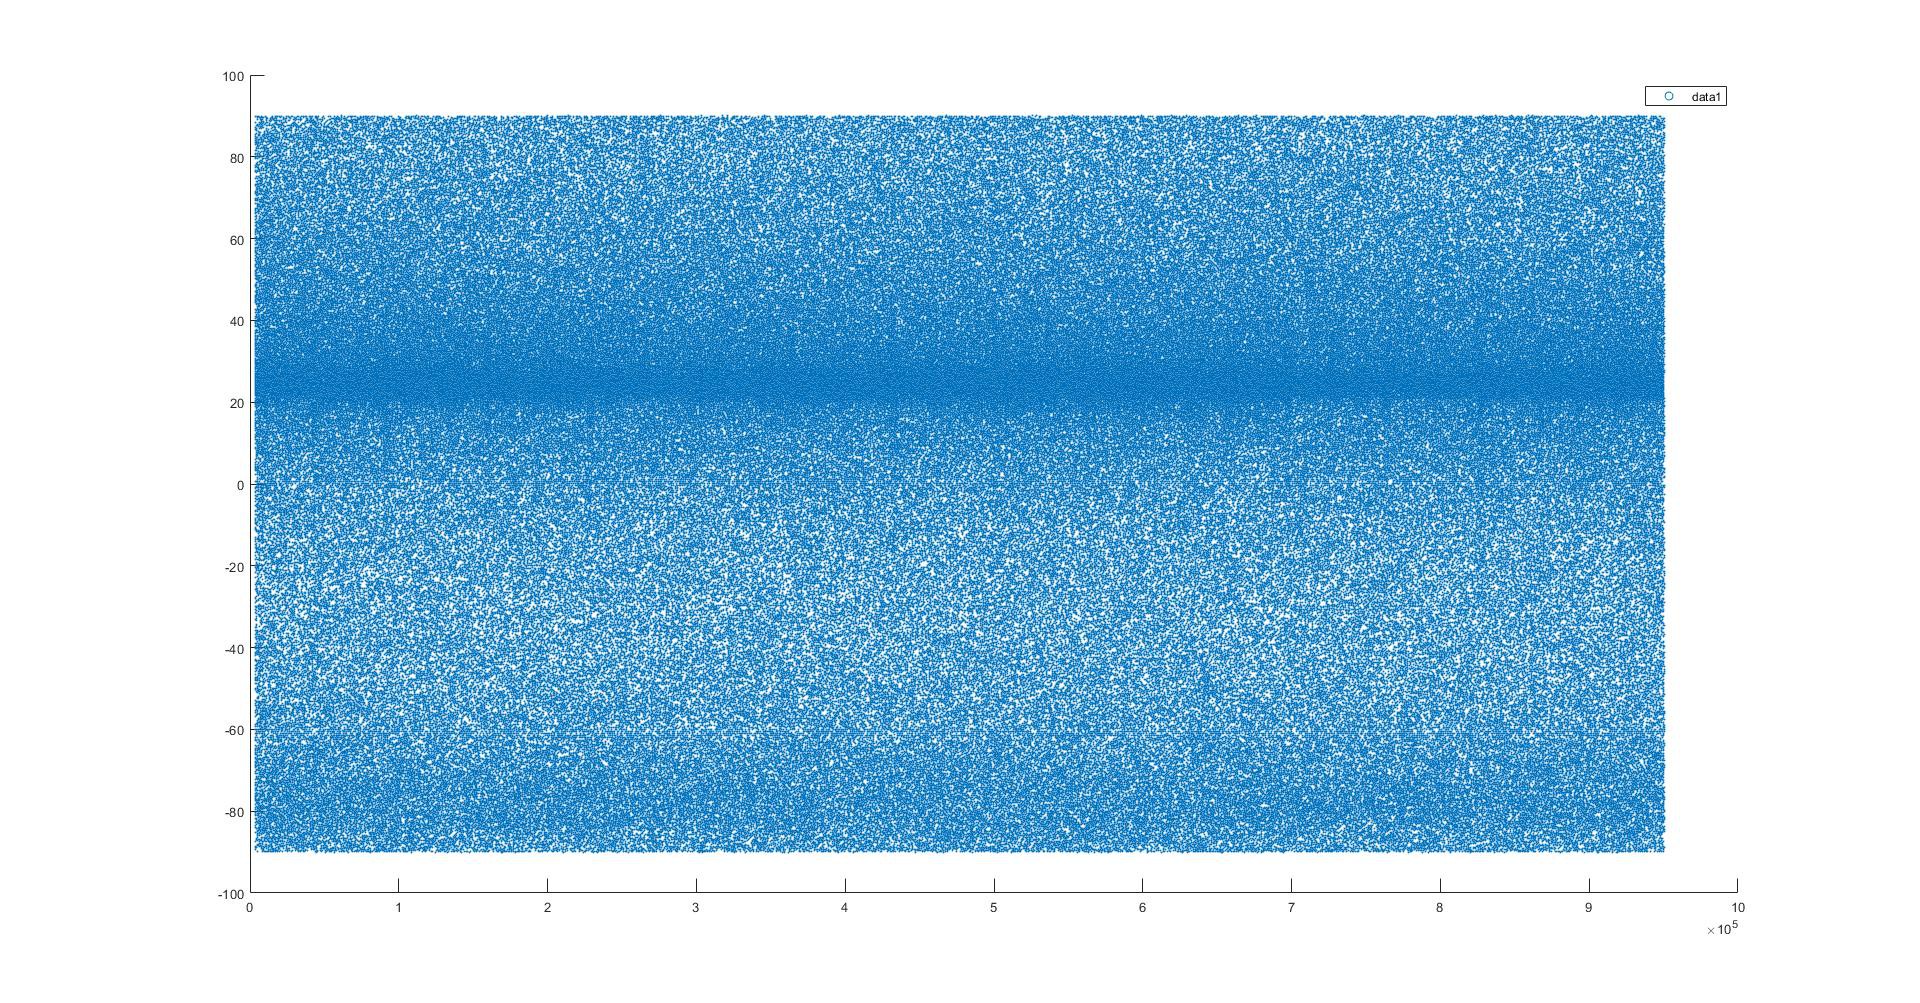
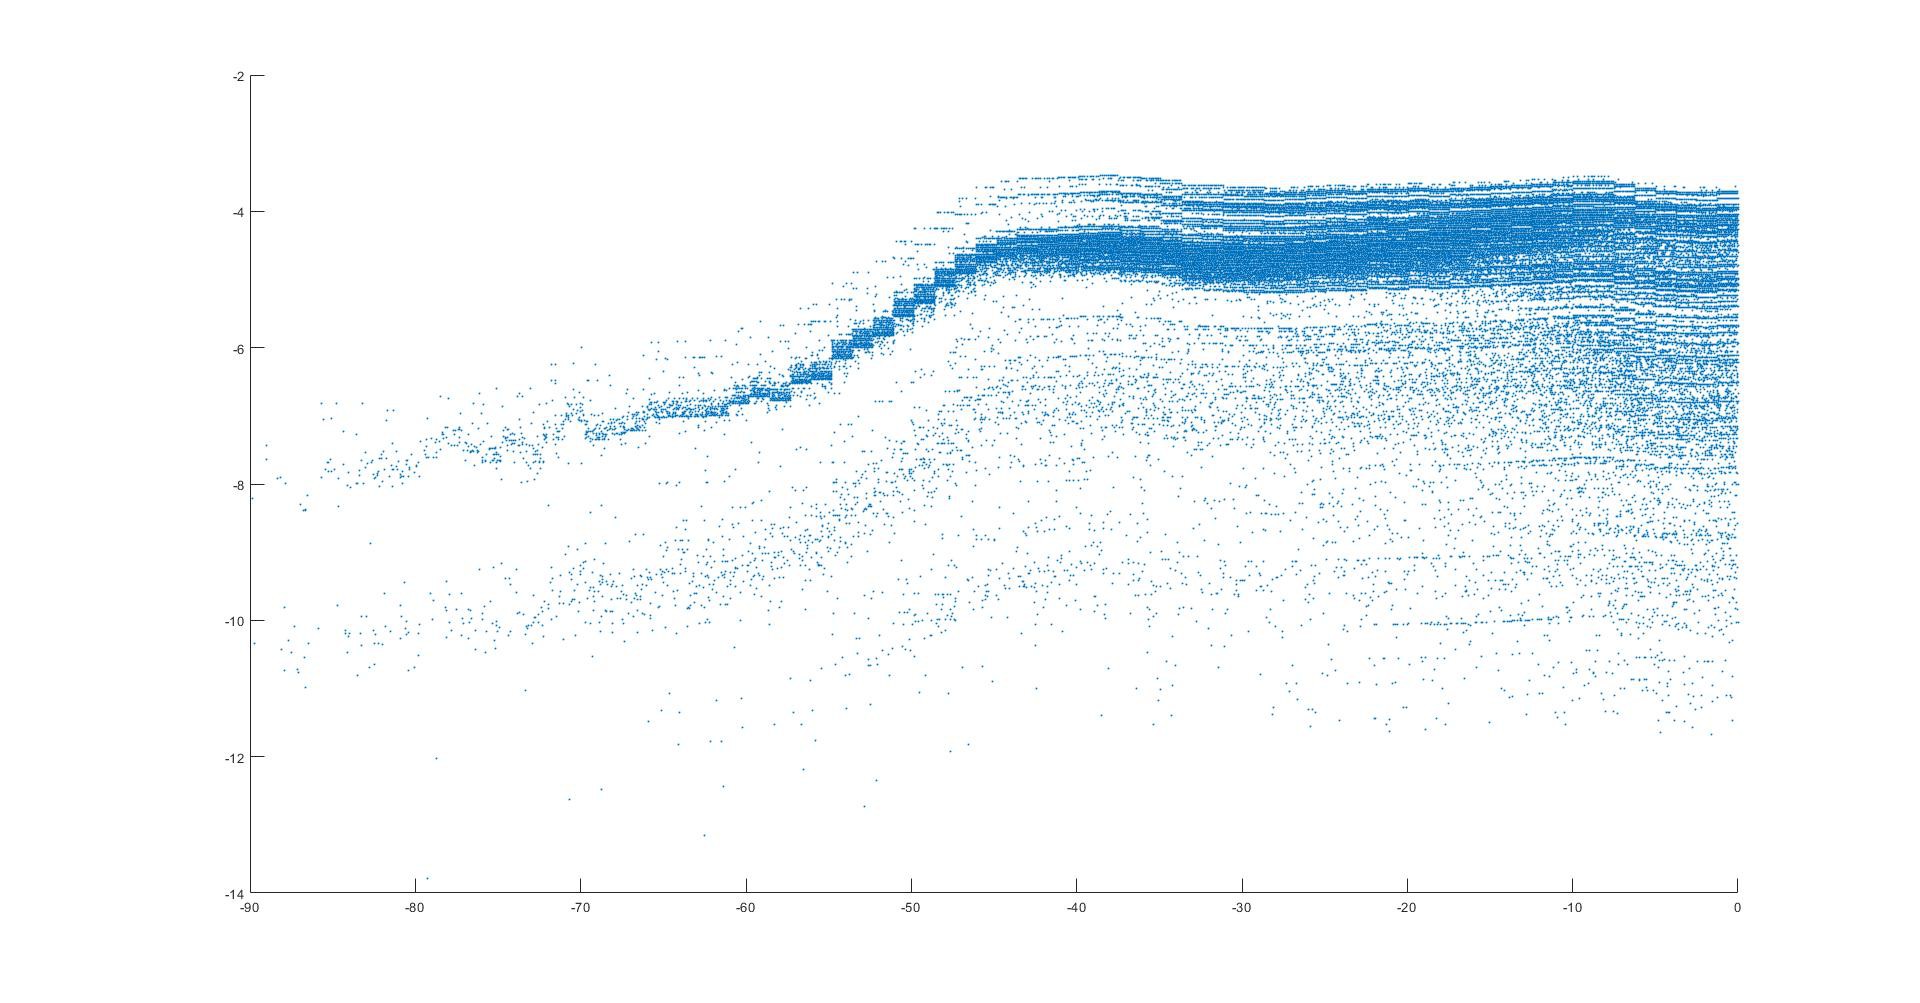
The next image is simply a dot plot of this same data. The seismic noise originating from the Yellowstone hot spot is amazingly consistent on this time scale.
How does the vector magnitude of the noise vary with axis direction? There is a faint "spur" in the data. Is it possibly related to distant activity in the Idaho seismic hot spot to the West?

The device saves the combined probability of each data point as well. It is on a logarithmic scale and it is the product of the individual probabilities of the vector magnitude, depth and axis of each data point. Here is a dot plot of the combined probability of each point in the data set. The horizontal lines are the result of the granularity of the "bins" in the probability matrices for the measured parameters. The two very local events pegged out at 10^-12 (one in a trillion chance that they were just noise, in other words.)

The next image depicts a 10 data point (4.1 seconds) moving average of the same data - it smooths out the horizontal banding but still shows the episodic nature of the low probability events.

Here is the histogram of the combined probability parameter.
How do the 3 measured parameters (vector magnitude, depth and axis) relate to one another? The X axis is horizontal vector origin axis, the Y axis is vertical vector origin depth and the Z axis is vector magnitude.

Here is the relationship between vector magnitude and the calculated combined probability statistic. The complexity of this graph is related to the input of the axis and depth probabilities to the combined statistic. The granularity of the chart when zoomed in is related to the limited number of probability bins (75) that the memory of Yun device will allow for each component of the combined probability
Here is the relationship between axis in degrees and combined probability statistic.
Here is the relationship between depth in degrees and the combined probability statistic.
Here is a 3D plot of the combined probability statistic (Z axis) vs. axis (Y axis) vs. vector magnitude (X axis.)

Here is a vector magnitude plot of the recent Richter magnitude 1.5 earthquake event about 10 miles from the machine on August 11 at 18:36:08 MDT. The event time is marked with a red box.
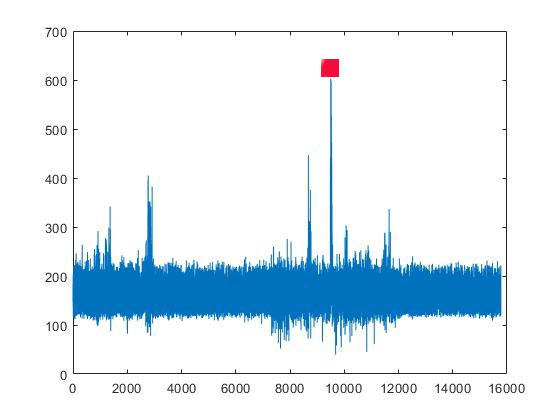
Here is a zoomed in view of the same data.

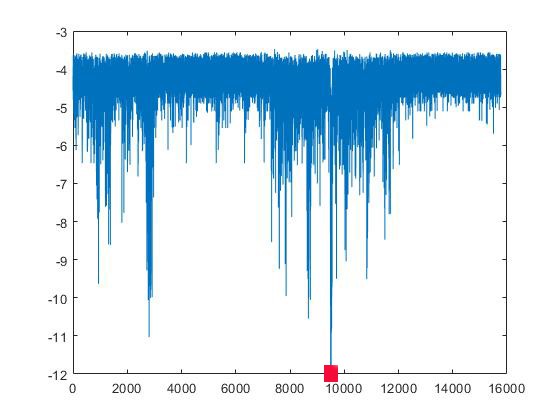
This is the plot of the NEARBY August 11 event's combined probability data. There is a considerable amount of activity before and after the event that does not appear in the magnitude data alone.
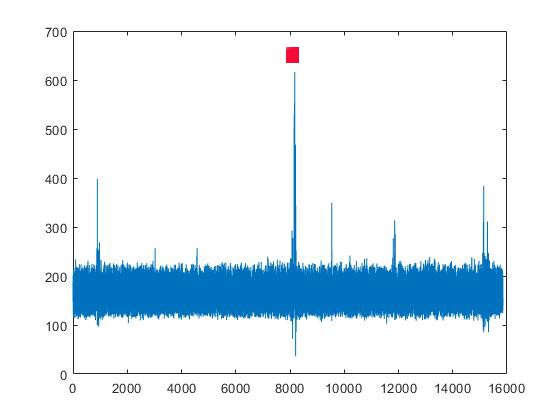
This is a plot of the vector magnitude data from the Richter magnitude 1.7 earthquake on August 12 at 06:30:40 MDT about 10 miles from the machine.
The combined probability data from this event:

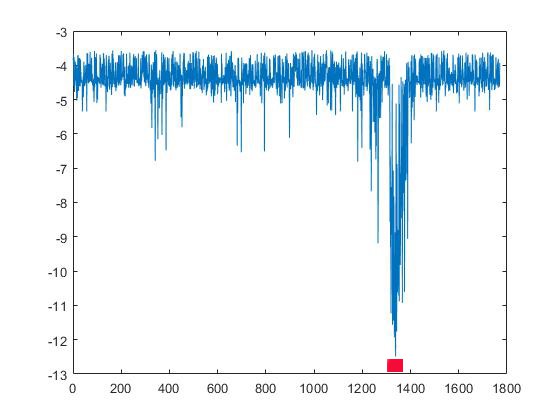
Here is a zoomed in view of the probability data from that event. There is less surrounding activity than the initial event 12 hours before at the same location.
Fiber optic internet service will be available soon in the Madison Valley and this will allow for storage and analysis of data on a remote server, which will greatly increase the data output, The next stage of development will eliminate the computational limitations of the Arduino Yun device and its SD card storage medium.
The recent software improvements have led to much more resolution and a better definition of the seismic noise at the site of the device. Migration to an off-site processor with a better speed and memory capacity will eventually allow for more refined probability matrices (maybe 250 "bins" or so, resulting in less granularity in the probability calculations.) This should make for better understanding of the ambient noise on a second to second basis. This in turn will enable processing of the data from multiple devices as well, allowing for calculation of the absolute location at the intersection of tremor axes.
There continue to be strong hints that clusters of seismic noise vector analysis machines like this may one day be able to predict at least some local earthquakes.
Discussions
Become a Hackaday.io Member
Create an account to leave a comment. Already have an account? Log In.