Close
0%
0%

Heimdalr, Multi-Mead-Watcher

A low-cost monitor for many simultaneous fermentation vessels.

Similar projects worth following
Heimdalr is a system for logging and visualizing the fermentation progress of many simulataneous fermentation vessels in near-realtime over an extended period at minimal cost.

Brewing mead is a great hobby because it's fun to do, and at the end there's booze.  Lately I've been experimenting in an effort to find the perfect recipe.  I typically have 8 or more one-gallon fermenters going at one time, each one with slight variations on the same basic recipe: for example, the same basic ingredients, but each with a different strain of yeast.

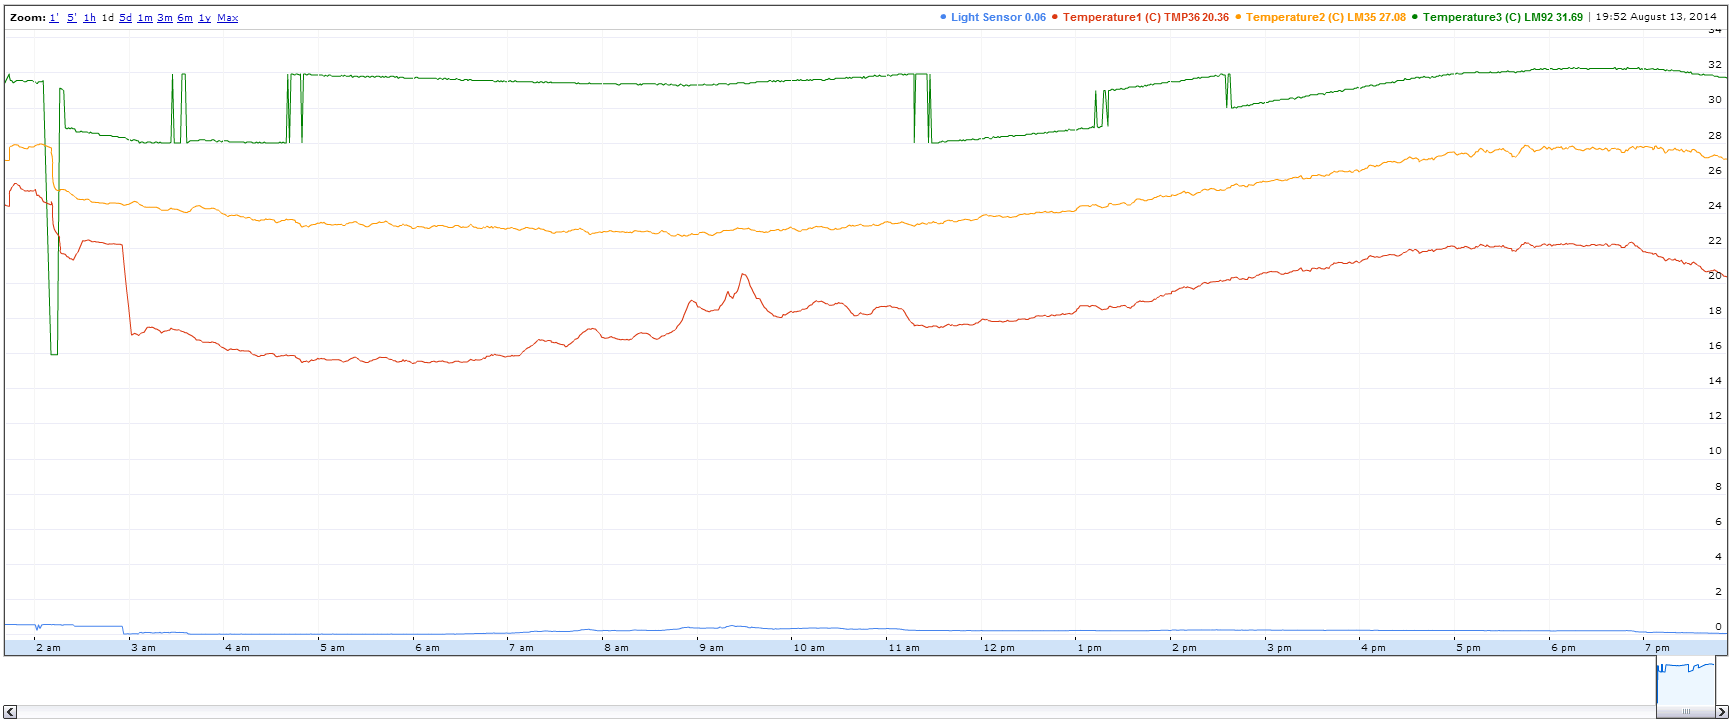
I love data, and I like to record as much data about my brews as possible.  Manually recording the temperature and bubbling rate for every one of the 8+ fermenters is tedious and error-prone, so I decided to set up a brew monitor which could tell me temperature, bubble rate, and other parameters of the brew in real-time.  It could log the results and give a graph of the progress of the brew over time.

There are several other brew monitoring projects out there, but most of them have flaws.  The BrewNanny is one of my favorites, but it has two major problems.  First, the battery is only designed to last for a few weeks.  For mead the sensor has to run continuously for months at a time.  Second, it's a reasonable price if you only need one, but to monitor 8 fermenters I would need to spend over $2000!  Heimdalr was designed to scale easily up to 12 simultaneous fermenters (or more!) at minimal cost, hopefully less than $50 for the entire setup ($40 for the Spark core, $10 for sensors).

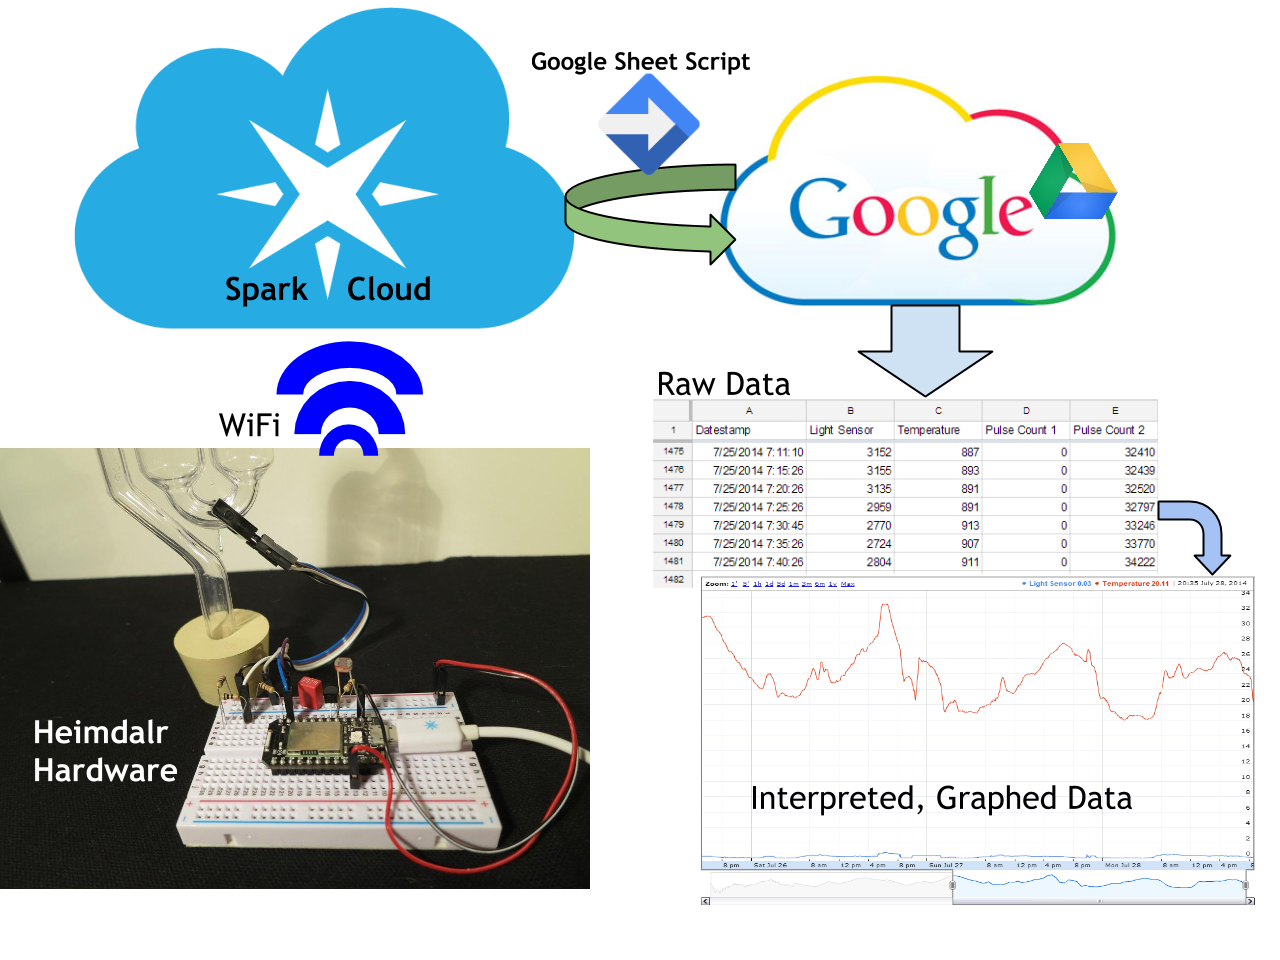
The design concept is fairly simple, thanks to a bunch of preexisting services.  I used a Spark core because it's cheap (for a widget with WiFi), and the Spark API makes it super easy to export data and make it externally accessible.  Next I set up a Google Spreadsheet with a Script which periodically polls the device for new data and adds the raw data to a spreadsheet.  I use the spreadsheet to interpret the raw data (for example, converting raw A2D readings to degrees Celsius), and whip up a pretty graph, et voilà!

  • 1 × Spark core "WiFi in the front, ARM in the back."
  • 8 × GP1A57HRJ00F Opto and Fiber Optic Semiconductors and ICs / Optical, Photoelectric Sensors and Switches
  • 1 × Small Photoresistor (GL5528) 1k-10k range
  • 1 × LM92 Sensors / Temperature, Thermal
  • 1 × LM35 Sensors / Temperature, Thermal

View all 6 components

  • Day 6: Every Day I'm Bubblin'

    Alex08/18/2014 at 00:27 1 comment

    I decided it was time to get the bubble sensors working.  I started by changing the main loop to write the onboard LED with the state of the photosensor to aid debugging.  This led me to notice something I've suspected for a while: the main loop is way too long (I'd estimate maybe 200ms; I don't have a scope or anything to measure with).  I refactored a few things to fix this:

    1. I ripped out my photointerrupter debouncing, edge counting code, and replaced it with built-in interrupts.

    2. I changed the main loop to only update one analog sensor each time through the main loop, rather than reading from all four each time.  It still reads each sensor a bunch of times (currently 4) and averages them together.  If I need to make it even faster, I could probably speed things up by doing only one read per loop, and updating the value at the end of 4 iterations.  But this seems to be fast enough for now.

    In the process I noticed that I wasn't actually reading from the LM35 sensor before (I was reading from the TMP36 twice), whoops.  I fixed that, and I'll collect some more sensor data, but this brings up an interesting question: why is it that the first time I read from the TMP36 it's super noisy, but the second time it's not?  Still, it may be a moot point, because the LM92 is producing great results... except when it stops responding for no reason.  I'll keep an eye on it.

    Then I got started figuring out how to get the photo sensor to detect bubbles.  My first thought was to add food coloring to the water.  I experimented with green, blue, and yellow food coloring, and all three combined, but despite being very visually opaque, it apparently stayed pretty much IR transparent.  I guess I experimentally confirmed the results here (which I was hoping were wrong, but no luck): http://www.av8n.com/imaging/dye-spectra.htm

    I realized there are many easier things I can adjust than the absorbance spectrum of the water.  The next thing I tried was cutting power to the LED in the sensor by a factor of 5 by swapping out the current limiting resistors.  While this didn't completely fix the problem, I did notice that there was a particular position on the airlock which caused the sensor to trigger.  A little more careful fiddling led me to discover a point where I could attach the sensor which does seem to detect passing bubbles, even with normal (transparent) water.  Once I get my hands on a hot glue gun I should be good to go.

  • Day 5: Temperature Sensor Showdown

    Alex08/13/2014 at 09:20 0 comments

    I got a couple of new types of temperature sensors: LM92 (2-wire) and LM35 (analog).  The LM35 was a drop-in replacement for the TMP36 I was already using, so that was easy enough.  The LM92 required a bit more finesse, and learning about the Spark core libraries.  I eventually found the built-in I2C library, and with some finagling eventually got it working.  I'll leave it logging temperatures for the next 24 hours or so so I can get a good comparison.  My initial impressions are:

    1. The LM35 is a big improvement over the TMP36 in terms of noise.  It might be enough to just go with the LM35, since it's super easy to use.

    2. All three sensors are relatively self-consistent, but have huge amounts of error between each other: the TMP36, LM35, and LM92 think it's 25C, 28C, 31.5C respectively.

    3. Comparing against my IR thermometer and the thermometer in my clock, the LM35 seems to be the most accurate so far.  That makes it the most accurate, easiest to use, most reliable (LM92 doesn't always come up correctly on the bus, not sure why), and it uses the fewest pins.  I'll collect data overnight, but so far it's looking like the LM35 is going to be the winner here.

    ~

    18 hour Update:
    I found a boolean math bug in my Spark code around parsing the LM92 results, which caused the graph to look like this:

    I fixed the bug (I think).  Maybe that will help the error margins.  Other than that, the new sensors are looking good.  (Note that while the TMP36 and LM35 have smoothing and the LM92 has none, the LM92 is still the smoothest.)

  • Day 4: Photointerrupters

    Alex08/01/2014 at 09:18 0 comments

    I finally got started working on the bubble counting circuit: a photointerrupter mounted across the bottom U-shape of an S-type airlock.  First I wired up the photointerrupter to the Spark core and verified that I could take readings from it.  I wrote some code to poll the photointerrupter rapidly, including some debouncing, and export the results through the same REST API call.  Now the results show up on the graph, as expected.  Next I tried mounting the photointerrupter on the airlock, but bubbles in the water don't consistently trigger the sensor.  I'm planning to experiment with various food dyes to see which are most IR opaque.  If that fails, I'll go back to the previous type of airlock, plus some black electrical tape to break the beam.  (Later I found out how to write interrupts on the Spark core, so I'll change that later.)

  • Day 3: Temperature Data Quality

    Alex08/01/2014 at 09:14 0 comments

    I set up my spark core to log for several days and graphed the results.  The data coming from my temperature sensor was very noisy.  I added some filtering caps, but to no avail.  After examining the datasheet more carefully I discovered that a +/- 2 C range is normal, which is much greater than I would like.  I ordered some new sensors which should have a +/- 0.33 C variance at room temperature, which should give much better results.

  • Day 2: Logging

    Alex08/01/2014 at 09:12 0 comments

    On the second day I worked on my first Spark core app.  It read data from an analog device (a temperature sensor, in this case) and exported the data through the native REST API.  Amazingly everything worked fine on the first try.  Then I set up a Google spreadsheet to put the data into, and set up a script to automatically pull data from the Spark core periodically.  Within an hour or two I had everything working satisfactorily, which is pretty cool.

  • Day 1: Hello World

    Alex08/01/2014 at 09:09 0 comments

    On the first day I set out to figure out how my spark core worked.  I set up the spark core, figured out how to connect it to the wifi (it needed a factory reset), and figured out how to do basic I/O.

View all 6 project logs

Enjoy this project?

Share

Discussions

Similar Projects

Does this project spark your interest?

Become a member to follow this project and never miss any updates