 fandonov
Challenges
The main challenges of this projects were:
-
using a font, different than the one build-in in the display
-
creating images without using too much memory
-
choosing and implementing the forecast algorithm
Font
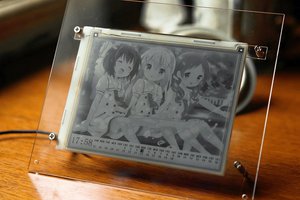
The display has build-in fonts. The problems are, they are raster, non-scalable, have only Latin and Chinese symbols and have only 3 sizes. Even worse, typographic-wise the three sizes are different. I wanted a good-looking interface and mixture of serif and sans fonts makes this impossible. The solution was to define a font in the code as a 3-D array, where every symbol consists of a matrix of 5x7 pixels. At first I used one byte per pixel, but that almost topped up the available memory. So I decided to use 1 byte for every column and to access the pixel info with bit-wise operators. In this way I loose only one bit for column.
The display API library has primitives for drawing filled circle and I use this to draw the symbols. The numbers look like this:

The function I have created expects as a parameter the diameter of the circle and by it the diameter of the circle and space between the circles is controlled. As a result I got a variable-size font, not dependent of the fixed-sized fonts embedded in the screen.
Weather icons
The display supports uploading images to its internal memory, but they are again raster images and thus not scalable. So I decided to create functions in the code for drawing the icons, based on the available graphic functions in the display API and to be able to control the size of the image in the same way as the font characters. At the end I made images for sun, cloud and rain, that can be combined in different ways. I used the primitives for filled circle and rectangle for most of the image parts. Unfortunately the API function for drawing a line does not have parameter for the thickness. So I had to implement my own line drawing function based on the Bresenham algorithm, but instead of pixels I draw filled circles. The size of the circles is the thickness of the line.
Forecast algorithm
I quickly realize that the manufacturers of the existing home weather station does not publish any information about the algorithm they use for choosing what weather prediction icon to show. The only algorithm for that purpose with a description that I found was the Zambretti algorithm, named after its creators Negretti and Zambra and published in the year 1915 (Long live the copyright culture!). The input parameters of the algorithm are season, sea-level pressure, barometric tendency, hemisphere and wind direction. The algorithm is empirical and created for the northern hemisphere and more specifically Great Britain. Analysis made on the algorithm conclude, that wind direction has little effect to the final result, which is a good thing because wind direction sensor in urban environment is hard to use. I get the temperature, humidity and station pressure from the sensor, but the relative pressure should be derived from the station pressure. There are many formulas for that, but the one I use is the following:
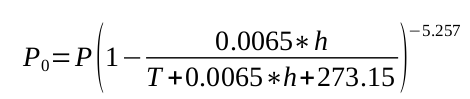
where P0 is the relative sea-level pressure
P is the station pressure in hPa
h is
the altitude in meters
T is the temperature in Celsius.
The problem is how to get the altitude. The sensor I use returns the approximate altitude, but it is based on the barometric pressure and it is affected by it. It is like chicken-and-egg problem. I order to get the exact relative pressure I need the station pressure and the altitude, but in order to get the altitude I need the exact pressure. After some experiments it turned out that if I use the sensor for getting the altitude the calculated sea-level pressure stays almost the same – this is because when the pressure changes the altitude changes too. To solve this problem I came up with the following two ideas:
-
to gather data for the barometric pressure for prolonged period of time and use some average value
-
to use pressure, entered by the...

 Wenting Zhang
 Michael O'Toole
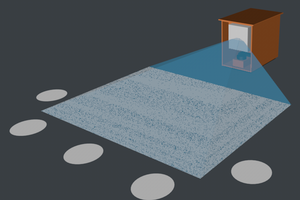
 Timescale
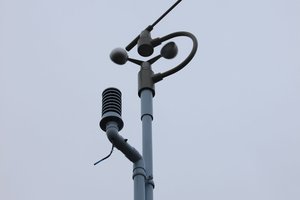
 Tsjakka
I really like the dot-matrix style font and how you implemented it. Nice work!