 Crypto [Neo]
So I've really been hammering away at making sure that we can provide the best product possible I've finished developing the QA Testing SOP, and I'd like to share with you guys a bit about how we certify the Muribots to our quality standards.
If you've been following this blog at all then you know that the Muribot has several specific kinds of sensors onboard:
- Infrared Proximity
- Ambient Light
- Accelerometer
- Gyroscope
- Magnetometer
- Line Sensors
Each of these sensors is subject to environmental noise which causes the readings to vary from ideal values. Additionally there are manufacturing tolerances that vary between even 2 identical looking sensors; This means that we do occasionally get a dead sensor, or one that works but is just too far out of specification to use.
Statistics to the Rescue!
By taking a lot of readings from the sensor we can find the Variance and Standard Deviation of the values. The math behind it all is beyond this article, but a very informal rundown is that Variance is how much the sensor data varies between each reading, and the Standard Deviation is how spread out those values are around the average of all the readings.
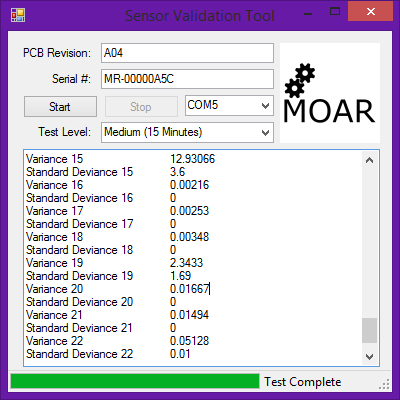
Here's a screenshot from our in-house software we use to verify each Muribots sensor characteristics, this is also the software that generates the calibration sheet that is include with each Muribot. It generates a list of Biases, Variances and Standard Deviances after collecting a bunch of data, and if any of them are out of specification; you'd see (failed!) next to that sensor in the output log. The technician can then replace the sensor, or fail the unit so that you don't receive a robot that isn't up to the specifications you deserve.
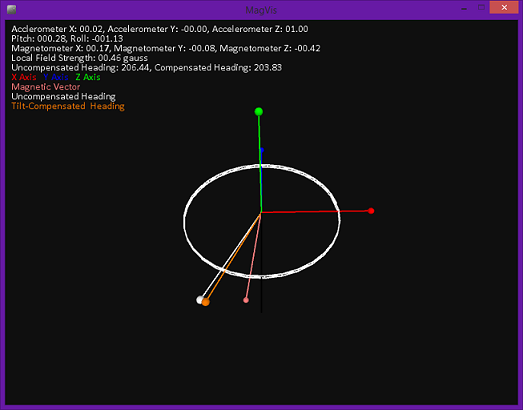
After that test, we put it through a inertial measurement test to ensure the robot is able to track its heading and orientation correctly. This test is actually pretty cool because the model on the screen responds to your movements.
Finally, we test the Gyroscope to make sure it can track and maintain a heading, While the biases for the other sensors are very stable on average, the bias for a gyroscope will drift due to a variety of factors. We filter this drift by updating the gyroscope bias whenever the robot isn't moving. This reduces the amount of drift in the heading to a manageable level and after this the gyroscope reading is predominately influenced by environmental noise, as can be seen here
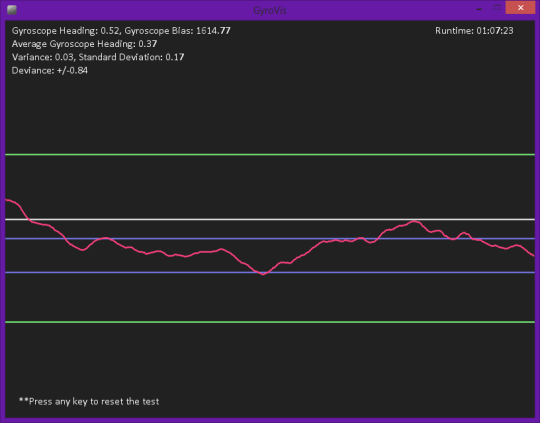
Here is an 13-second interval from an hour long test of the gyroscope showing the noise around the 0° point. This test also measures the variance and standard deviation of the heading data. This test shows that this particular gyroscope is able to maintain it's heading to +/- .84°; even after sitting still for an hour.
So, by using statistics, we can tell just how accurate our sensors are, and just how much they are being affected by the environment. In the next part, I'll show you the final tests we put the robot through before it leaves our hands.
Discussions
Become a Hackaday.io Member
Create an account to leave a comment. Already have an account? Log In.