Close
0%
0%

SerialPlot - Realtime Plotting Software

Small and simple software for plotting data from serial port

Similar projects worth following
This is a Qt based software for plotting data from serial port in real time.

IMPORTANT: instead of commenting please consider creating a ticket at issue tracker (https://todo.sr.ht/~hyozd/serialplot or https://github.com/hyOzd/serialplot/issues) Hackaday's notification system is broken and I may not notice your messages.

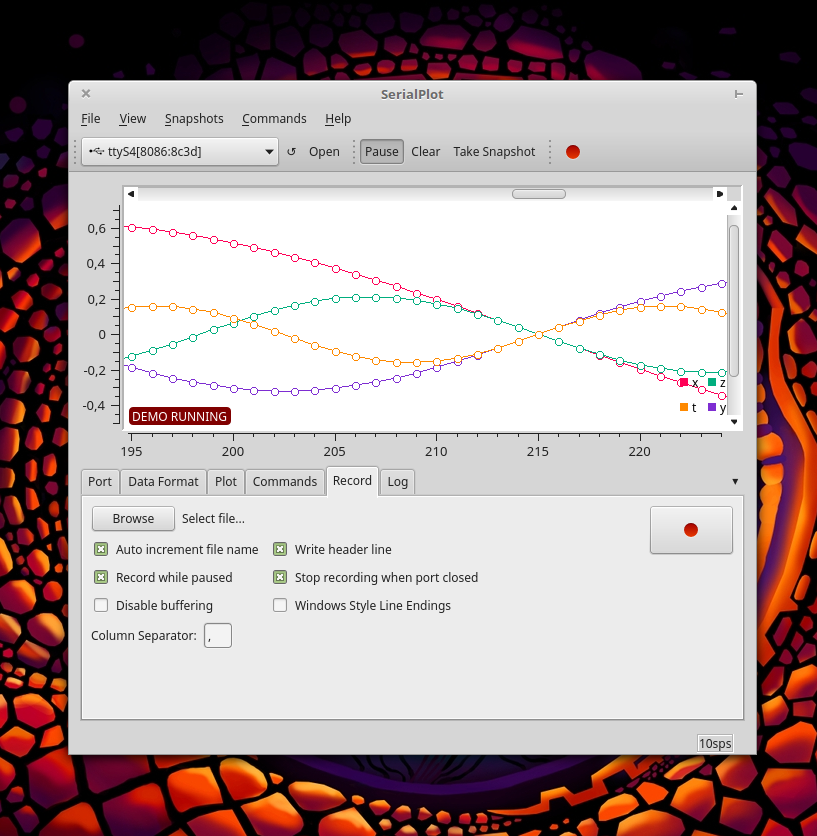
SerialPlot accepts 3 different types of data input:

  • simple binary stream, supports different number formats (unsigned/signed - 8/16/32 bits and float)
  • ASCII data in CSV format
  • user defined custom frame format (frame start byte, frame size, checksum etc..)

You can take snapshots of current view and store them in CSV files. You can also load them back from csv files, for convenient viewing.User can also define "commands" to be sent to the serial port device with a click. Commands can be defined in HEX or ASCII format.

In the sidebar you can find links to Linux and Windows downloads and source code.

  • Moving Project to Git/Github (?)

    Hasan Yavuz Özderya05/31/2021 at 20:11 1 comment

    I'm considering moving this project to git. There has been a few requests. Not many. But I feel like reason is that people just don't request such things unless a project is really really popular. Actually there has been a git repository at github for quite some time. But I did not update it. I only kept it for visibility and as another place for people to create tickets.

    From now on; I will keep github repository up to date which is at: https://github.com/hyOzd/serialplot

    I enjoy using mercurial even though I don't have much opportunity to do so. For a while I will keep using both git and mercurial. There is a mercurial extension called hggit that makes this relatively easy and pain free. For git users there should be no drawbacks.

    To be honest if git repository turns into something popular I will probably stop using mercurial altogether.

  • SerialPlot v0.12 release

    Hasan Yavuz Özderya05/14/2021 at 16:19 3 comments

    This is another minor release. There isn't any significant changes.

    Changes:

    • Filter by prefix for ASCII data format parser (thanks to Alexander Amelkin)
      This is useful when your data is mixed with other information such as log messages. There is no way of displaying such log messages on SerialPlot yet.
    • Export SVG (thanks to martijuerg)
    • Other minor fixes improvements etc:
      • remember user entered custom baud rate
      • add double precision floating point number format support for binary readers
      • fix 'settings invalid' error when loading config with 'first byte is size byte' enabled
      • fix for data format selection can be empty (no button is selected state which is invalid)

    As always you can find latest download links in the sidebar.

    Download links for v0.12:

    Windows installer: https://serialplot.ozderya.net/downloads/serialplot-0.12.0-win32-setup.exe

    Windows EXE 7Zip: https://serialplot.ozderya.net/downloads/serialplot-0.12.0-win32.7z

    Windows EXE: https://serialplot.ozderya.net/downloads/serialplot-0.12.0-win32.exe

    Linux AppImage (based on Ubuntu 18.04): https://serialplot.ozderya.net/downloads/serialplot-0.12.0-x86_64.AppImage

  • SerialPlot v0.11 release

    Hasan Yavuz Özderya09/14/2020 at 11:12 1 comment

    Well, it's been a while.

    But I decided to finally put together a new release. There aren't any big news or changes. To be honest what pushed me to finally create a new release is that I forgot to move the "downloads' section from the bitbucket before they axed the mercurial repositories and as a result got a lot of mails/comments from people around to world. Sorry.

    Here are some changes that come in v0.11:

    • command line options thanks to Mehmet Aslan
    • "value tracker" that displays the sample values under cursor
    • "Text View" panel to display read values
    • Gain and Offset to adjust input data
    • An experimental "Bar Plot" widget
    • added icons for Windows
    • recorder timestamp format
    • decimal precision setting for recorder
    • port read statistics
    • many fixes

    Download links:

    Linux AppImage (Ubuntu Trusty based, should work on anything newer):

    https://serialplot.ozderya.net/downloads/serialplot-v0.11.0-x86_64.AppImage

    Windows 32 bit (should work fine on 64 bit windows):

    https://serialplot.ozderya.net/downloads/serialplot-0.11.0-win32.exe

    Important: I didn't have time to test either of these images. Please let me know if you have any problems with them.

  • Building SerialPlot for Windows using Docker

    Hasan Yavuz Özderya09/14/2020 at 11:02 0 comments

    Building serialplot on windows isn't much different than building on linux. But it isn't as straightforward. Installing dependencies can be difficult. And it is also difficult to build a static EXE that doesn't require DLLs to keep it company. But most importantly it is difficult for me, because I don't use windows other than for gaming purposes. Unfortunately most users of SerialPlot use windows and as a result I can't ignore it.

    Luckily there is MXE to my rescue. This is a cross compilation toolchain to build windows binaries (and more) on a linux (unix like) host. Whats more is that they also provide 'static' toolchains. When you build your project with a static toolchain it is easier to deploy and can be smaller in size.

    So I prepared a dockerfile to make it even easier to build windows using docker. You can build this docker image on linux. AFAIK there are ways to run docker on windows host but I won't go into any details of that. It is also possible to use MXE in msys2, which is a layer to run unix programs on windows. In fact most of the windows releases until now has been built on windows using msys2 and mxe.

    Dockerfile is already included in the serialplot source code called:

    Dockerfile_mxe

    Assuming you have already installed docker, download the serialplot source code using mercurial and build the docker image:

    hg clone https://hg.sr.ht/~hyozd/serialplot/
    cd serialplot
    sudo docker build -t serialplot_mxe -f Dockerfile_mxe ./

    Remember this might easily take a couple hours depending on your internet speed and cpu power. To give you an idea resulting docker image is around 5GB in size.

    If all goes well you can get the built binary from inside the docker image with this command:

    sudo docker run --rm --entrypoint cat serialplot_mxe /serialplot/build_docker_mxe/serialplot.exe > ../serialplot.exe 


  • How to build SerialPlot on Linux

    Hasan Yavuz Özderya09/07/2020 at 07:59 0 comments

    These are the steps for building SerialPlot on linux. I will also provide more detailed steps for Ubuntu and similar debian based distributions.

    Building SerialPlot on linux is quite easy. Most difficult part (not really difficult) is gathering the dependencies. It is possible that you already have some of them installed such as a C++ compiler.

    I've also described how to build with docker which might be the easiest method if you are familiar with it.

    Install Dependencies

    You should have following dependencies installed, preferably using your package manager:

    • Qt5 Development Package (at least version 5.9; recommended 5.15)
    • Qt5 serialport and svg package
    • Cmake (version 3.x)
    • C++ compiler (somewhat new, should support C++11) and make (usually installed with a base package)
    • Mercurial (to download source code, optional)

    On ubuntu or similar operating systems you can install these dependencies with the  following command.

    sudo apt install build-essential qtbase5-dev libqt5serialport5-dev libqt5svg5-dev cmake mercurial

     Note: instead of 'qtbase5-dev' you can install 'qt5-default' package to make sure it is the default qt version.

    Also note: SerialPlot doesn't build with Qt4, you need Qt5.

    Also also note: you need internet access during build process. It is not necessary, but if you don't, you have to also have "Qwt" library installed.

    Get Source Code

    You can download the source code using mercurial with the following command. Mercurial is a version control tool very similar to git.

    hg clone https://hg.sr.ht/~hyozd/serialplot

    Or if you don't want to deal with the mercurial you can download the latest code from this link.

    https://hg.sr.ht/~hyozd/serialplot/archive/tip.tar.gz

    Build

    When you have everything ready, run following commands in the serialplot directory.

    mkdir build
    cmake ..
    make run

     This should build SerialPlot and start it.

    Building AppImage

    When you build SerialPlot this way it probably only works on your computer. It should work on other computers with the same distribution as yours as long as they have the correct libraries installed. If you want to lend your build to your friends you can create a portable executable called AppImage. This should run on most distributions. And it is how I release the Gnu/Linux version of the SerialPlot.

    It is easy to build SerialPlot appimage.

    Run below command in your build directory.

    cmake ..
    make appimage

    That's it. If everything goes well you should  now have SerialPlot appimage in your build directory, and it should run in most distributions (fingers crossed).

    Building with Docker

    There is a Dockerfile inside the serialplot directory ready to go. It is based on Ubuntu 18.04 (bionic) [used to be 14.04 (trusty)]. Building it, produces an appimage that you can use on Ubuntu/Debian based systems. Maybe on other distros too?

    If you don't have it installed, you can install docker on Ubuntu with this command:

    sudo apt install docker.io

    After that, get into the directory of 'serialplot' where the 'Dockerfile' exists and run this command. It might take some time depending on your internet speed.

    sudo docker build -t serialplot_bionic .

     This will build a docker image that should contain the SerialPlot appimage. After building appimage, you should get it from inside the docker image with this command.

    sudo docker run --rm --entrypoint cat serialplot_bionic /serialplot/build_docker/SerialPlot-x86_64.AppImage > ./serialplot.appimage

    Make it executable and start serialplot:

    chmod +x ./serialplot.appimage
    ./serialplot.appimage

    Notes

    Although actual build process is quite simple and straightforward, if you are not experienced you may have issues building SerialPlot successfully. It usually is missing dependencies. It rarely is an incompatible library. In that case please leave a comment : ) I will be happy to help.

    Also if you have steps for other distributions and recommendations, please share, I will...

    Read more »

  • Moving SerialPlot out of bitbucket

    Hasan Yavuz Özderya05/01/2020 at 10:15 4 comments

    Bitbucket is removing mercurial support along with all mercurial repositories.

    I decided to move the source code to sourcehut.

    Here is the mercurial repository: https://hg.sr.ht/~hyozd/serialplot/

    Here is the new issue tracker: https://todo.sr.ht/~hyozd/serialplot

    I haven't moved download files yet. I will probably have to host them myself. Sourcehut doesn't provide file hosting.

  • Sample value tracker development in progress

    Hasan Yavuz Özderya09/27/2018 at 21:11 2 comments

  • SerialPlot v0.10.0 Released

    Hasan Yavuz Özderya09/03/2017 at 15:19 0 comments

    SerialPlot 0.10 is released. This release brings some performance improvements, minor features and bug fixes.

    Instead of "number of samples" option in the "Plot" tab, now there are 2 options you can set. "Buffer Size" and "Plot Width". "Buffer Size" is the total number of samples that are kept in memory, while "Plot Width" is the maximum number of samples that are plotted at once, in X axis. To see previous samples you simply use the X axis scrollbar. The main reason for this distinction is the performance. Previously you couldn't set number of samples too high because SerialPlot tried to plot all data at one time. Now you can set "Buffer Size" to 1.000.000 and it will most likely will be fine as long as you keep "Plot Width" small. Another advantage is that, sometimes when you have frequently changing data, zooming way out doesn't mean much, you have too keep a certain zoom level in X axis to be able to see any detail. If you enjoy the old behaviour you can always set buffer size option same number as plot width and it should be fine. Remember though "plot width" option has a smaller limit then "buffer size" for performance reasons. A note; performance improvements are not done. I'm still working on some improvements to increase "buffer size" limitations.

    Now you can set RS232 control signals (DTR, RTS) and see input signal () statuses from the "Port" tab. Being able to set DTR signal was a requested feature so that SerialPlot can work with Arduino Leanardo board.

    Also we now have an update checker. You can launch it from the "Help" menu. It will check updates once a day when you first launch SerialPlot unless you disable it.

    Other improvements and bug fixes:

    • custom ASCII (csv) data column delimiter
    • fixed snapshot display bug
    • fixed command type not loaded/remembered
    • fixed duplicated channel names

    Check the sidebar for download links. I will try update the win32 version and launchpad PPA later this week.

  • Patch Release 0.9.1

    Hasan Yavuz Özderya05/05/2017 at 12:25 6 comments

    This patch fixes various issues and adds small improvements:

    • fix symbols getting stuck after multiplot mode
    • fix symbols in snapshot view
    • add options to disable (or always enable) symbols
    • panning (Ctrl+Left Mouse) @Maxim
    • show snapshot view in current plot settings
    • fix snapshot view axis stuck at [0-1]

    See downloads links at the sidebar.

  • SerialPlot 0.9 Released (Recording and Scrollbars)

    Hasan Yavuz Özderya04/17/2017 at 12:55 3 comments

    Hi everyone, it's release time. First of all I want to thank everyone who contacted me via various channels for their kind comments! And ideas of course... some to be implemented... some day... : )

    Changes:

    • scrollbars for plot (appears when zoomed)
    • continuous recording to CSV file
    • channels can be hidden and plot colors are adjustable ("Plot" tab)
    • bunch of various GUI improvements and minor bug fixes

    Installation for linux:

    PPA for Ubuntu 16.04 (xenial) and based distros: https://launchpad.net/~hyozd/+archive/ubuntu/serialplot

    Appimage(*) for other distros: https://bitbucket.org/hyOzd/serialplot/downloads/SerialPlot-x86_64.AppImage

    Installation for windows:

    64bit setup: https://bitbucket.org/hyOzd/serialplot/downloads/serialplot-0.9.0-win64.exe

    32bit setup: https://bitbucket.org/hyOzd/serialplot/downloads/serialplot-0.9.0-win32.exe

    (*) Appimage may be broken on some systems. Please let me know if you have any problems.

View all 18 project logs

Enjoy this project?

Share

Discussions

realjago wrote 11/13/2021 at 19:55 point

my co2 sensor sends like this:

c: 1261
t: 22.0
h: 63.0
l: 238

As data format I choosed ASCII and Include: "c:", works perfectly.

Is there a way to get every four values as own graph? I am just able to use one filter, I guess.
And is there a way to just use the current time on x axis?

Thanks for the nice project!

  Are you sure? yes | no

corben.wang wrote 09/09/2021 at 03:20 point

How to reload the exported the CSV file?

  Are you sure? yes | no

Hasan Yavuz Özderya wrote 09/18/2021 at 11:17 point

You can load CSV file as a snapshot from the snapshot menu. It won't appear in the main window.

  Are you sure? yes | no

will63powell wrote 08/12/2021 at 10:11 point

Love this well laid out app. One question - is it possible to plot the decimal equivalent of a binary input (instead of square waves, analogue plot of sensor)?

  Are you sure? yes | no

Hasan Yavuz Özderya wrote 08/19/2021 at 06:59 point

I don't understand 'decimal equivalent of binary input'? There is "simple binary" mode, that plots from binary data.

  Are you sure? yes | no

Yusra wrote 06/04/2021 at 16:45 point

Hello,I really like this program. I just can't figure out where the recorder is saving the files. They show up when I'm in the program, but they are not visible in the folder they are saved in Windows File Explorer. From within serialplot, I have clicked browse, and then right-click on a recorded file and opened it in Notepad, and it was blank. All of my recordings are blank, and I cannot access them. What am I missing?

  Are you sure? yes | no

Etienne M wrote 05/14/2021 at 18:21 point

Just looked for this tool right now and got the update posted 2h ago, perfect timing :)

 I tested, and worked like a charm.
Thanks

  Are you sure? yes | no

Paul wrote 03/23/2021 at 15:42 point

Has anyone looked at connecting to a SSH connection instead of a serial port?

  Are you sure? yes | no

T Woodford wrote 12/10/2020 at 18:01 point

Awesome software, I have an identifier at the beginning of my strings and using 6 accel/gyro readouts (example: $9DOF, 0.0, 0.0, 0.0, 0.0, 0.0, 0.0), I can't find a way to get the software to work with this identifier ($9DOF) in place, I have to mod my output code to drop that identifier, any ideas how it could work with keeping that in place?

  Are you sure? yes | no

Mik Lab wrote 11/19/2020 at 18:05 point

Thank you for the great software. This is the best among the serial plotter I have used.
By the way, I just realized that the time stamped is in unix epoch time format. 

  Are you sure? yes | no

[deleted]

[this comment has been deleted]

Hasan Yavuz Özderya wrote 11/12/2020 at 10:46 point

I think you are looking for "Inset Timestamp" option?

  Are you sure? yes | no

Roberto Bizzarri wrote 11/11/2020 at 14:05 point

Great job! I was just looking fot it! 

Many thanks.

  Are you sure? yes | no

fidom wrote 11/06/2020 at 15:01 point

Absolutely amazing piece of software. You find even better way how to do it than me. Any way how to donate you?

  Are you sure? yes | no

Waleed El-Badry wrote 10/31/2020 at 17:01 point

Hello Hassan, I have a few questions that I hope you can assist me in it:

Although I followed all steps in "https://qwt.sourceforge.io/qwtinstall.html" , the qwt libraries is not detected when trying to compile your project (Ubuntu 18.04).
May I know how to increase the line thickness?
Could you post few steps about how to create an installer after modification of your source code to Windows from Linux if possible?

  Are you sure? yes | no

billson013 wrote 10/01/2020 at 14:09 point

Can You please tell What's the "By Default" 'Frequency' of Serial Plot 0.10.0 ?

i Think it's round 100. Please Confirm

  Are you sure? yes | no

Waleed El-Badry wrote 10/31/2020 at 17:02 point

You can change buffer in plot tab and it will be changed. The data is sampled as fast as it arrives. The x-axis shows the sample number not the sampling time

  Are you sure? yes | no

Rulla wrote 09/26/2020 at 00:19 point

Thanks a lot for this fantastic little tool. i managed to build it for my raspberry pi 3 and i use it to plot the data from my arduino weather station. it works flawless

  Are you sure? yes | no

imanoldiab wrote 05/21/2021 at 19:30 point

Could you give instructions to build on rpi?. I tried and was a nightmare to me. No success

  Are you sure? yes | no

jeromebaron wrote 09/07/2020 at 23:58 point

The download links appears to be broken

  Are you sure? yes | no

Owen Williams wrote 08/25/2020 at 17:05 point

Another very happy customer.  I'm using it on my motor controller projects and it is invaluable.  IMO - I think you'd have a lot more interaction / help / contributors if you moved to github or gitlab.  e.g. people might be able to help getting this built on other platforms.

  Are you sure? yes | no

hallotronix wrote 11/04/2020 at 09:27 point

I second this ! It would be really great if we can get it over github then we can surely make this application more handy !

  Are you sure? yes | no

ShubhangiB18 wrote 07/25/2020 at 06:56 point

Is there any tutorial for the working of serial plot as a guide to import the data from arduino IDE?

  Are you sure? yes | no

akashbkumar wrote 07/15/2020 at 09:33 point

Hello,

May I know, how to graph - float data. If possible could you help me with it

  Are you sure? yes | no

Arya wrote 05/07/2020 at 00:55 point

Great software! Used it successfully for many projects, including paid ones. Is there a way to donate?

  Are you sure? yes | no

Giulio Pons wrote 04/13/2020 at 10:00 point

Very nice project. Is there a way to add a label to a point?

  Are you sure? yes | no

Hasan Yavuz Özderya wrote 04/14/2020 at 11:22 point

No, not at the moment.

  Are you sure? yes | no

Similar Projects

Does this project spark your interest?

Become a member to follow this project and never miss any updates